HAL Id: inserm-00290106
https://www.hal.inserm.fr/inserm-00290106
Submitted on 17 May 2010
HAL is a multi-disciplinary open access
archive for the deposit and dissemination of
sci-entific research documents, whether they are
pub-lished or not. The documents may come from
teaching and research institutions in France or
abroad, or from public or private research centers.
L’archive ouverte pluridisciplinaire HAL, est
destinée au dépôt et à la diffusion de documents
scientifiques de niveau recherche, publiés ou non,
émanant des établissements d’enseignement et de
recherche français ou étrangers, des laboratoires
publics ou privés.
Preoperative brain shift: study of three surgical cases
Omar El Ganaoui, Xavier Morandi, Simon Duchesne, Pierre Jannin
To cite this version:
Omar El Ganaoui, Xavier Morandi, Simon Duchesne, Pierre Jannin. Preoperative brain shift: study
of three surgical cases. Medical Imaging 2008: Visualization, Image-guided Procedures, and Modeling,
Feb 2008, United States. pp.691818-10, �10.1117/12.772634�. �inserm-00290106�
Preoperative Brain Shift: Study of Three Surgical Cases
O. El Ganaoui
a,b,c, X. Morandi
a,b,c,d, S. Duchesne
b,e, P. Jannin
a,b,ca
INRIA, VisAGeS Project-Team, F-35042 Rennes, France
b
INSERM, U746, F-35043 Rennes, France
c
University of Rennes I, CNRS, UMR 6074, IRISA, F-35042 Rennes, France
d
Hospital of Rennes, Department of Neurosurgery, F-35033 Rennes, France
e
Centre de Recherche de l’Universit´
e Laval - Robert Giffard, 2601 De La Canardi`
ere Beauport
QC G1J 2G3
ABSTRACT
In successful brain tumor surgery, the neurosurgeon’s objectives are threefold: (1) reach the target, (2) remove it and (3) preserve eloquent tissue surrounding it. Surgical Planning (SP) consists in identifying optimal ac-cess route(s) to the target based on anatomical references and constrained by functional areas. Preoperative images are essential input in Multi-modal Image Guided NeuroSurgery systems (MIGNS) and update of these images, with precision and accuracy, is crucial to approach the anatomical reality in the Operating Room (OR). Intraoperative brain deformation has been previously identified by many research groups and related update of preoperative images has also been studied. We present a study of three surgical cases with tumors accom-panied with edema and where corticosteroids were administered and monitored during a preoperative stage [t0, t1 = t0+ 10 days]. In each case we observed a significant change in the Region Of Interest (ROI) and in
anatomical references around it. This preoperative brain shift could induce error for localization during interven-tion (time tS) if the SP is based on the t0 preoperative images. We computed volume variation, distance maps
based on closest point (CP) for different components of the ROI, and displacement of center of mass (CM) of the ROI. The matching between sets of homologous landmarks from t0 to t1was performed by an expert. The
estimation of the landmarks displacement showed significant deformations around the ROI (landmarks shifted with mean of 3.90 ± 0.92 mm and maximum of 5.45 mm for one case resection). The CM of the ROI moved about 6.92 mm for one biopsy. Accordingly, there was a sizable difference between SP based at t0 vs SP based
at t1, up to 7.95 mm for localization of reference access in one resection case. When compared to the typical
MIGNS system accuracy (2 mm), it is recommended that preoperative images be updated within the interval time [t1,tS[ in order to minimize the error correspondence between the anatomical reality and the preoperative
data. This should help maximize the accuracy of registration between the preoperative images and the patient in the OR.
Keywords: Neurosurgical Procedures, Brain Shift, MIGNS, Surgical Workflow.
1. INTRODUCTION
This study is set within the context of brain tumor surgery. In this paper, we demonstrate the necessity to update preoperative images in order to allow the recovery of registration error for Multi-modal Image Guided Neurosurgery (MIGNS) systems due to a phenomenon that we call preoperative brain shift. In successful surgery, the neurosurgeon’s objectives are threefold: (1) reach the target, (2) remove it and (3) preserve eloquent tissue surrounding it. Surgical Planning (SP) consists in identifying optimal access route(s) to the target based on anatomical references and constrained by functional areas.1, 2 MIGNS systems have been developed and are being
used to help reach these objectives. A key component of MIGNS is the accurate registration of preoperative images to the intraoperative coordinate system of the patient.3 The first registration step consists in a rigid
transform, based on assumptions that are not verified during neurosurgical procedures. Intraoperative brain deformation has been previously identified by many research groups and related update of preoperative images
Author information: Send Correspondence to O. El Ganaoui, E-mail: [email protected], Telephone: +33 (0)2.23.23.38.29, Fax: +33 (0)2.99.84.71.71
has also been studied.4, 5 One study6has shown that the surface of the brain is deformed by up to 25mm after
skull opening, which could lead to substantial errors in MIGNS systems. To our knowledge, there is no study that discuss the possible deformations before skull opening. In particular, our study addresses the problem of possible deformations in the case of tumors associated with edema at the preoperative stage. Thus, in this paper we introduce the concept of preoperative brain shift.
Tissue edema is a pathological condition involving an increase of the amount of fluid in tissue.7 Brain edema
represents a disturbance of the volume equilibrium which must be compensated by a reduction in other fluid and blood compartments. When this compensation is inadequate, tissue pressure and intracranial pressure increase. For standard hospital protocol, after the diagnosis, the edema is treated by administration of corticosteroids during the preoperative phase until intervention time and no update of images is requested before the intervention. Let us define t0as the time of preoperative image acquisition and tS the time of intervention. During [t0; tS[, the
patient is administered corticosteroids to regularize the intracerebral pressure and to improve neurological deficit due to edema. Since no imaging is typically performed during this interval, the MIGNS system registration, with 2 mm8 of accuracy, is based on preoperative images acquired at time t
0. Our hypothesis is that there
will be deformations of the ROI induced by corticosteroids administration during preoperative stage [t0; tS[.
The edema should shrink, while at the same time the tumor will likely grow. This will induce a significant displacement of neighboring structures over a large region of interest; and to illustrate that point, we present a study of three patients with tumors and severe accompanying edema where corticosteroids were administered and monitored during a preoperative stage [t0, t1= t0+ 10 days]. Our objective is to capture the shift in closed
cranium, in these cases where parameters are controlled (tumor localization, edema volume, tumor volume, and corticosteroids administration) without surgical manipulation and mechanical deformation relied to skull opening. To initialize properly the MIGNS systems by correcting the preoperative brain shift implies proper initialization of the well known brain shift phenomenon.
2. MATERIAL AND METHODS
2.1 Clinical data and images protocol acquisition
The studied cases were three patients with tumors presenting an important surrounding edema: the first patient presented tumor distributed bilaterally with foci in both left and right hemispheres, the second patient revealed right frontal tumor, and the third patient presented ventricular tumor. The treatment consisted in tumor biopsy for the first and third patient, and tumor resection for the second patient. Our imaging protocol included 3T-MR imaging (Philips Medical Systems) using: (1) three-Dimensional (3D) T1-weighted 3T-MRI (T R = 9.89 ms, T E = 4.59 ms, 1 voxel = 1 mm3), (2) 3D T1-weighted Gadolinium enhanced (T R = 9.89 ms, T E = 4.59 ms,
1 voxel ' 1 mm3) to increase the detection of the tumor and (3) 2D axial T2-weighted Flair (T R = 11000 ms,
T E= 125 ms, resolution : 0.34 × 0.34 × 4 mm3) to maximize information about the edema. In respect to our
hypothesis, we set the time t1 to 10 days after the first preoperative acquisition (t1= t0+10 days).
2.2 Image Processing WorkFlow (IPWF)
The IPWF was broken down in two parts: (1) segmentation of the structures in the different MRI sequences; and (2) reformating of all structures in the same reference frame (T1-weighted at acquisition time t0) for comparison.
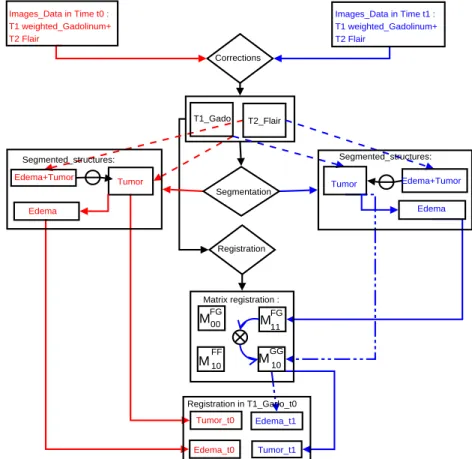
The IPWF (Figure 1) included:
1. Image preprocessing: we corrected the images intensity inhomogeneities9in order to improve the
segmen-tation process. To minimize the impact of noise on the image processing performance, we denoised the images using NL-means algorithm.10
2. Image registration: we performed rigid image registration by maximization of the mutual information between the images using the NEWUOA algorithm.11 We note the matrix of rigid-body registration from
sequence A at ti acquisition time to sequence B at tj acquisition time as follow:
3. Image segmentation: we segmented the structures of interest(i.e tumor, edema, ventricles, and the brain) on the images by combining manual segmentation using ITK-SNAP12and automatic segmentation based
on level set method.13 We noted by VA
ti, i ∈ {0, 1}, A ∈ {T 1, Gado, F lair} the volume segmented from
image sequence A at time acquisition ti.
4. Geometrical transformations of all volumes to the reference frame are noted as following : VtA,Bi,tj = VA ti ∗ M A,B ti,ti ∗ M B,B ti,tj
where VtA,Bi,tj is the volume segmented from sequence A at acquisition time tj reformated to the sequence
B at time ti, i, j ∈ {0, 1} and A, B ∈ {T 1, Gado, F lair}
T1_Gado T2_Flair Registration in T1_Gado_t0 Tumor_t1 Edema_t1 Edema_t0 Tumor_t0 Matrix registration : FG M11 FG M00 GG M 10 M10 FF Segmented_structures: Tumor Edema+Tumor Edema Segmented_structures: Tumor Edema+Tumor Edema Registration Corrections Images_Data in Time t1 : T1 weighted_Gadolinum+ T2 Flair Images_Data in Time t0 : T1 weighted_Gadolinum+ T2 Flair Segmentation
Figure 1. Image processing workflow for volumes segmentation and registration of all volumes in the same reference.
2.3 Estimation of local deformations
The estimation of local deformations was divided into three parts :(1) introduction of a metric to evaluate the percentage of volume change and the nature of deformation (shrinking/dilation), (2) estimation of surface deformations of the structures components of the region of interest (ROI), and (3) estimation of the error introduced by the manual segmentation.
2.3.1 Shrinking/dilation metric
To estimate the volume change of different structures from acquisition time t0 to time t1, we introduced a
local volume change as Vt1
Vt0 and the relative volume change ∆V =
Vt1−Vt0
Vt0 . A positive (negative) value of ∆V
represents, respectively, an increase (decrease) in the volume. The ∆V is a dilation/shrinking metric for results interpretation.
2.3.2 Distance maps visualization
To estimate the deformations of the surfaces of the segmented structures and to visualize these deformations according to the localization of the structures, we developed a tool to extract and visualize a signed Distance Maps (DM ) for the different surfaces. Theses surfaces correspond, respectively, to the segmented structures at time t0(reference structures St0) and t1 (target structures St1).
Without loss of generality, we assumed that 0 < DSC(St0, St1) < 1, where DSC
14 (Dice Similarity Coefficient)
measures the spatial overlap between the two segmentations (St0, St1) and is defined as follow:
DSC(St0, St1) =
2(St0∩ St1)
(St0+ St1)
The distance maps visualization was performed as following: Initialization:
1. Take two point sets St0 and St1
2. Initialize the distance maps DM (x, y) = 0 ∀x ∈ St0, y∈ St1
Iterations:
3. For each point x0∈ St0, find the closest point x1∈ St1
4. Define the sign of the distance: sign(DM (x0, x1)) =
(
(−)(i.e shrinking) if x1∈ Interior(St0),
(+)(i.e dilation) else 5. Calculation of the distance:
DM(x0, x1) = sign(DM (x0, x1)) ∗ kx1− x0k2
Visualization:
6. Display the distance maps for the surfaces St0 and St1,
with color coding proportional to the distance.
2.3.3 Error of manual segmentation and partial volumes effects The expert∗ segmented the tumor twice for one case study at time t
0 and time t1. The variation of volume
between both segmentations gives an approximation of the manual volume segmentation error. The manual segmentation is performed at voxel level. To evaluate the partial volume effects, the expert displayed one segmentation and delineated the corresponding contour. This 3rd segmentation gives a relative volume change
according to subvoxel ignorance.
2.4 Estimation of regional displacements
2.4.1 Landmarks displacement around the ROI
To quantify displacement of neighboring structures to the ROI, the expert identified eight anatomically homol-ogous landmarks Lk
ti, i∈ {0, 1}, k ∈ {0, ..8} using MINC tools
†. We note Lk
01 = (Lkt0, L
k
t1) the matching couple
between landmark Lk
t0 at time t0and the corresponding landmark L
k t1 at t1. We note by kL k 01k2= k(Lkt0, L k t1)k2
the Euclidean distance between each kthlandmark at time t
0 and the kthcorresponding landmark at time t1 .
2.4.2 Reference landmarks displacement vs registration
To validate the precision of landmarks identification according to the error of rigid-body registration used in the image processing WorkFlow, the expert selected eight additional landmarks that are not supposed to be deformed (e.g the nasion, the eyes). We note this set of reference landmarks Fk
ti, i∈ {0, 1}, k ∈ {0, ..8}. The
registration was be accepted if the mean of displacement of the different reference landmarks was less than 1mm.
∗Neurosurgeon, neuroanatomist expert (X.M.) †http://www.bic.mni.mcgill.ca/software/
2.5 Estimation of ROI components displacement: Center of mass displacement
We supposed that the displacement of the ROI components (Tumor, Edema) can be characterized by the move-ment of their center of mass. We defined center of mass for each volume V of ROI components (CM (V )) and we note k(CM (Vt0), CM (Vt1))k2 the Euclidean distance between the volume Vt0 at acquisition time t0 and the
volume Vt1 at acquisition time t1.
2.6 Introduction of Surgical Planning (SP) Error
For each intervention, the SP contribution consists of two parts : (1) localization of the target, and (2) definition of a road map according to the anatomical references (cortical gyri or sulci) and constraints (functional areas). We defined the difference between SP based on the acquisition time t0 (SPt0) and SP based on t1 time (SPt1)
by given couple of errors related to: (1) localization of targets (ROI) from t0 to t1 and (2) displacement of
anatomical references (like cortical gyri or sulci) from t0to t1. If we classify the data according to the treatment,
we can define the error as follow : Error(SPt0, SPt1) =
(
[k(target t0, target t1)k2; k(sulci t0, sulci t1)k2] if resection,
[k(target t0, target t1)k2; M ean(landmarks displacement)] if biopsy.
Where : target t0, target t1 are the targets (tumors for our three surgical cases) from acquisition time t0, t1
respectively and sulci t0, sulci t1 are the sulci from t0, t1.
3. RESULTS
3.1 Estimation of local deformations
3.1.1 Local volume changes
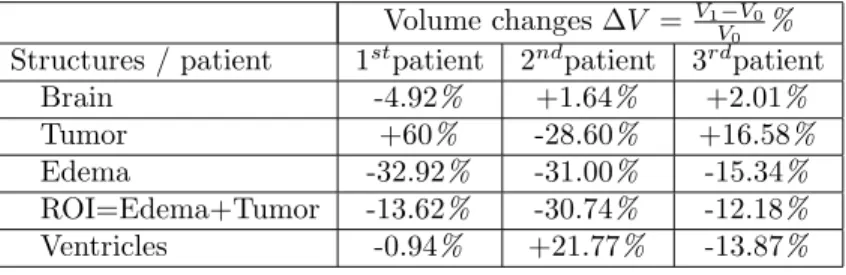
From Table 1, a significant increase in the tumor volumes for the first and the third patient contrasts with decrease of tumor volume for the second patient. However, the edema and the global ROI (edema + tumor) volumes decreased for all patients by at least 12.18%. The variation of volume of ventricles depends on tumor localization. We observe for the second patient a significant increase (+21.77% ).
Table 1. Table representing volume changes ∆V for the three patients
Volume changes ∆V = V1−V0
V0 %
Structures / patient 1stpatient 2ndpatient 3rdpatient
Brain -4.92% +1.64% +2.01% Tumor +60% -28.60% +16.58% Edema -32.92% -31.00% -15.34% ROI=Edema+Tumor -13.62% -30.74% -12.18% Ventricles -0.94% +21.77% -13.87%
3.1.2 Manual segmentation error
Table 2 shows, for the second patient, a non significant partial volume effects due to the manual segmentation by the expert. We observed for the two segmentations of the tumor from time t1a variation: ∆ST umor= −0.407%.
Comparing to the volume changes of the tumor for the second patient (Table 1), we observed: ∆ST umor= −0.407% −28.60% = ∆VT umor
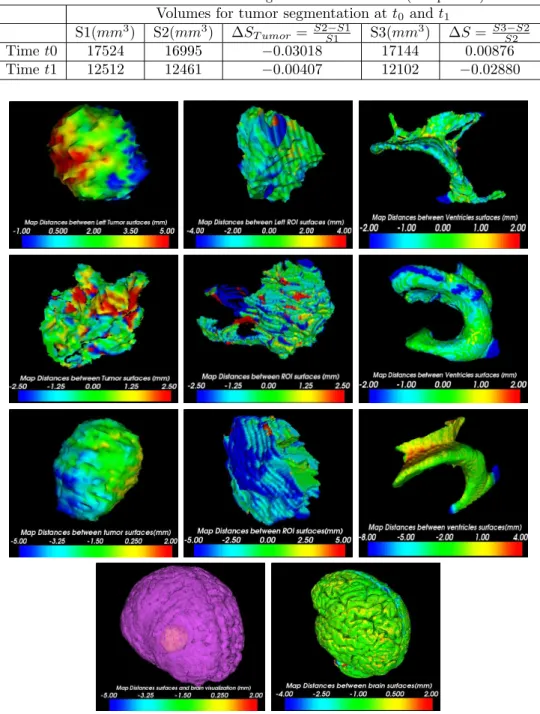
3.1.3 Distance maps visualization
From Figure 2, we distinguished the shrinking/dilation of different surfaces of structures from time acquisition t0
to time t1. The visualization of these distance maps shown location of the shrinking or dilation and illustrates
sig-nificant deformations of surfaces and confirmed the results of volume changes. The visualization of brain distance map from t0 to t1merged with ROI localization shows a shift of the brain according to the shrinking/dilation of
Table 2. Error of manual volume segmentations for tumor (2nd
patient)
Volumes for tumor segmentation at t0 and t1
S1(mm3) S2(mm3) ∆S
T umor= S2−S1S1 S3(mm3) ∆S = S3−S2S2
Time t0 17524 16995 −0.03018 17144 0.00876 Time t1 12512 12461 −0.00407 12102 −0.02880
Figure 2. Signed distance maps, based on closest points algorithm, from reference time t0to targeted time t1.
From left to right, distance maps for tumor, ROI(Edema+Tumor), and ventricles. From top to bottom, the three rows correspond to the 1st
, 3rd
, and 2nd
patient respectively. The last row represents for the 2nd
patient the merging between the tumor localization and the brain distance map.
3.2 Estimation of regional displacement
Table 3 shows a significant displacement of landmarks around the ROI of the three patients. For the 2ndpatient,
the mean of displacement was about 3.90 ± 0.92 mm with maximal displacement of 5.45 mm. In second part, the table shows that the rigid registration applied for our IPWF was accepted. For the three patients, the means were: 0.54±0.31 mm, 0.63±0.30 mm, and 0.83±0.22 mm respectively. The mean of distances between matching reference landmarks was inferior to 1 mm.
Table 3. Euclidean distance k.k2 between each landmark L k
t0 at time t0 and the corresponding landmark L
k
t1 at time t1 for the three patients.
Displacement of Landmarks around the ROI
Patient/k.k2 (mm) L101 L201 L301 L014 L501 L601 L701 L801 µ σ
1st patient 2.14 0.84 1.17 2.36 1.87 1.09 0.89 2.77 1.64 0.69
2ndpatient 2.08 3.07 4.17 4.13 4.36 4.25 3.68 5.45 3.90 0.92
3rd patient 2.16 1.47 1.78 2.47 1.73 2.65 1.87 2.89 2.13 0.46
Displacement of reference landmarks Patient/k.k2 (mm) F1
01 F012 F013 F014 F015 F016 F017 F018 µ σ
1st patient 0.17 0.25 1.15 0.63 0.43 0.93 0.44 0.34 0.54 0.31
2ndpatient 0.37 0.30 0.43 0.72 1.27 0.89 0.49 0.61 0.63 0.30
3rd patient 0.93 1.19 0.66 0.78 0.87 0.40 0.80 1.01 0.83 0.22
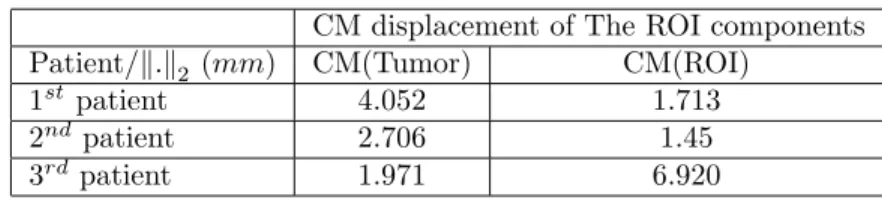
3.3 Estimation of ROI component displacement
From (Table 4) we observed a significant displacement of mass center of the ROI (CM(ROI)); for the 3rdpatient,
the CM(edema+tumor) moved by 6.92 mm and for the 1stpatient, the center of mass of tumor moved by 4.05 mm.
These results coupled with landmarks displacement demonstrate first sizable difference between SP based t0 vs
SP based t1.
Table 4. The displacement of Center of Mass (CM) for the tumor and the global ROI (Edema+Tumor)
CM displacement of The ROI components Patient/k.k2 (mm) CM(Tumor) CM(ROI)
1stpatient 4.052 1.713
2ndpatient 2.706 1.45
3rdpatient 1.971 6.920
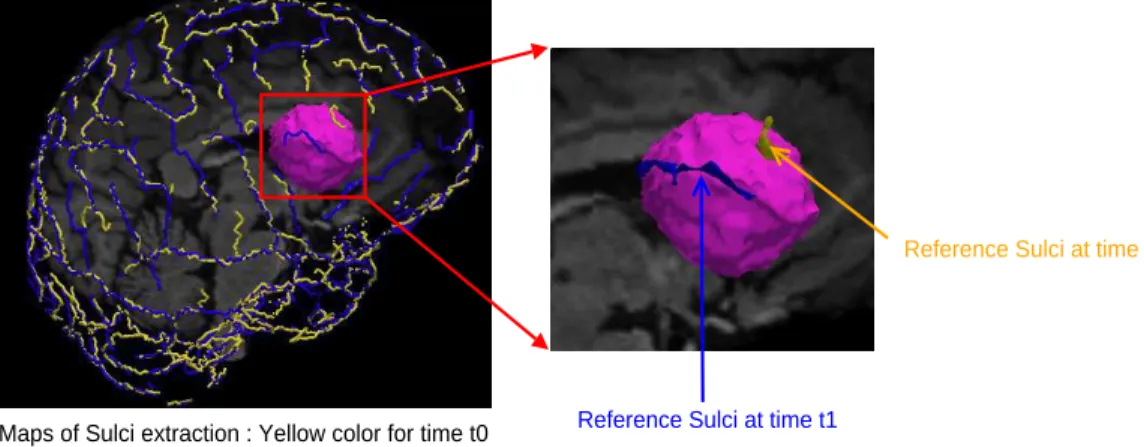
3.4 Surgical Planning (SP) Error
For the second patient, the surgeon defined an optimal sulci, to reach the target, for the planning SPt0 and the
corresponding sulci for the planning SPt1. The left part of the (Figure 3) shows the difference between the sulci
extraction based on time t0(yellow color) and the extraction based on time t1(blue color). The right part of the
(Figure 3) shows the optimal reference sulci to access to the tumor based on SPt0 (yellow) and the corresponding
one according to SPt1 (blue color). The Euclidean distance between the center of mass of the sulci from t0 to t1
was k(sulci t0, sulci t1)k2= 7.95 mm and from (Table 3), we note k(tumor t0, tumor t1)k2= 2.70 mm. It gives
a surgical planning error for the second patient as:
Error(SPt0, SPt1) = [2.70; 7.95]mm
We resume in Table 5 the corresponding errors due to planning based on t0vs planning based on t1for the three
patients.
Table 5. Surgical planning error for the three patients
Surgical planning error 1st patient 2ndpatient 3rdpatient
Reference Sulci at time t0
Reference Sulci at time t1
Maps of Sulci extraction : Yellow color for time t0 and blue color for time t1
Figure 3. The extraction of sulci based on time t0with optimal reference sulci (yellow color) and the extraction based on
time t1(blue color) with optimal reference sulci to access to the tumor.
4. CONCLUSION AND DISCUSSION
Different studies have focused on compensating the brain shift phenomenon and to correct deformation in intra-operative stage.5, 15 Since temporal aspect is a key factor during neurosurgery, to extract an information about
deformation can increase the accuracy of the MIGNS systems. Different parameters related to the phenomenon increase the complexity of the event. Drug responses, gravity, edema and surgical manipulation complicate the understanding of the deformation.4, 16 The brain shift phenomenon is certainly related to the disturbance of
the volume equilibrium and a studies5, 17 have shown a cortical brain surface shift of 10 mm on average, during
surgery and along direction of deformations, after skull opening.
In this study, we addressed another aspect of anatomical deformation related to brain shift in the preoperative phase that we call preoperative brain shift. This preoperative brain shift was restricted to the anatomical brain deformations in closed-cranium. We hypothesized, for our data set of patients (three surgical cases), that the presence of edema and tumor creates a mass effect and that after corticosteroids administration during stage [t0, t1], both the shrinking of edema and growth of tumor induce lack of tissue and provide displacement of
neighboring structures of the ROI. The three surgical cases illustrate the existence of the preoperative brain shift and initialize preliminary measures to understand the shift in closed cranium under controlled parameters (tumor localization, edema volume, tumor volume, and corticosteroids administration) without surgical manipulation. The signed distance maps introduced in this study can be used for understanding and modeling preoperative deformation. According to brain surface deformations, we will be able to localize an optimal craniotomy in order to minimize the shift due to the decrease of intracranial pressure after skull opening. The local volume changes of the components of the ROI can be related to the localization of these components; the significant increase of the volume of ventricles for the second patient (Table 1) can be explained by the fact that the tumor and the edema are inside the ventricles.
On the methodological side, our study suffers from three principal points: (1) rigid body registration, (2) manual segmentation, and (3) intra-expert variability in landmarks identification. For further work, we will introduce elastic body registration to extract the deformation field and to identify the features for direction of deformation. For manual segmentation by the expert, we observed that we can ignore the partial volume effects comparing to the significant volume changes, but we have to introduce the error related to different experts. For homologous landmarks identification, we have to estimate the displacement errors associated with placement of the landmarks and errors of locating the fiducial points due to the intra-expert variability. Another further step of our work will be to propose a realistic model of tumor growth, that is in general difficult,18 and combine it
with model of edema shrinking in order to build a first model for preoperative brain shift.
Further analysis, with more clinical cases, will certainly emphasize a new surgical workflow that determine a time t1∈ [t0, tS[ (tS time of intervention), respecting clinical temporal constraints and processing time of images
(preprocessing, fusion and segmentation), after which new preoperative imaging must be performed in order to initialize properly the MIGNS systems and recover the error of misregistration. In fine, this would be a proper initialization of the intraoperative brain deformation and help approach the reality in the operating room.
ACKNOWLEDGMENTS
We wish to express our thanks to Pr. G. Brassier and all people of the department of neurosurgery (C. Haegelen, S. Diabira) and radiology (J-C. Ferr´e, B. Carsin) of the Pontchaillou Hospital. We thank N. Wiest-Daessl´e and S. Prima for review. Our research is supported by FRSQ/INSERM (S. Duchesne) and a french research ministry grant (O. El Ganaoui).
REFERENCES
1. P. Jannin, X. Morandi, O. Fleig, E. Le Rumeur, P. Toulouse, B. Gibaud, and J. Scarabin, “Integration of sulcal and functional information for multimodal neuronavigation,” Journal of Neurosurgery 96(4), pp. 713– 723, 2002.
2. C. Barillot, P. Coup´e, O. El Ganaoui, B. Gibaud, P. Hellier, P. Jannin, P. Paul, S. Prima, N. Wiest-Daessl´e, and X. Morandi, “Image guidance in neurosurgical procedures, the Visages point of view,” in IEEE International Symposium on Biomedical Imaging: From Nano to Macro, ISBI’2007, pp. 1056–1059, (Washington, USA), April 2007.
3. T. M. Peters, “Image-guidance for surgical procedures,” Physics in Medicine and Biology 51, pp. R505– R540, July 2006.
4. M. I. Miga, K. D. Paulsen, J. M. Lemery, S. D. Eisner, A. Hartov, F. E. Kennedy, and D. W. Roberts, “Model-updated image guidance: initial clinical experiences with gravity-induced brain deformation.,” IEEE Trans Med Imaging 18, pp. 866–874, October 1999.
5. D. W. Roberts, A. Hartov, F. E. Kennedy, M. I. Miga, and K. D. Paulsen, “Intraoperative brain shift and deformation: a quantitative analysis of cortical displacement in 28 cases.,” Neurosurgery 43, October 1998. 6. T. Hartkens, D. L. G. Hill, A. D. Castellano-Smith, D. J. Hawkes, C. R. Maurer, A. J. Martin, W. A. Hall, H. Liu, and C. L. Truwit, “Measurement and analysis of brain deformation during neurosurgery,” Medical Imaging, IEEE Transactions on 22(1), pp. 82–92, 2003.
7. G. Grasso, C. Alafaci, M. Passalacqua, A. Morabito, M. Buemi, F. M. Salpietro, and F. Tomasello, “As-sessment of human brain water content by cerebral bioelectrical impedance analysis: a new technique and its application to cerebral pathological conditions.,” Neurosurgery 50, pp. 1064–1074, May 2002.
8. K. E. Lunn, K. D. Paulsen, D. W. Roberts, F. E. Kennedy, A. Hartov, and L. A. Platenik, “Nonrigid brain registration: synthesizing full volume deformation fields from model basis solutions constrained by partial volume intraoperative data,” Computer Vision and Image Understanding 89(2-3), pp. 299–317, 2003. 9. S. Prima, N. Ayache, T. Barrick, and N. Roberts, “Maximum likelihood estimation of the bias field in
MR brain images: investigating different modelings of the imaging process,” in 4th International Confer-ence on Medical Image Computing and Computer-Assisted Intervention, MICCAI’2001, W. Niessen and M. Viergever, eds., Lecture Notes in Computer Science 2208, pp. 811–819, Springer, (Utrecht, The Nether-lands), October 2001.
10. P. Coup´e, P. Yger, and C. Barillot, “Fast Non Local Means Denoising for 3D MR Images,” in 9th In-ternational Conference on Medical Image Computing and Computer-Assisted Intervention, MICCAI’2006, R. Larsen, M. Nielsen, and J. Sporring, eds., Lecture Notes in Computer Science 4191, pp. 33–40, Springer, (Copenhagen, Denmark), October 2006.
11. N. Wiest-Daessl´e, P. Yger, S. Prima, and C. Barillot, “Evaluation of a new optimisation algorithm for rigid registration of MRI data,” Medical Imaging 2007: Image Processing 6512(1), p. 651206, SPIE, 2007. 12. P. A. Yushkevich, J. Piven, H. C. Hazlett, R. G. Smith, S. Ho, J. C. Gee, and G. Gerig, “User-guided
3D active contour segmentation of anatomical structures: significantly improved efficiency and reliability.,” Neuroimage 31, pp. 1116–1128, July 2006.
13. C. Ciofolo and C. Barillot, “Brain Segmentation with Competitive Level Sets and Fuzzy Control,” in 19th International Conference on Information Processing in Medical Imaging, IPMI’2005, G. Christensen and M. Sonka, eds., Lecture Notes in Computer Science 3565, pp. 333–344, Springer, (Glenwood Springs, USA), July 2005.
14. K. Zou, S. Warfield, A. Bharatha, C. Tempany, M. Kaus, S. Haker, W. Wells, F. Jolesz, and R. Kikinis, “Statistical validation of image segmentation quality based on a spatial overlap index,” Acad Radiol 11, pp. 178–189, February 2004.
15. P. Dumpuri, R. C. Thompson, B. M. Dawant, A. Cao, and M. I. Miga, “An atlas-based method to compen-sate for brain shift: Preliminary results.,” Med Image Anal 11, pp. 128–145, April 2007.
16. P. Dumpuri, R. C. Thompson, T. K. Sinha, and M. I. Miga, “Automated brain shift correction using a pre-computed deformation atlas,” Medical Imaging 2006: Visualization, Image-Guided Procedures, and Display 6141(1), p. 61411F, SPIE, 2006.
17. D. L. G. Hill, C. R. Maurer, R. J. Maciunas, J. A. Barwise, J. M. Fitzpatrick, and M. Y. Wang, “Mea-surement of introperative brain surface deformation under a craniotomy,” Neurosurgery 43, pp. 514–528, 1998.
18. O. Clatz, M. Sermesant, P.-Y. Bondiau, H. Delingette, S. K. Warfield, G. Malandain, and N. Ayache, “Realistic Simulation of the 3D Growth of Brain Tumors in MR Images Coupling Diffusion with Mass Effect,” IEEE Transactions on Medical Imaging 24, pp. 1334–1346, October 2005.