HAL Id: hal-00003364
https://hal.archives-ouvertes.fr/hal-00003364v2
Preprint submitted on 27 Nov 2004
HAL is a multi-disciplinary open access
archive for the deposit and dissemination of
sci-entific research documents, whether they are
pub-lished or not. The documents may come from
teaching and research institutions in France or
abroad, or from public or private research centers.
L’archive ouverte pluridisciplinaire HAL, est
destinée au dépôt et à la diffusion de documents
scientifiques de niveau recherche, publiés ou non,
émanant des établissements d’enseignement et de
recherche français ou étrangers, des laboratoires
publics ou privés.
post-AGB stars from mid-infrared observations
Eric Lagadec, Djamel Mékarnia, José Antonio de Freitas Pacheco, Catherine
Dougados
To cite this version:
Eric Lagadec, Djamel Mékarnia, José Antonio de Freitas Pacheco, Catherine Dougados. Dust
tem-perature and density profiles of AGB and post-AGB stars from mid-infrared observations. 2004.
�hal-00003364v2�
ccsd-00003364, version 2 - 28 Nov 2004
Astronomy & Astrophysicsmanuscript no. 1553.hyper3208 November 28, 2004 (DOI: will be inserted by hand later)
Dust temperature and density profiles in the envelopes of AGB
and post-AGB carbon stars from mid-infrared observations
⋆
E. Lagadec
1, D. M´ekarnia
1, J.A. de Freitas Pacheco
2, and C. Dougados
31
Dpt Cassiop´ee, CNRS-UMR 6202, Observatoire de la Cˆote d’Azur, BP 4229, 06304 Nice Cedex 4, France
2
Dpt Art´emis, CNRS-UMR 6162, Observatoire de la Cˆote d’Azur, BP 4229, 06304 Nice Cedex 4, France
3
Laboratoire d’Astrophysique, Observatoire de Grenoble, 414 Rue de la Piscine, 38400 Saint-Martin d’Hy`eres, France
Received / Accepted 18 November 2004
Abstract. First mid-infrared images of a sample of AGB and post-AGB carbon stars (V Hya, IRC +10216, CIT 6 and Roberts 22) obtained at La Silla Observatory (ESO, Chile) are reported. CIT 6 presents a cometary-like feature clearly seen in the 9.7 µm image, Roberts 22 shows an envelope slightly elongated in the north-east direction while images of V Hya and IRC +10216 are roughly spherically symmetric. Using inversion technique, the dust emissivity was derived from the observed intensity profiles, allowing a determination of the grain temperature and density distributions inside the envelope for these stars. Dust masses and mass-loss rates were estimated for V Hya and IRC +10216. Our results are comparable to those obtained in previous studies if dust grains have dimensions in the range ∼ 0.01 - 0.2 µm. Color maps suggest the presence of temperature inhomogeneities in the central regions of the dust envelopes. In the case of V Hya, an eccentric hot point, which direction coincides with the jet previously seen in [S II] emission, suggest that we are observing a material ejected in a previous mass-loss event. Bipolar lobes are clearly seen in the color maps of Roberts 22 and IRC +10216.
Key words. Stars: AGB and post-AGB; Stars: circumstellar matter; Stars: mass-loss; Stars: imaging; Infrared: stars;
1. Introduction
According to our current understanding of stellar evolu-tion, all stars with main sequence progenitors in the mass range 1 - 8 M⊙, evolve via the asymptotic giant branch
(AGB) phase to the planetary nebula (PN) stage. The early AGB (E-AGB) phase begins as soon as the star fin-ishes burning He in its core and begins to burn He in a thick shell. When both H and He burning shells are active, the star enters in the thermally pulsating AGB (TP-AGB) phase (Iben & Renzini 1983; Bl¨ocker 1999).
The AGB phase is characterized by a strong mass-loss period that only stops when the outer envelope is completely lost (Habing 1996). As the star ascends the AGB, the mass-loss rate increases from solar-like values (10−14M
⊙/yr) up to 10−4M⊙/yr, the so-called
super-wind phase. Dust grains and molecules, predominantly CO, are formed in the wind, producing a circumstellar envelope detectable in the infrared and millimetric do-mains. Although the radiation pressure on dust grains
Send offprint requests to: E. Lagadec, e-mail: lagadec@obs-nice.fr
⋆ Based on observations made at La Silla ESO Observatory
(Chile).
and on molecules is thought to play an important role in the driving mechanism of the wind, different physical as-pects governing the dust formation/destruction processes are still unclear. Processed elements are dredged-up into the atmosphere as a consequence of the re-ignition of the He burning shell (E-AGB phase). A further contraction leads also to the re-ignition of the H burning shell and the star enters a TP-AGB phase. A third dredge-up may take place during this phase and overshooting will contribute to lift carbon to the surface. These events lead to the forma-tion of circumstellar envelopes whose chemical composi-tion reflects that of an atmosphere enriched with nuclear processed matter. C-rich stars have envelopes composed mainly of amorphous carbon while O-rich stars have cir-cumstellar envelopes rich in silicates. Both oxidic and car-bonaceous dust particles are characterized by vibrational bands positioned in the mid-IR window (at 9.7 µm and 18 µm for silicates and at 11.3 µm for SiC) (Henning 1999). Most of the thermal radiation continuum from the dusty envelope is emitted in this wavelength range.
Mid-infrared imaging allow direct probe of the mass distribution through thermal emission arising from dust grains. Therefore a number of imaging studies of AGB and
post-AGB stars have been made at mid-infrared wave-lengths and some emission regions have been resolved (Dayal et al. 1998; Meixner et al. 1999; Ueta et al. 2001a,b; Jura et al. 2002a,b; Kwok et al. 2002; Close et al. 2003; Gledhill & Yates 2003).
In the present work we report mid-infrared imag-ing, with a spatial resolution of about 0.7′′, of a sample
of AGB and post-AGB carbon-rich stars (CIT 6, V Hya, Roberts 22 and IRC +10216) not previously imaged at these wavelengths. Our goals are to derive physical prop-erties of the dust inside the circumstellar envelope and to estimate mass-loss rates. Most of the objects have cir-cumstellar envelopes nearly symmetric, allowing the use of inversion techniques to obtain the dust emissivity and, consequently, the density and the temperature as a func-tion of the radial distance from the star. This paper is organized as follows: in Section 2, observations and data reduction are described; in Section 3, morphological ana-lyzes of the individual objects are presented; in Section 4, we describe our model for the envelope and present the de-rived dust density and temperature profiles; in Section 5 we discuss our results and compare with previous works; finally, in Section 6, the main conclusions are given.
2. Observations and data reduction
Observations were performed on 1995 February 5, 7 at the ESO 3.6-m telescope in La Silla (Chile), using the mid-infrared TIMMI camera (Lagage et al. 1993) with a de-tector consisting of a 64 × 64 pixel Ga:Si array. The result-ing spatial scale of the system is 0.33′′/pix. The log of the
observations is given in Table 1. These observations were made in a standard mid-IR observing mode, by chopping the secondary mirror and nodding the telescope to sub-tract the background emission from the sky and telescope. The chopper throw was 18.3′′ toward the south and the
nod beam position used was 18.3′′ north of the first
posi-tion. To avoid the saturation of the detector by the ambi-ent photon background and to have a good image quality, each individual nod cycle was split into many short ex-posures of ∼ 10 ms. This procedure was repeated for as many cycles as needed to obtain the required total inte-gration time. Nearly diffraction-limited images (∼ 0.7′′
FWHM for point sources) resulted from these short ex-posures. Filter wavelengths were selected in order to ob-tain information on the dust continuum, while maximiz-ing the detection sensitivity. The observations were car-ried out in four narrow-band filters, centered respectively at 8.39 (N1), 9.7 (Silicates), 9.78 (N2), and 11.65 µm (SiC) whose characteristics are given in Table 2. During the dif-ferent runs the seeing was typically 0.7′′- 0.8′′.
Data reduction was performed using IDL self-developed routines. Individual chopped frames were spa-tially oversampled by a factor of 4 and shifted to the near-est 0.25 pixel by using a cross-correlation algorithm to correct for turbulent motions and flexure drifts. Images were then co-added to produce a single flat-field-corrected image, comprising the average of the chop and nod
dif-Table 1.Log of the observations.
Object Date (UT) Filter
CIT 6 1995 Feb 7 N1, Silicates
V Hya 1995 Feb 7 N2, SiC
Roberts 22 1995 Feb 5 N1, SiC
IRC +10216 1995 Feb 5 N1, SiC
Table 2.Description of the filters used.
Filter Central wavelength Filter width
(µm) (µm)
N1 8.39 7.91 - 8.87
Silicates 9.70 9.50 - 10.00
N2 9.78 9.14 - 10.43
SiC 11.65 10.3 - 13.00
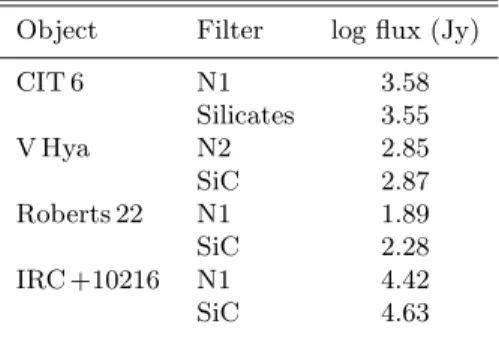
Table 3. Adopted mid-infrared fluxes for observed ob-jects.
Object Filter log flux (Jy)
CIT 6 N1 3.58 Silicates 3.55 V Hya N2 2.85 SiC 2.87 Roberts 22 N1 1.89 SiC 2.28 IRC +10216 N1 4.42 SiC 4.63
ferences, for each filter. Reference stars were observed, analyzed in the same way and were used to derive the instrumental point spread function (PSF) at each filter. Images were deconvolved by using the Maximum Entropy Method (Hollis et al. 1992) and fluxes were obtained by interpolation of IRAS-LRS data. Table 3 gives adopted fluxes for each observed object.
3. Image analysis of individual objects
3.1. V Hya
V Hya (IRAS 10491-2059) is a N type AGB carbon star, with an effective temperature of 2 650 K and a C6 - 7.5e spectral type (Knapp et al. 1997). It is a semi-regular variable, with a period of about 529 days (Lambert et al. 1986), surrounded by a bipolar envelope as shown by CO observations (Tsuji et al. 1988; Kahane et al. 1996) and near-infrared polarization data (Johnson & Jones 1991; Trammell et al. 1994). High resolution op-tical spectroscopy suggests that V Hya is in rapid rota-tion, which could be induced by the presence of a com-panion (Barnbaum et al. 1995). The large infrared ex-cess (van der Veen & Habing 1988) as well as the strong emission in molecular lines indicate that V Hya is losing mass at a rate higher than 10−6
Lagadec et al.: Dust temperature and density profiles of AGB and post-AGB stars 3
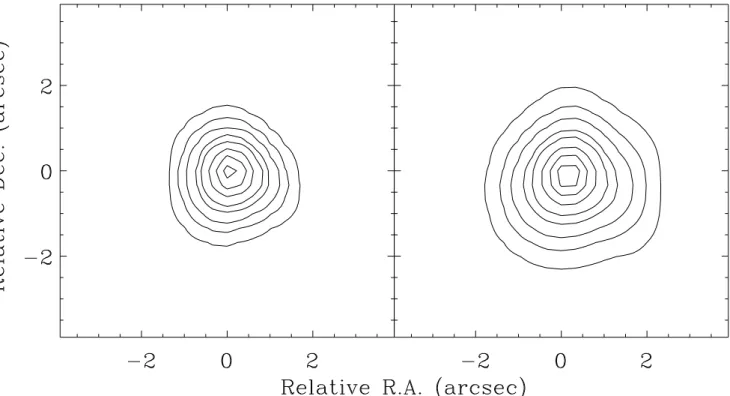
Fig. 1. Contour plots of the 9.78 µm (left) and 11.65 µm (right) images of V Hya. North is up and east is to the left. Contour levels are 90, 70, 50, 30 , 20, 10, 5 and 2 % of the peak surface brightness.
(1997) detected, via CO observations, a fast molecular wind (Vw ∼ 200 km s−1) expanding from the poles of
the envelope and having an increasing velocity with the distance from the star. From recent HST observations, Sahai et al. (2003) report the discovery of a newly ejected high-speed jet-like outflow in this star. These observations, combined with a previous interferometric CO (J=1-0) map of V Hya, favor the picture of an expanding, tilted and dense disk-like structure, oriented north-south present in-side the inner envelope.
We obtained images of V Hya at 9.78 and 11.65 µm (N2 and SiC filters respectively). Images are roughly spheri-cally symmetric in the central parts of the envelope but isophotes become slightly elongated in the south-west di-rection at intensity levels lower than 20 % of the central value. The N2-image has an extension at 2 % intensity level of 4′′
× 4′′ whereas in the SiC filter the dimension
is 4.5′′
× 4.5′′(Fig. 1). The observed elongated feature in
the south-west direction could be associated to the dust emission from material blown away perpendicular to the equatorial disk, consistent with the model proposed by Sahai et al. (2003).
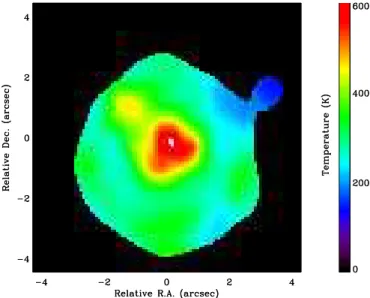
Using the method proposed by Dayal et al. (1998), we derived a color map (9.78 and 11.65 µm filters) for V Hya, which gives an indication of the mean dust temperature along the line of sight, weighted by the density distribution (Fig. 2). The meaning of such an average temperature is discussed in some more detail in Section 4.
One striking aspect of the color map is that the max-imum is off-centered. If we perform a cut in the color
map along the direction defined by the center of the enve-lope (the peak intensity coincides in both filters) and the color maximum (Fig. 3), we observe three distinct peaks: a fainter one at 0.9′′east from the center; a slightly higher
peak at the center of the envelope and a still higher peak at 0.9′′ west from the center. It is worth mentioning that
the direction of this cut is approximately the same as that of the jet observed by Sahai et al. (2003) through the [S II] emission as well as inferred from interferometric CO (J=1-0) maps. Notice that the epoch of these observations corre-spond to 2002 and 1998 respectively. The jet observed by Sahai et al. (2003) has a characteristic expansion timescale of ∼ 3 years and an opening angle of ∼ 20o- 30osin i. The
estimated timescale suggests that the events observed in 1998 and 2002 are probably not the same. Thus, they sug-gested that V Hya undergoes periodic mass ejection events along a direction perpendicular to the equatorial disk. Our color map corresponds to data obtained in 1995, prior to the aforementioned events. If we assume an expansion ve-locity of ∼ 200 km s−1
and a distance of 340 pc, we find an expansion timescale of ∼ 8 yr (the peaks we observe are offset by 0.9′′ from the center and have an opening
an-gle of roughly 40osin i). This timescale suggests that we
are observing a material ejected in a previous mass-loss episode and it is also consistent with the 12 yr period over which the high-velocity [S II] emission has been observed and monitored from 1989 up to 2000 (Lloyd Evans 2000).
Fig. 2.Color map of V Hya. Notice that the emission peak is off-centered what is probably due to the presence of a jet roughly oriented in the east-west direction.
Fig. 3. Cut in the color map of V Hya along the direc-tion defined by the center of the envelope and the color maximum (dot-dashed curve). The solid and the dashed curves are cuts in the same direction made in the N2 and SiC filter maps respectively.
3.2. Roberts 22
Roberts 22 (IRAS 10197-5750) is an optical (10′′
× 24′′)
bipolar proto-planetary nebula (PPN), whose circumstel-lar dust envelope absorbs totally the light emitted by its central star (Allen et al. 1980). This object is also an OH maser source displaying strong emission at 1612 and 1665 MHz, indicating that the circumstellar envelope ex-pands with a velocity of about 20 km s−1
. Optical
spec-Fig. 4. IRAS low resolution spectra of Roberts 22.
troscopy shows that the Hα line profile has wings extend-ing up to ± 450 km s−1
, a signature of high-speed outflow. The bipolar shape of Roberts 22 is confirmed by HST ob-servations. These observations show also a dust waist ori-ented along P.A. of 121o, which darkens the central star
and separates the polar lobes (Sahai et al. 1999). It is in-teresting to note that Roberts 22 display thin shell struc-tures as seen in many PPN (e.g. CRL 2688), which could be due to discrete mass-loss episodes; In addition, a strik-ing aspect of Roberts 22 is that C-rich and O-rich spectral features are seen as in the case of Red Rectangle neb-ula (Waters et al. 1998). A possible explanation is that the O-rich material is a remnant of an earlier mass-loss event that occurred when the envelope of the star was O-rich, followed by the capture and formation of a disk-like structure around a companion, the C-rich material being ejected in a late evolutionary phase, when the star atmosphere became C-rich.
Our 8.39 µm and 11.65 µm images of Roberts 22 show an envelope slightly elongated in the direction north-east/south-west with P.A. ∼ 45o (Fig. 5). The SiC
im-age (11.65 µm) resembles pictures obtained by the HST, since the X-shaped structure can be guessed, but be-ing broader than in HST images. This structure could be due to the presence of an extended dust envelope not only along the equator but also inside the lobes ob-served in optical diffused light. Differently from V Hya and IRC +10216, IRAS low resolution spectra of Roberts 22 (Fig. 4) shows clearly two emission components, peaking respectively around 8 µm and 12 µm. Our images were ob-tained at these wavelengths, excluding the application of our method (see Section 4) to derive the distributions of density and temperature.
In Figure 6 a color map (8.39 and 11.65 µm filters) of Roberts 22 is shown. In this map the elongated
north-Lagadec et al.: Dust temperature and density profiles of AGB and post-AGB stars 5
Fig. 5. Contour plots of the 8.4 µm (left) and 11.65 µm (right) images of Roberts 22. North is up and east is to the left. Contour levels are 90, 70, 50, 30, 20, 10, 5 and 2 % of the peak surface brightness.
Fig. 6. Color map of Roberts 22. Warm grains are ob-served at the center of the nebula, as well as in a jet-like structure with P.A. ∼ 45o.
east/south-west structure is clearly seen as well as some structures suggesting the existence of local temperature variations, probably produced by different physical prop-erties of dust grains inside the envelope.
3.3. IRC +10216
IRC +10216 (IRAS 09452+1330) is the closest, and thus one of the most studied C-rich AGB stars. Its
circumstel-lar envelope is roughly spherical but composed of many discrete and incomplete shells (Mauron & Huggins 2000). From near-infrared speckle-masking interferometry obser-vations, Weigelt et al. (1998) were able to resolve five individual clumps within a distance of 0.21′′ from the
central star. After six years of monitoring these struc-tures, the onset of a fast wind phase is hardly suggested (Weigelt et al. 2002), although significant velocities might be guessed through proper motion measurements. These clumpy structures seems to be consistent with the expec-tations of the Interacting Stellar Winds model (ISW) of Kwok et al. (1978), which describes correctly the shape of a planetary nebula in which a fast wind starting at the end of the AGB phase interacts with a low velocity fossil material. IRC +10216 would presently be in the fast wind phase whose onset is relatively recent.
A large number of observations of this star is available in the UBV filters (Mauron et al. 2003), radio (Gensheimer et al. 1995) and infrared (Weigelt et al. 1998 and refer-ences therein). However, to our knowledge, no direct mid-infrared images have been published in the literature. Here we report the first images of this star in narrow band filters at 8.39 and 11.65 µm (N1 and SiC filters). In these images, IRC +10216 appears to be roughly spherically symmet-ric, having a spatial extensions at 2 % intensity level of 3.5′′
× 3.5′′ and 4.5′′
× 4.5′′ in the N1 and SiC filters,
respectively (Fig. 7).
In Figure 8 the color map (8.39 and 11.65 µm filters) is shown. An elongated structure with the same orienta-tion as the near-infrared image of Weigelt et al. (1998) is
Fig. 8.Color map of IRC +10216. The envelope is roughly spherically symmetrical but displays inhomogeneities in the dust temperature distribution.
clearly seen as well as inhomogeneities in the temperature distribution. The cold region observed in the north-west is probably an artifact since the signal-to-noise ratio is small at these intensity levels.
3.4. CIT 6
CIT 6 (IRAS 10131+3049) is an “extreme” carbon star be-lieved to be undergoing a transition between the AGB phase to the PN stage (Trammell et al. 1994). CIT 6 is the second brightest carbon star at 12 µm after IRC +10216. It is a long-period-variable star with a period of ∼ 628 days (e.g. Alksnis 1995), and was classified as PPN by Johnson & Jones (1991). However, the estimated photospheric tem-perature of ∼ 2 800 K (Cohen 1979) implies that the star is still near the AGB. Visible and infrared polarization measurements show that the light at these wavelengths is highly polarized, with a strong variation of the polariza-tion angle with the wavelength, indicating that the dis-tribution of the circumstellar material around this star is asymmetric (Trammell et al. 1994 and references therein). CIT 6 has been observed with a ∼ 50 mas spatial resolution at 2.2 µm and 3.1 µm, using aperture mask-ing techniques at the Keck I Telescope (Monnier et al. 2000). The object was resolved into two main compo-nents: a bright elongated feature showing shape varia-tions (north component) and a fainter bluer (south) com-ponent about 66 mas away. The observed shape varia-tions suggest an evolution of the dust envelope, which can be explained by changes in the illumination pattern. CIT 6 was also observed with WFPC2 aboard the HST, through the filters F439W (0.429 µm), F555W (0.525 µm), and F675W (0.674 µm). Both components are seen in F675W and F555W images while in the F439W image only the south component is seen. These observations are consistent with a binary star scenario where the north
component presents a 640 day pulsation period not seen in the south component, probably a main sequence A-F star. Associated to the latter, a cometary-like feature ex-tending along the south-west direction can be seen in the 3.1 µm images (Monnier et al. 2000). Recently, Schmidt et al. (2002) concluded from HST imaging, ground-based spectroscopy and spectropolarimetric observations, that a third closely coupled companion would be required to explain the bipolar morphology of this star.
Here we report the first mid-infrared imaging of CIT 6 at 8.39 µm (N1) and 9.7 µm (Silicates). The cometary-like feature is clearly seen in the 9.7 µm image (Fig. 9) ex-tending up to 7′′ (at 1 % intensity level) from the
cen-ter of the envelope at P.A. ∼ 230o (the north and south
components seen in the near infrared are not resolved in our images). This cometary-like feature which is less ex-tended and less prominent in the 8.4 µm image compares well with pictures at 3.1 µm (Monnier et al. 2000) and is roughly orthogonal to the extended structure seen in the F439W HST image. The morphology of CIT 6 seen in the optical and near-infrared domains can qualitatively be ex-plained if the bipolar nebula is essentially seen through its scattered light. The central star is obscured by a central disk or torus of dust. The dominance of the northern pole observed in the near-infrared indicates an inclination to-ward us (Monnier et al. 2000). This picture is supported by linear polarization data in the infrared but it does not ac-count for the cometary shape seen in blue WFPC2 images (Trammell et al. 1994) and in our mid-infrared images. No satisfactory flux calibration of our images was obtained.
4. The Model
In spite of the presence of some asymmetries in the outer envelope of these objects, here we consider a spherical ge-ometry as a first approximation to derive the temperature and the density profiles of the circumstellar dust around V Hya and IRC +10216. Roberts 22 and CIT 6 were ex-cluded from our modeling, since the former has at least two emission components and the latter shows clearly elongated isophotes. Our procedure is the following: in a first step, from the isophotal contours we derive the equiv-alent radius a defined by the relation a =p(S/π), where S is the area delimited by the isophote of intensity I(a).
If the outer nebular light at ∼ 10 µm is dominated by the emission of warm dust grains and if the nebula is op-tically thin at these wavelengths, then the intensity at a projected distance a from the center is
I(a) = 2 Z Re a j(r)√ rdr r2 − a2 (1)
where Re is the outer radius of the dust envelope and
j(r) is the dust emission coefficient, which is a function of the distance r from the star. The equation above can easily be written under the form of an Abel integral, whose
Lagadec et al.: Dust temperature and density profiles of AGB and post-AGB stars 7
Fig. 7. Contour plots of the 8.4 µm (left) and 11.65 µm (right) images of IRC +10216. North is up and east is to the left. Contour levels are 90, 70, 50, 30, 20, 10, 5 and 2 % of the peak surface brightness.
a
r
z
Fig. 10.Schematic view of the nebula considered as spher-ically symmetric. The observer is on the right. So we have I(a) = 2Rzmax
0 j(r)dz, where I is the intensity received
and j the emissivity of the dust grains.
inversion method is quite well known. Therefore, the dust emission coefficient is given by
j(r) = −π1 Z ∞ r ∂I ∂ada √ a2 − r2 (2)
On the other hand, from its definition, the dust emis-sivity can explicitly be written as
j(r) = ng< r 2
g > QλBλ(Tg) (3)
where ng is the dust grain density, < r2g > is the dust
grain mean square radius, Qλis the emission (absorption)
efficiency and Bλ(Tg) is the Planck’s function at the grain
temperature Tg. If the dust emissivity is derived at two
different wavelengths λ1and λ2, then their ratio is simply
jλ1 jλ2 =Qλ1 Qλ2 Bλl(Tg) Bλ2(Tg) (4)
The grain temperature can be derived from Eqs.(2) and (4) if we assume a given chemical composition and dimension for the dust grains. Once the temperature dis-tribution is obtained, the grain density can be evaluated from Eq.(3). Notice that larger is the difference between λ1 and λ2, higher is the accuracy in the determination of
the temperature distribution and the grain density. The emission efficiency of the grains Qλwas computed
using the Mie’s theory, assuming homogeneous and spher-ical grains constituted of amorphous carbon with a mass density of 2 g cm−3. Optical properties were taken from
laboratory data (Rouleau & Martin 1991; Suh 2000; Jager et al. 1998, hereafter respectively Model 1, 2 and 3). The choice of dust parameters is somewhat arbitrary, since there are no strong observational constraints on them. Thus, grain dimensions were chosen to be comparable to those adopted in previous studies, whenever existent.
For numerical reasons, in order to invert the Abel in-tegral, we preferred to adopt an analytical representation for the intensity I(a) derived from our data. In fact, the function
I(a) = A [1 + (a
r0)
Fig. 9. Contour plots of the 8.4 µm (left) and 9.7 µm (right) images for CIT 6. North is up and east is to the left. Contour levels are 90, 70, 50, 30 , 20, 10, 5 , 3, 2 and 1 % of the peak surface brightness.
represents quite well the observed intensity profiles. The resulting fit parameters for the different objects are shown in table (4).
To verify the consistency of our assumption, namely, an optically thin envelope at the considered wavelength, the optical depth at 11.6µm was computed from the equa-tion below and the derived density distribuequa-tion.
τ = Z
πr2
gQλng(r)dr, (6)
Grains sizes ranging from 0.007 µm up to 5 µm and dust optical properties taken from Models 1, 2 and 3 were used. The derived optical depth values (Table 5) are con-sistent with the hypothesis of an envelope optically thin at ∼ 10 µm, since for all models τ ≤ 0.3. As an additional check, other flux values in the interval 8 - 12 µm were com-puted and compared with IRAS data. The good agreement between expected and observed values reinforce the basic assumption of our model.
Color maps are usually interpreted as ”temperature maps” (Dayal et al. 1998). If the medium is optically thin, the intensity at a given wavelength is given by:
Iλ= Z ng< r 2 g > QλBλ(Tg)dz (7) Let us define: QλBλ(T ) = R ng< r 2 g> QλBλ(Tg)dz R ng< rg2> dz (8)
Then, from Eqs. (7) and (8) one obtains: Iλ1
Iλ2
= Qλ1Bλ1(T ) Qλ2Bλ2(T )
(9)
Eq. 9 tells that a given color corresponds to a given temperature only if this quantity is constant along the line of sight or, in other words, if the temperature is uniform throughout the nebula. Our model implies the presence of temperature gradients, which are clearly seen as, for in-stance, in the color maps of Roberts 22 and IRC +10216. However color inhomogeneities are also detected, which should be interpreted as temperature variations along the line of sight. These local variations are probably due to non-uniformities in the grain properties, which affect the equilibrium temperature and the grain emissivity (see Eq. 9). Therefore the color maps should only be consid-ered as a temperature ”indicator”.
5. Results and discussion
We have applied the aforementioned procedure to V Hya and IRC +10216 in order to derive temperature and den-sity profiles for the dust inside the envelope of those stars. Once the density profile is obtained, the total dust mass (Mdust) can be calculated from
Mdust=
Z Re
Ri
4πr2ng(r)mgdr (10)
where mg= 4πδr3g/3 is the mass of a dust grain (δ being
equal to 2.0 g cm−3 for the amorphous carbon), R i and
Lagadec et al.: Dust temperature and density profiles of AGB and post-AGB stars 9
Table 4.Best fit parameters appearing in Eq. (5).
Object Filter A (erg cm−2s−1 arcsec−2 Hz−1) r
o (arcsec) γ
V Hya SiC 4.86 ± 0.05 ×10⁻²¹ 0.49 ± 0.05 2.66 ± 0.05
N2 4.79 ± 0.05 ×10⁻²¹ 0.48 ± 0.05 2.70 ± 0.05
IRC +10216 SiC 1.03 ± 0.01 ×10⁻¹⁹ 0.73 ± 0.01 2.47 ± 0.05
N1 1.24 ± 0.01 ×10⁻¹⁹ 0.63 ± 0.01 2.64 ± 0.07
Fig. 11.Temperature and density profiles of V Hya obtained with the model parameters: d = 340 pc, rg= 0.2 µm (left)
and d = 340 pc, rg= 5 µm (right) respectively. The solid, dot-dashed and dashed lines curves represent results from
Models 1, 2 and 3 respectively.
Reare respectively the internal and external radius of the
dust envelope. If we assume that the gas-to-dust mass ra-tio ξ and the expansion velocity Veare constant
through-out the dust envelope, then an estimate of the mass-loss rate ˙M can be obtained from
˙
M = ξMdust
Ve
Re
Table 5. Estimated dust optical depths at 11.6 µm for different grain sizes and optical properties. τ (1), τ (2) and τ (3) correspond to Models 1, 2 and 3 respectively.
Object rg τ (1) τ (2) τ (3) V Hya 0.2 2.8 × 10⁻² 2.9 × 10⁻² 1.7 × 10⁻² 5.0 7.5 × 10⁻³ 7.7 × 10⁻³ 8.3 × 10⁻³ IRC +10216 0.007 7.9 × 10⁻² 7.9 × 10⁻² 2.3 × 10⁻² 0.008 7.9 × 10⁻² 2.3 × 10⁻² 4.7 × 10⁻² 0.015 2.3 × 10⁻¹ 1.4 × 10⁻¹ 1.9 × 10⁻¹ 0.05 2.3 × 10⁻¹ 1.9 × 10⁻¹ 2.6 × 10⁻¹ 0.16 2.6 × 10⁻¹ 2.2 × 10⁻¹ 2.7 × 10⁻¹ 5.0 6.0 × 10⁻² 6.6 × 10⁻² 6.8 × 10⁻²
Values for the gas-to-dust ratio ξ adopted by different authors range from 200 (Groenewegen 1997) up to 360 (Knapp et al. 1997). In the present calculations, the value ξ = 300 was adopted and for the expansion velocity, the values derived from CO observations by Loup et al. (1993) were used. It is worth mentioning that whenever the ra-diation pressure drives the mass-loss, dust velocities are known to be usually higher than gas velocities, but differ-ences are expected to be small if drag forces are effective (Steffen et al. 1997). For the external radius Re, we have
adopted the values derived from our images. As we shall see later, the dust density decreases approximately as r−2
and, in this case, the mass-loss rate is almost independent on the value of Re.
5.1. V Hya
Some radiative transfer models have already been pro-posed to represent the circumstellar envelope of this star. Kahane et al. (1996) have modeled this object using millimeter CO observations and an axisymmetric model. Distance estimates for V Hya are in the range 400 pc (derived from Hipparcos data) up to 550 pc (derived by Bergeat et al. 1998 from the period-luminosity relation-ship for carbon stars). However, lower values can be found in the literature. Kahane et al. (1996) adopted a dis-tance of 340 pc and derived a total mass-loss rate of ∼ 1.5 × 10⁻⁶
M⊙/yr and a total mass (gas+dust) for the circumstellar envelope of ∼ 2.1 × 10⁻³
M⊙. Knapp et al. (1997) modeled the dust envelope of V Hya by assuming grains constituted of amorphous carbon with dimensions of 0.2 µm and by adopting a distance of 380 pc. They de-rived an envelope mass of 8.0 × 10⁻³M
⊙ and a mass-loss
rate of 2.5 × 10⁻⁵M
⊙/yr. These values depend on the
op-tical properties of the grains but are significantly higher than those obtained by Kahane et al. (1996).
In our calculations, the distance to the star was as-sumed to be in the range 340 - 550 pc. The masses of the dust envelope and the corresponding mass-loss rates ob-tained for different dust grain parameters and distances are given in Table 6 and in Table 7. Previous estimates are also given. The temperature and density profiles of V Hya
obtained with the parameters d = 340 pc; rg= 0.2 µm and
rg= 5 µm are shown in Fig. 11. The temperature
deter-mination does not depend on the assumed distance but depends on the adopted grain properties. For a grain size of 0.2 µm, the dust temperature ranges from 390 - 460 K at the inner envelope down to 255 - 270 K at the outer parts of the envelope. The higher temperature values cor-respond to optical properties of Model 3. Higher tempera-tures, ranging from 660 K (inner envelope) down to 350 K (outer envelope) are obtained for larger grains (rg= 5 µm)
and, in this case, no significant differences are seen for the different optical properties of Models 1, 2 and 3.
If we compare our mass-loss rates derived with grain parameters similar (rg= 0.2 µm) to those adopted by
Kahane et al. (1996), we notice that the results are com-parable, in spite of differences in the methodology used by those authors with respect to our approach.
5.2. IRC +10216
We have also applied our procedure to the dust envelope of IRC +10216 for distances in the interval 130 - 200 pc and dust grain sizes ranging from 0.007 up to 5.0 µm. Our results are given in Tables 6, 7 and in Fig. 12.
For small grains (rg = 0.16 µm), temperatures attain
600 K in the inner envelope and decrease to 220 K in the outer parts. For larger grains (rg = 5 µm) temperatures in
the inner region are higher ∼ 1200 K, decreasing to values around 300 K in the outer regions of the envelope.
For a distance of 200 pc, the derived dust masses are within the interval 0.7 - 7.9 × 10⁻⁵M
⊙and the
correspond-ing total (gas+dust) mass-loss rates are 0.3 − 3.2 × 10⁻⁵M
⊙/yr.
Being one of the most studied carbon stars, several models for the envelope of this object can be found in the literature. Keady et al. (1988) modeled the envelope of this star using data on the fundamental and first overtone lines of CO, assuming a distance of 200 pc and dust grains com-posed of amorphous carbon of size 0.05 µm. They found temperatures varying from ∼ 1 300 K at 13.5 AU down to 300 K at ∼180 AU. They have estimated a mass-loss rate close to 2 × 10⁻⁵
M⊙/yr. Groenewegen (1997) has considered the effects of a non-steady mass-loss and es-timated a total dust mass of about 1.0 D2
(kpc)M⊙ for a variable mass-loss rate, which should be compared to 0.13 D2
(kpc)M⊙ derived under the usual assumption of a steady flow. An important aspect of this work is the constraint obtained for the grain sizes (∼ 0.16 µm), de-rived from a large body of data. Winters et al. (1994) developed a quite sophisticated model, including a hydro-dynamical gas-dust coupling, thermodynamics, radiative transfer, chemistry in the processes of dust formation and growth. Assuming a distance of 170 pc and a mass-loss rate of 8 × 10⁻⁵
M⊙/yr, they found a dust mass in the en-velope within the range 2.0 - 3.2 × 10⁻³
M⊙. Similar dust masses and mass-loss rates have been found by Danchi et al. (1994) from mid-infrared data.
Lagadec et al.: Dust temperature and density profiles of AGB and post-AGB stars 11
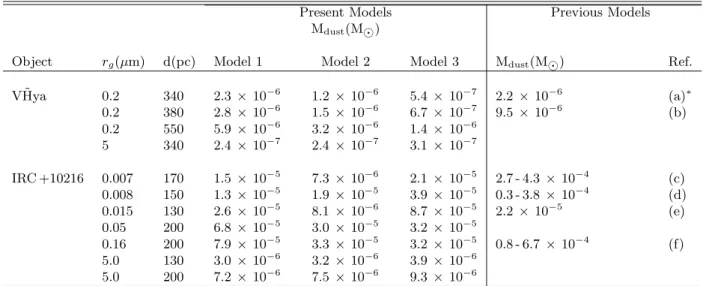
Table 6. Mass of the dust envelope of V Hya and IRC +10216 for different optical models, distances (d) and grain sizes (rg) compared to values derived from the literature. The inner and outer integration radii were 0.1′′ and 4′′ for
V Hya, 0.1′′ and 10′′ for IRC +10216. Dust masses taken from the literature have been scaled to correspond to the
same outer radii as those used in this present work. Expansion velocities have been taken equal to 18.7 km s−1
and 14.7 km s−1
for V Hya and IRC +10216 respectively.
Present Models Previous Models
Mdust(M⊙)
Object rg(µm) d(pc) Model 1 Model 2 Model 3 Mdust(M⊙) Ref.
V ˜Hya 0.2 340 2.3 × 10⁻⁶ 1.2 × 10⁻⁶ 5.4 × 10⁻⁷ 2.2 × 10⁻⁶ (a)∗ 0.2 380 2.8 × 10⁻⁶ 1.5 × 10⁻⁶ 6.7 × 10⁻⁷ 9.5 × 10⁻⁶ (b) 0.2 550 5.9 × 10⁻⁶ 3.2 × 10⁻⁶ 1.4 × 10⁻⁶ 5 340 2.4 × 10⁻⁷ 2.4 × 10⁻⁷ 3.1 × 10⁻⁷ IRC +10216 0.007 170 1.5 × 10⁻⁵ 7.3 × 10⁻⁶ 2.1 × 10⁻⁵ 2.7 - 4.3 × 10⁻⁴ (c) 0.008 150 1.3 × 10⁻⁵ 1.9 × 10⁻⁵ 3.9 × 10⁻⁵ 0.3 - 3.8 × 10⁻⁴ (d) 0.015 130 2.6 × 10⁻⁵ 8.1 × 10⁻⁶ 8.7 × 10⁻⁵ 2.2 × 10⁻⁵ (e) 0.05 200 6.8 × 10⁻⁵ 3.0 × 10⁻⁵ 3.2 × 10⁻⁵ 0.16 200 7.9 × 10⁻⁵ 3.3 × 10⁻⁵ 3.2 × 10⁻⁵ 0.8 - 6.7 × 10⁻⁴ (f) 5.0 130 3.0 × 10⁻⁶ 3.2 × 10⁻⁶ 3.9 × 10⁻⁶ 5.0 200 7.2 × 10⁻⁶ 7.5 × 10⁻⁶ 9.3 × 10⁻⁶
References : a) Kahane et al. (1996); b) Knapp et al. (1997); c) Winters et al. (1994); d) Danchi et al. (1994); e) Men’shchikov et al. (2001); f) Groenewegen (1997).
∗ Based on radio observations. No grain model was used in these models, then estimation of the dust mass was done assuming
a gas-to-dust mass ratio of 300.
Table 7.Mass-loss rates for V Hya and IRC +10216 derived from different parameters and compared with previous determinations as in Table 6.
Present Models Previous Models
˙
M (M⊙yr−1)
Object rg(µm) d(pc) Model 1 Model 2 Model 3 M (M⊙yr˙ −1) Ref.
V Hya 0.2 340 2.0 × 10⁻⁶ 1.0 × 10⁻⁶ 4.7 × 10⁻⁷ 1.5 × 10⁻⁶ (a) 0.2 380 2.2 × 10⁻⁶ 1.2 × 10⁻⁶ 5.2 × 10⁻⁷ 2.5 × 10⁻⁵ (b) 0.2 550 3.2 × 10⁻⁶ 1.7 × 10⁻⁶ 7.6 × 10⁻⁷ 5 340 2.1 × 10⁻⁷ 2.1 × 10⁻⁷ 2.7 × 10⁻⁷ IRC +10216 0.007 170 8.0 × 10⁻⁶ 4.0 × 10⁻⁶ 1.1 × 10⁻⁵ 8.0 × 10⁻⁵ (c) 0.008 150 8.1 × 10⁻⁶ 1.2 × 10⁻⁵ 2.4 × 10⁻⁵ 2.2 - 4.0 × 10⁻⁵ (d) 0.015 130 1.9 × 10⁻⁵ 5.8 × 10⁻⁶ 6.2 × 10⁻⁶ 1.6 × 10⁻⁵ (e) 0.05 200 3.2 × 10⁻⁵ 1.4 × 10⁻⁵ 1.5 × 10⁻⁵ 2.0 × 10⁻⁵ (g) 0.16 200 3.7 × 10⁻⁵ 1.5 × 10⁻⁵ 1.5 × 10⁻⁵ 4.9 × 10⁻⁵ (f) 5.0 130 2.2 × 10⁻⁶ 2.3 × 10⁻⁶ 2.8 × 10⁻⁶ 5.0 200 3.3 × 10⁻⁶ 3.5 × 10⁻⁶ 4.3 × 10⁻⁶
References : a-f) as in Table 6; g) Keady et al. (1988).
Most of the past studies suggest that mass-loss rates for this object are in the range 2 - 8 × 10⁻⁵M
⊙/yr if the
distance is 170 - 200 pc. The present analysis indicates that such values can only be obtained if grain dimensions are in the interval 0.05 - 0.6 µm. Larger grains lead to mass-loss rates one order of magnitude smaller than the aforemen-tioned estimates.
6. Conclusions
In this paper, the first mid-infrared images of a sample of carbon-rich AGB stars are reported. From our data, temperature and density profiles of the dust envelope sur-rounding these stars were derived from a simple inversion method applied to obtain the dust emissivity.
Fig. 12.Temperature and density profiles of IRC +10216 obtained with the model parameters : d = 200 pc, rg= 0.16 µm
(left) and d = 130 pc, rg= 5 µm (right) respectively. The solid, dot-dashed and dashed lines curves represent results
from Models 1, 2 and 3 respectively.
Color maps are compatible with the presence of tem-perature gradients: hot and/or warm dust grains are present in the central regions whereas cold dust grains are seen in outer parts of the envelope. Moreover, these color maps suggest the presence of temperature inhomo-geneities, probably due to local variations of the opti-cal properties of the grains. Color maps strengthen sub-structures eventually present in the envelopes as in the case of V Hya. In this star, the ”hottest point” indicated by the color maximum, does not coincide with the center of the envelope and the direction defined by these two points is practically orthogonal to the equatorial disk observed in the CO maps (Sahai et al. 2003). It is worth mentioning that this direction coincides approximately with the jet seen in [SII] emission. The color map of Roberts 22
indi-cates the presence of bipolar lobes, with north-east side being ”hotter” than the south-west side (Fig. 6).
Temperatures near the central regions (angular dis-tances θ ∼ 1′′) are in the range 300 - 350 K whereas at
θ ∼ 4′′ the values are in the range 250 - 280 K, if we
as-sume grains with typical sizes of about 0.15 µm. Larger grains (rg ∼ 5 µm) give higher values: 430 - 525 K at
θ ∼ 1′′
and 300 - 350 K at θ ∼ 4′′. Comparison with
pre-vious studies, assuming similar grain properties, produce consistent results.
The optical properties of amorphous carbon grains measured in laboratory by different experiments are not exactly the same and were characterized by Models 1, 2 and 3, according to the authors who have performed the measurements. The temperature depends on the ratio
be-Lagadec et al.: Dust temperature and density profiles of AGB and post-AGB stars 13
tween the grain absorption efficiency Qλ at two (nearby)
wavelengths (see Eq. 4). Thus, the resulting values are not significantly altered according to the adopted set of measurements of the grain properties. This is not the case for the grain density, which depends directly on Qλ (Eq.
3). As a consequence, densities derived from Model 1 are always larger than those derived from Models 2 and 3, if small grains (rg ∼ 0.1 µm) are considered. For larger
grains (rg ∼ 5 µm) the differences are not significant.
Our calculations are based on the hypothesis that the dust envelope is optically thin at wavelengths around 10 µm. The consistency of this assumption was verified a posteriori, since optical depths are indeed less than one and the computed spectrum in the interval 8 - 12 µm is consistent with IRAS-LRS data, in the cases of V Hya and IRC +10216. The estimated mass-loss rate for V Hya is compatible with that derived by Kahane et al. (1996), if grain dimensions of about 0.2 µm are adopted and one uses the optical Models 1 or 2. Model 3, with the same grain size, leads to a mass-loss rate a factor of three smaller. However, we notice that for a grain size of 0.2 µm, Knapp et al. (1997) derived a mass-loss rate one order of magnitude higher than our values. A similar analysis for IRC +10216 leads to the conclusion that, for distances of about 200 pc, our mass-loss rates are in agreement, in particular, with the determinations of Keady et al. (1988) and Groenewegen (1997) if grain sizes in the range 0.05-0.16 µm are adopted, independent of optical grain model.
Acknowledgements. We thank the referee, H. Olofsson, for sug-gestions that led to significant improvements of this paper. We would also like to thank H. Bourdin for providing his dispima graphics software. E.L. would also like to thank S. Peirani for instructive conversations about “ISSA NISSA”.
References
Alksnis, A. 1995, Baltic Astron., 4, 79
Allen, D. A., Hyland, A. R. Caswell, J. L., 1980, MNRAS, 192, 505
Barnbaum, C., Morris, M., Kahane, C., 1995, ApJ, 450, 862 Bergeat, J., Knapik A., Rutily, B., 1998, A&A, 332, 53 Bl¨ocker, T. 1999, IAU Symp. 191: Asymptotic Giant Branch
Stars, 191, 21
Close, L. M., Biller, B., Hoffmann, W. F., Hinz, P. M., Bieging, J. H., Wildi, F., Lloyd-Hart, M., Brusa, G., Fisher, D., Miller, D., Angel, R., L. 2003, ApJ, 598, L35
Cohen, M., 1979, MNRAS, 186, 837
Danchi, W. C., Bester, M., Degiacomi, C. G., Greenhill, L. J., & Townes, C. H. 1994, AJ, 107, 1469
Dayal, A., Hoffmann, W. F., Bieging, J. H., Hora, J. L., Deutsch, L. K., & Fazio, G. G., 1998, ApJ, 492, 603 Gensheimer, P. D., Likkel, L., & Snyder, L. E. 1995, ApJ, 439,
445
Gledhill, T. M., Yates, J. A. 2003, MNRAS, 343, 880 Groenewegen, M. A. T. 1997, A&A, 317, 503 Habing, H. J. 1996, A&A Rev., 7, 97
Henning, T. 1999, IAU Symp. 191: Asymptotic Giant Branch Stars, 191, 221
Hollis, J. M., Dorband, J. E., Yusef-Zadeh, F. 1992, ApJ, 386, 293
Iben, I. & Renzini, A. 1983, ARA&A, 21, 271
Jager, C., Mutschke, H., Henning, T., 1998, A&A, 332, 291 Johnson, J. J., Jones, T. J., 1991, AJ, 101, 1735
Jura, M., Chen, C., Plavchan, P., 2002a, ApJ, 569, 964 Jura, M., Chen, C., Plavchan, P., 2002b, ApJ, 574, 963 Kahane, C., Audinos, P., Barnbaum, C., Morris, M., 1996,
A&A, 314, 871
Keady, J. J., Hall, D. N. B., Ridgway, S. T., 1988, ApJ, 326, 832
Knapp, G. R., Jorissen, A., Young, K., 1997, A&A, 326, 318 Kwok, S., Purton, C. R., & Fitzgerald, P. M., 1978, ApJ, 219,
L125
Kwok, S., Volk, K., Hrivnak, B. J. 2002, ApJ, 573, 720 Lagage, P., Jouan, R., Masse, P., Mestreau, P., Tarrius, A.,
Kaeufl, H. U., 1993, Proc. SPIE, 1946, 655
Lambert, D. L., Gustafsson, B., Eriksson, K., & Hinkle, K. H. 1986, ApJS, 62, 373
Lloyd Evans, T. 2000, IAUS, 177, 367
Loup, C., Forveille, T., Omont, A., Paul, J. F., 1993, A&AS, 99, 291
Mauron, N., Huggins P. J., 2000, A&A, 359, 707
Mauron, N., de Laverny, P., Lopez, B. 2003, A&A, 401, 985 Men’shchikov, A. B., Balega, Y., Bl¨ocker, T., Osterbart, R.,
Weigelt, G. 2001, A&A, 368, 497
Meixner, M., Ueta, T, Dayal, A., Hora, J. L., Fazio, G., Hrivnak, B. J., Skinner, C. J., Hoffmann, W. F., Deutsch, L. K. 1999, ApJS, 122, 221
Monnier J. D., Tuthill, P. G., Danchi, W. C., 2000, ApJ, 545, 957
Rouleau, F., Martin, P. G., 1991, ApJ, 377, 526
Sahai, R. Zijlstra, A., Bujarrabal, V., Te Lintel, Hekkert, P., 1999, AJ, 117, 1408
Sahai, R., Morris, M., Knapp, G. R., Young, K., Barnbaum, C. 2003, Nature, 426, 261
Schmidt, G. D., Hines, D. C., Swift, S., 2002, ApJ, 576, 429 Steffen, M., Szczerba, R., Men’shchikov, A., Schoenberner, D.
1997, A&AS, 126, 39 Suh, K., 2000, MNRAS, 315, 740
Trammell, S. R., Dinerstein, H. L., Goodrich, R. W., 1994, AJ, 108, 984
Tsuji T., Unno W., Kaifu N., Izumiura H., Ukita N., Cho S., Koyama K., 1988, ApJ, 327, 23
Ueta, T., Meixner, M., Dayal, A., Deutsch, L. K., Fazio, G. G., Hora, J. L., Hoffmann, W. F., 2001a, ApJ, 548, 1020 Ueta, T., Meixner, M., Hinz, P. M., Hoffmann, W. F.,
Brandner, W., Dayal, A., Deutsch, L. K., Fazio, G. G., Hora, J. L. 2001b, ApJ, 557, 831
van der Veen, W. E. C. J., Habing, H. J., 1988, A&A, 194, 125 Waters, L. B. F. M., Cami, J., de Jong, T., Molster, F. J., van Loon, J. T., Bouwman, J., de Koter, A, Waelkens, C., van Winckel, H., Morris, P. W., 1998, Nature, 391, 868 Weigelt, G., Balega Y., Bloecker T., Fleischer A. J., Osterbart,
R., Winters, J. M., 1998, A&A, 333, 51
Weigelt, G., Balega, Y. Y., Bl¨ocker, T., Hofmann, K.-H., Men’shchikov, A. B., Winters, J. M. 2002, A&A, 392, 131 Winters, J. M., Dominik, C., Sedlmayr, E. 1994, A&A, 288,