HAL Id: hal-00303024
https://hal.archives-ouvertes.fr/hal-00303024
Submitted on 2 Aug 2007HAL is a multi-disciplinary open access
archive for the deposit and dissemination of sci-entific research documents, whether they are pub-lished or not. The documents may come from teaching and research institutions in France or abroad, or from public or private research centers.
L’archive ouverte pluridisciplinaire HAL, est destinée au dépôt et à la diffusion de documents scientifiques de niveau recherche, publiés ou non, émanant des établissements d’enseignement et de recherche français ou étrangers, des laboratoires publics ou privés.
Effects on surface atmospheric photo-oxidants over
Greece during the total solar eclipse event of 29 March
2006
P. Zanis, E. Katragkou, M. Kanakidou, B. Psiloglou, S. Karathanasis, M.
Vrekoussis, E. Gerasopoulos, I. Lysaridis, K. Markakis, A. Poupkou, et al.
To cite this version:
P. Zanis, E. Katragkou, M. Kanakidou, B. Psiloglou, S. Karathanasis, et al.. Effects on surface atmospheric photo-oxidants over Greece during the total solar eclipse event of 29 March 2006. Atmo-spheric Chemistry and Physics Discussions, European Geosciences Union, 2007, 7 (4), pp.11399-11428. �hal-00303024�
ACPD
7, 11399–11428, 2007 Eclipse effects on surface atmospheric photooxidants P. Zanis et al. Title Page Abstract Introduction Conclusions References Tables Figures ◭ ◮ ◭ ◮ Back CloseFull Screen / Esc
Printer-friendly Version Interactive Discussion
EGU
Atmos. Chem. Phys. Discuss., 7, 11399–11428, 2007 www.atmos-chem-phys-discuss.net/7/11399/2007/ © Author(s) 2007. This work is licensed
under a Creative Commons License.
Atmospheric Chemistry and Physics Discussions
Effects on surface atmospheric
photo-oxidants over Greece during the
total solar eclipse event of 29 March 2006
P. Zanis1, E. Katragkou2, M. Kanakidou3, B. Psiloglou4, S. Karathanasis5, M. Vrekoussis3,*, E. Gerasopoulos4, I. Lysaridis2, K. Markakis2, A. Poupkou2, V. Amiridis4, D. Melas2, N. Mihalopoulos3, and C. Zerefos4
1
Department of Meteorology and Climatology, Aristotle University of Thessaloniki, Greece 2
Laboratory of Atmospheric Physics, Aristotle University of Thessaloniki, Greece 3
Environmental Chemical Processes Laboratory, Department of Chemistry, University of Crete, Greece
4
National Observatory of Athens, Athens, Greece 5
Region of Central Macedonia, Thessaloniki, Greece *
now at: Institute of Environmental Physics and Remote Sensing IUP/IFE, University of Bremen, Germany
Received: 20 July 2007 – Accepted: 20 July 2007 – Published: 2 August 2007 Correspondence to: P. Zanis (zanis@auth.gr)
ACPD
7, 11399–11428, 2007 Eclipse effects on surface atmospheric photooxidants P. Zanis et al. Title Page Abstract Introduction Conclusions References Tables Figures ◭ ◮ ◭ ◮ Back CloseFull Screen / Esc
Printer-friendly Version Interactive Discussion
EGU
Abstract
This study investigates the effects of the total solar eclipse of 29 March 2006 on surface air-quality levels over Greece based on observations at a number of sites in conjunction with chemical box modelling and 3-D air-quality modelling. Emphasis is given on sur-face ozone and other photooxidants at four Greek sites Kastelorizo, Finokalia (Crete),
5
Pallini (Athens) and Thessaloniki, which are located at gradually increasing distances from the path of the eclipse totality and are characterized by different air pollution levels. The eclipse offered the opportunity to test our understanding of air pollution build-up and the response of the gas-phase chemistry of photo-oxidants during a photolytical perturbation using both a photochemical box model and a regional air-quality offline
10
model based on the modeling system WRF/CAMx. At the relatively unpolluted sites of Kastelorizo and Finokalia no clear impact of the solar eclipse on surface O3, NO2
and NO concentrations can be deduced from the observations and model simulations as the calculated changes in net ozone production rates between eclipse and non eclipse conditions are rather small compared to the ozone variability and hence the
15
solar eclipse effects on ozone can be easily masked by transport. At the polluted sites of Thessaloniki and Pallini, the solar eclipse effects on O3, NO2and NO concentrations
are clearly revealed from both the measurements and 3-D air-quality modeling with the net effect being a decrease in O3and NO and an increase in NO2as NO2formed from
the reaction of O3with NO while at the same time NO2is not efficiently photolysed. It is
20
evident from the 3-D air quality modeling over Greece that the maximum effects of the eclipse on O3, NO2and NO are reflected at the large urban agglomerations of Athens,
and Thessaloniki where the maximum of the emissions occur.
1 Introduction
The effects of a solar eclipse on total ozone column and stratospheric ozone have been
25
ACPD
7, 11399–11428, 2007 Eclipse effects on surface atmospheric photooxidants P. Zanis et al. Title Page Abstract Introduction Conclusions References Tables Figures ◭ ◮ ◭ ◮ Back CloseFull Screen / Esc
Printer-friendly Version Interactive Discussion
EGU
there is only a limited number of studies concerning the solar eclipse induced effects on tropospheric ozone and other photooxidants (Srivastava et al., 1982; Fabian et al., 2000; Zanis et al., 2001; Zerefos et al., 2001).
During a solar eclipse solar radiation changes may affect tropospheric ozone in sev-eral ways and timescales. Tropospheric ozone concentrations maybe directly affected
5
by the JO1D and JNO2 photolysis rate constants changes and indirectly by the NOx
and HOxbudget modifications. Both change the relative strength of sources and sinks
of tropospheric O3. A fast response of tropospheric ozone to solar eclipse stems from the decrease of JNO2 which induces a perturbation from the photostationary steady
state of O3, NO and NO2in Reactions (R1), (R2) and (R3): 10
NO2+ hv(λ < 424 nm) → O(3P) + NO (R1)
O(3P) + O2+ M → O3+ M (R2)
NO + O3→ NO2+ O2 (R3)
As a direct consequence the primary pollutant NO destroys O3 through the titration
Reaction (R3) without O3 being resumed through the NO2 photolysis (R1). This fast
15
ozone response to solar eclipse can be clearly identified in relatively polluted sites such as urban and suburban sites.
A slower response of tropospheric ozone to solar eclipse can result from changes in the UV-B radiation which affect the photolysis rate constant JO1D that photodissociates ozone in the near UV. Changes in UV-B induce changes in the direct ozone loss rate
20
via Reaction (R4), of the production rate of the hydroxyl radical OH (in the presence of water vapor) via reaction (R5) and of the hydroperoxy radicals via Reactions (R6) and (R7):
O3+ hv(λ < 320 nm) → O1D + O2 (R4)
O1D + H2O → 2OH (R5)
ACPD
7, 11399–11428, 2007 Eclipse effects on surface atmospheric photooxidants P. Zanis et al. Title Page Abstract Introduction Conclusions References Tables Figures ◭ ◮ ◭ ◮ Back CloseFull Screen / Esc
Printer-friendly Version Interactive Discussion
EGU
OH + CO → H + CO2 (R6)
H + O2+ M → HO2+ M (R7)
In turn, changes in the OH and HO2 concentrations induce changes in the rates of ozone loss pathways via Reactions (R8) and (R9):
HO2+ O3→ OH + 2O2 (R8)
5
OH + O3→ HO2+ O2 (R9)
and in the ozone production pathway via reaction (R10) when NO is present :
HO2+ NO → OH + NO2 (R10)
The photolysis of other species which are secondary sources of radicals such as HCHO (λ<330 nm) or CH3CHO (λ<330 nm) via radical formation can also affect the
10
surface ozone concentrations. Therefore, surface ozone is expected to be susceptible to solar radiation changes observed during eclipse events.
Zanis et al. (2001) showed that during the eclipse of 11 August 1999 the surface ozone displayed a decrease of around 10–15 ppbv at the urban site of Thessaloniki, Greece (90% sun disk obscuration) while at the rural elevated site of
Hohenpeis-15
senberg, Germany (99.4% sun disk obscuration) the actual surface ozone data did not show any clear eclipse effect. During the 11 August 1999 eclipse event, Mavrakis et al. (2004) found ozone responses to the eclipse over the greater Athens area that varied in terms of timing and intensity as a function of the local emissions, the local topography and the distance from the seashore. Photochemical box model simulations
20
for Freising-Weihenstephan, Germany for the same eclipse event suggested a 4 ppb reduction in the net O3 production until the end of the eclipse. Both measurements and model simulations showed that the partitioning of NOxbetween NO and NO2was
determined almost exclusively by the variations in JNO2(Fabian et al., 2001).
The present work investigates the chemical effects of the solar eclipse of 29 March
25
ACPD
7, 11399–11428, 2007 Eclipse effects on surface atmospheric photooxidants P. Zanis et al. Title Page Abstract Introduction Conclusions References Tables Figures ◭ ◮ ◭ ◮ Back CloseFull Screen / Esc
Printer-friendly Version Interactive Discussion
EGU
part of southeastern Greece experienced the totality of solar eclipse, combined mea-surements of air quality and meteorological parameters were organized at sites located at different distances from the eclipse path. The different solar obscuration at each site combined with a variety of air quality measurements has enabled a thorough repre-sentation and investigation of the response of photochemistry to an abrupt photolytical
5
perturbation.
2 Data and methods
2.1 Description of measurements
The eclipse effects during the 29 March 2006 on the biosphere and on various atmo-spheric layers have been investigated in the frame of a field experiment over Greece.
10
Details about the organization of the experimental campaigns, the measurement sites, eclipse path maps as well as information about the eclipse circumstances for each location are given in an overview paper by Gerasopoulos et al. (2007)1. The measure-ments used in this study were carried out at two urban sites, Pallini (greater Athens area) and Thessaloniki and at two marine rural sites, Finokalia (Crete) and Kastelorizo
15
Island.
The Institute for Environmental Research and Sustainable Development (IERSD) of the National Observatory of Athens (NOA), contacted measurements of gas-phase air pollutants using their automobile station in the framework of the eclipse campaign at Kastelorizo Island. This air quality monitoring includes measurements of (i) ozone
20
(O3), (ii) nitrous oxides (NO and NO2), and (iii) carbon monoxide (CO), with the use of HORIBA Air Pollution Monitoring Systems (AP-360 series). All air quality analyz-ers were carefully calibrated on site using specific gases of known concentration. In addition, various meteorological observations were carried out from a fully automated
1
Gerasopoulos, E., Zerefos, C. S., Tsagouri, I., et al.: The Total Solar Eclipse of March 2006: Overview, Atmos. Chem. Phys. Discuss., submitted, 2007.
ACPD
7, 11399–11428, 2007 Eclipse effects on surface atmospheric photooxidants P. Zanis et al. Title Page Abstract Introduction Conclusions References Tables Figures ◭ ◮ ◭ ◮ Back CloseFull Screen / Esc
Printer-friendly Version Interactive Discussion
EGU
meteorological station: (i) air temperature and relative humidity, (ii) atmospheric pres-sure, (iii) wind speed and direction (6 meters height), (iv) u, v and w wind components using an ultra-sound sonic anemometer, (v) total solar radiation on a horizontal surface, and (vi) direct solar radiation. All parameters were recorded with 1 min time resolution, except for the ultra-sound sonic anemometer measuring at a frequency of 21 Hz.
5
The monitoring station of the University of Crete at Finokalia, Lasithi, Crete is lo-cated 70 km eastward of Heraklion (about 140 thousand inhabitants) and 25 km west of Agios Nikolaos (about 20 thousand inhabitants), the nearest big cities in the area. These cities do not have any noticeable influence on the site due to the prevailing north winds. The station is located on the north coast of Crete exposed to the sea
10
from 270◦–90◦(W–E). An automated meteorological station enables measurements of
air temperature, relative humidity, wind speed and direction and total solar radiation. The photodissociation rates of NO2 (JNO2) and O3to O
1
D (JO1D) as well as Radon-222 (222Rn), O3. NO, NO2, PM10, and other chemical tracers are also monitored and registered every 5 min (2 h for Radon), (Mihalopoulos et al., 1997; Gerasopoulos et
15
al., 2005, 2006). Details about the station and the instrumentation are presented at
http://finokalia.chemistry.uoc.gr/.
The Air Quality Monitoring Network of Athens International Airport (AIA) operates since October 1998 and consists of five permanent and one mobile monitoring sta-tions. The permanent stations are installed in the Municipalities of Glyka Nera, Koropi,
20
Markopoulo, Pallini and Spata while the mobile station is currently located at the airport premises. A wide range of pollutants is monitored using HORIBA Air Pollution Moni-toring Systems (AP-360CE) including: nitrogen oxides (NO and NO2), sulphur dioxide (SO2), carbon monoxide (CO), ozone (O3), particulate matter (PM10), hydrocarbons
(HCs) and benzene-toluene-xylene (BTX). The meteorological parameters measured
25
include: wind speed and direction, air temperature, relative humidity, rainfall, solar ra-diation and atmospheric pressure.
In the Greater Area of Thessaloniki air quality measurements are carried out regu-larly since 2001 by the Region of Central Macedonia (RCM). This monitoring network
ACPD
7, 11399–11428, 2007 Eclipse effects on surface atmospheric photooxidants P. Zanis et al. Title Page Abstract Introduction Conclusions References Tables Figures ◭ ◮ ◭ ◮ Back CloseFull Screen / Esc
Printer-friendly Version Interactive Discussion
EGU
consists of eight fixed monitoring stations equipped with instruments that measure am-bient levels of gaseous (SO2, NO2, NO, CO, O3) and particulate matter (PM10and TSP) air pollutants using a HORIBA Air Pollution Monitoring Systems (AP-360 series). Most of the stations also collect meteorological data (wind direction, horizontal wind speed, ambient temperature and humidity). In this study we used the data collected at the air
5
quality measurement station situated at the roof of the Physics Department of Aristotle University of Thessaloniki (AUTH). During the day of the eclipse event, the air quality (NO, NO2and O3) and meteorological (wind speed, wind direction, air temperature and relative humidity) measurements were recorded with 1 minute time resolution.
2.2 Box modelling
10
The impact of the observed changes in meteorological and chemical parameters during the eclipse on the oxidant levels has been studied with a chemical box model (ECPL box model; Poisson et al., 2001; Tsigaridis and Kanakidou, 2002; Vrekoussis et al., 2004). The commercially available software FACSIMILE (Curtis and Sweetenham, 1988), which uses automatic time step selection and error control appropriate to solve
15
stiff equations like the system of non linear chemical reactions occurring in the tro-posphere, was used to solve the differential equations with a high accuracy required for chemistry studies. The chemistry scheme is a condensed chemical mechanism (about 300 chemical reactions and 140 chemical species). It is able to simulate bound-ary layer photochemistry of ozone, water vapour, nitrogen oxides, carbon monoxide
20
and volatile organics as well as the chemistry of sulphur. In addition to background O3/NOx/OH/CO and CH4chemistry, it also takes into account the oxidation chemistry
of C1-C5hydrocarbons including isoprene (Tsigaridis and Kanakidou 2002; Vrekoussis
et al., 2004; 2006) and biogenic sulphur oxidation mechanisms (Sciare et al., 2000). Oxidation of volatile organic compounds (VOC) by all three major oxidants (O3, OH and 25
NO3) is considered when applicable. Heterogeneous reactions of peroxy and nitrate
radicals are taken into account as explained by Tsigaridis and Kanakidou (2002) and Vrekoussis et al. (2004).
ACPD
7, 11399–11428, 2007 Eclipse effects on surface atmospheric photooxidants P. Zanis et al. Title Page Abstract Introduction Conclusions References Tables Figures ◭ ◮ ◭ ◮ Back CloseFull Screen / Esc
Printer-friendly Version Interactive Discussion
EGU
Chemistry box model simulations have been performed over a 3-day period around the eclipse occurrence over Finokalia. The first day of the simulation was used as spin up time. Observed meteorology, photodissociation rates of NO2 and O3 (JNO2 and
JO1D), NO, NO2 and O3 levels have been used as input to the model every 5 min. Reaction rates driven by meteorological conditions are calculated online. The model
5
has been applied to calculate the free radical levels in the marine boundary layer and evaluate their response to the eclipse. Simulations have been performed both by con-sidering and by neglecting the perturbation of photodissociation rates caused by the solar eclipse.
Similar simulations have been also performed for the other observational sites,
10
Kastelorizo, Pallini (Athens) and Thessaloniki for the day of the eclipse. 2.3 Regional Air-quality modeling
The regional air quality model simulations have been performed with the Comprehen-sive Air quality Model (CAMx version 4.40). CAMx ran with coarse grid spacing over Greece in a spatial resolution of 10×10 km and four fine nests with higher resolution
15
(2×2 km) over the Greater Athens and Thessaloniki areas, Kastelorizo and Finokalia. The domain’s vertical profile contains 15 layers of varying thickness. Layer 1 is 22 m deep, layer 2 extends between 22 and 50 m and subsequent layer depths increase with height. The uppermost layer is 1.5 km thick and extends to about 8 km.
The meteorological fields have been derived from the Weather Research and
Fore-20
casting (WRF version 2.1.2, January 2006) Model developed at the National Center for Atmospheric Research, operated by the University Corporation for Atmospheric Re-search. WRF has been modified accordingly to reproduce the event of eclipse (Founda et al., this issue). The first model domain covers the Balkan area (55×55 grid boxes with 30×30 km resolution), the second domain covers Greece (nested domain with
25
121×121 grid boxes and 10×10 km resolution). The four domains with finer resolution (2×2 km) cover the measuring sites (Athens, Thessaloniki, Kastelorizo, Finokalia). In the vertical WRF model 31 layers between surface and 18.5 km were considered.
ACPD
7, 11399–11428, 2007 Eclipse effects on surface atmospheric photooxidants P. Zanis et al. Title Page Abstract Introduction Conclusions References Tables Figures ◭ ◮ ◭ ◮ Back CloseFull Screen / Esc
Printer-friendly Version Interactive Discussion
EGU
Anthropogenic and biogenic gridded emissions have been compiled for a coarse master domain covering Greece (98×108 cells, 10×10 km) and for the four nested grids with finer resolution (2x2 km). Emission data for gaseous pollutants (NMVOC, NOx, CO, SO2, NH3) and particulate matter (PM10) were estimated for different
an-thropogenic emission sectors such as transport, power plants, the industrial and
cen-5
tral heating sectors. Anthropogenic emissions of the neighbouring countries (Albania, Bulgaria and Turkey) have been taken from the EMEP emission database. Diurnal biogenic emissions over Greece and neighbouring countries have been calculated for every month of the year following the EMEP/CORINAIR methodology (Poupkou et al., 2004). All emissions are injected in the first model layer of 22 m height.
10
Three days of simulation are regarded as “spin-up” time (26–28 March 2006) in order to eliminate the effect of initial conditions. Initial and boundary conditions corresponded to concentrations of clean air. The chemistry mechanism invoked is Carbon Bond ver-sion 4 (CB4). This mechanism includes 117 reactions – 11 of which are photolytic – and up to 67 species (37 gasses, 12 radicals and up to 18 particulates). Photolysis
15
rates were derived for each grid cell assuming clear sky conditions as a function of five parameters: solar zenith angle, altitude, total ozone column, surface albedo, and atmo-spheric turbidity. The rates were taken from a large lookup table that spans the range of conditions for each of the five dimensions. This table has been developed using the TUV photolysis pre-processor following the discrete ordinates method (Madronich,
20
1993).
Photolysis rates have been modified for the eclipse event (09:30–12:00 UTC) by multiplication of the clear-sky photolysis rates Jclear with a factor per which is space-and time-dependent to simulate the differences in sun disk coverage. The presence of clouds modifies further Jclearaccording to the equation:
25
J= per(x, y, t) ∗ [1 + Fc(Ac− 1)] ∗ Jclear (1)
where Fc is the cloud cover fraction and Ac is the vertical cloud attenuation factor, calculated separately for above and within/below clouds.
ACPD
7, 11399–11428, 2007 Eclipse effects on surface atmospheric photooxidants P. Zanis et al. Title Page Abstract Introduction Conclusions References Tables Figures ◭ ◮ ◭ ◮ Back CloseFull Screen / Esc
Printer-friendly Version Interactive Discussion
EGU
In order to analyse the photochemical model performance the Process Analysis (PA) tool has been invoked. The PA tool, implemented in CAMx, allows for a better un-derstanding of the complex interactions in different processes and simulation results within the context of model formulation (CAMx User’s Guide, 2006). Besides the stan-dard gaseous species concentrations involved in tropospheric chemistry (NOx, O3and
5
VOCs) PA allows retrieval of information on parameters calculated by CAMx, like O3
production, photolysis rates and radical concentrations.
3 Results
3.1 Measurements
The time series of measured O3, NO2and NO and solar radiation for the four different 10
sites during the day of eclipse are illustrated in Fig. 1 while the average concentra-tions of the chemical constituents during the time window of the eclipse from 09:30 to 12:00 UTC are shown in Table 1. Based on the NOx levels at these four sites the maritime stations of Finokalia and Kastelorizo can be considered as relatively unpol-luted to semi-polunpol-luted sites while the suburban/urban stations of Pallini (Athens) and
15
Thessaloniki are polluted sites. At Kastelorizo (Fig. 1a) no major signal of solar eclipse on surface O3, NO2 and NO concentrations can be deduced from the observations.
The only striking features are the two pollution plumes with peak concentrations of NOx (about 90 and 15 ppbv for NO2 and NO, respectively) and the subsequent lower concentrations of O3prior and just after the beginning of the solar eclipse. Similarly at 20
Finokalia (Fig. 1b) no drastic changes are seen on O3, NO2and NO concentrations due
to the solar eclipse. However, around the maximum of the solar eclipse when surface radiation was almost extinguished at the two relatively clean sites, a decline of ozone of about 9 ppbv is observed within a ten minutes time window that is simultaneously seen at the two sites and can be partially associated with solar eclipse effects. Since
25
ACPD
7, 11399–11428, 2007 Eclipse effects on surface atmospheric photooxidants P. Zanis et al. Title Page Abstract Introduction Conclusions References Tables Figures ◭ ◮ ◭ ◮ Back CloseFull Screen / Esc
Printer-friendly Version Interactive Discussion
EGU
air-quality modelling have been used in order to unravel the solar eclipse contribution. The solar eclipse effects on O3, NO2and NO concentrations are more clearly marked
on the measurements at Pallini station (Fig. 1c). O3 and NO concentrations show a
gradual decrease from the first contact until the maximum coverage, while during the second phase ozone gradually increases reaching its prior to the eclipse levels. An
5
opposite pattern is seen on the NO2 concentrations as the NO2 builds up during the
eclipse. The O3, NO2 and NO measurements at Thessaloniki show similar behaviour
with Pallini but with higher variability. The ozone decline at Thessaloniki during the eclipse is between 5 and 10 ppbv while NO values drop below the detection limit of the instrument during the maximum coverage of the solar disk. The differences in O3, NO2 10
and NO concentrations between their averaged values in the time window of maximum total solar obscuration (10:30–11:00 UTC) and their averaged values from both the time windows before and after the eclipse (09:30-10:00 UTC and 11:30–12:00 UTC) reveal O3decrease by –8 and –4 ppbv, NO decrease by –1 and –2 ppbv and NO2increase by 2, and 6 ppbv for Thessaloniki and Pallini, respectively (see Table 3).
15
The similar behaviour of O3, NO2 and NO concentrations at the two polluted sites,
Pallini and Thessaloniki, can be attributed to deviation from the photostationary state of O3, NO and NO2 during the eclipse, with NO2 formed from the reaction of O3 with
NO and not efficiently photolysed. The net effect is a decrease in O3 and NO while
NO2 is accumulated. Chemical box modelling and regional air-quality modelling have 20
been used to quantify the solar eclipse effect on photochemistry at these four Greek sites, the two relatively unpolluted and the two polluted while the observations have been used as model input or for model evaluation.
3.2 Box model results
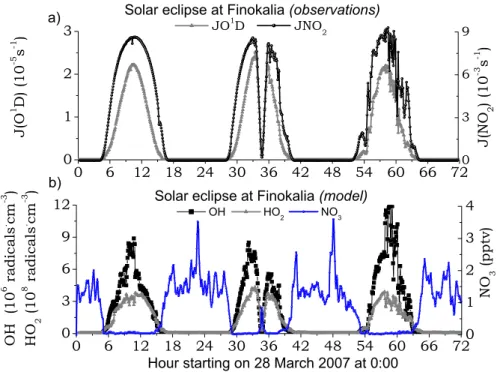
Driven by the observed JNO2 and JO 1
D variations during the eclipse period, the box
25
model simulates a sharp change from daytime to nighttime chemistry as depicted in Fig. 2a for Finokalia station (Fig. 2a). During the eclipse period hydroxyl (OH) and hy-drogen peroxy (HO2) radicals, mainly photochemically produced, show rapid decrease
ACPD
7, 11399–11428, 2007 Eclipse effects on surface atmospheric photooxidants P. Zanis et al. Title Page Abstract Introduction Conclusions References Tables Figures ◭ ◮ ◭ ◮ Back CloseFull Screen / Esc
Printer-friendly Version Interactive Discussion
EGU
by more than an order of magnitude to nighttime levels. Simultaneously nitrate (NO3) radical – mainly present during night – is increasing to the pptv level typical of nighttime conditions over the area (Vrekoussis et al., 2006, 2007). Similar conclusions are drawn for the other observational sites like Kastelorizo where NO3radicals reach 4 pptv during the eclipse maximum when OH and HO2radicals decrease by two orders of magnitude. 5
This drastic and sadden change from daytime to nighttime chemistry during the eclipse has also markedly affected the modelled O3budget changes simulated by the
chemical box model for Finokalia (location with 95.6% coverage). Indeed, comparing simulations both by considering and by neglecting the perturbation of photodissocia-tion rates due to the solar eclipse, it was calculated a mean decrease in the net ozone
10
production rate (NetPO3=PO3-QO3) of 0.86 ppbv/h when integrated over the eclipse period (09:30–12:00; Fig. 3b) with much higher rates up to 1.60 ppbv/h around the max-imum sun coverage. The O3production term (PO3) was calculated from the conversion
rate of NO to NO2by RO2radicals while the O3loss term (QO3) was derived from the rate of the O1D reaction with H2O and of O3reactions with HOx and with unsaturated 15
hydrocarbons. A higher change in NetPO3 of 1.36 ppbv/h was calculated by the box model for Kastelorizo (location with almost 100% coverage) averaged between the time window 09:30 and 12:00 UTC, and maximizes at about 2.9 ppbv/h during the maximum sun coverage. In parallel NO2increases due to the absence of NO2photodissociation as indicated by the observed almost zero JNO2values.
20
3.3 Regional air quality model results
As described in Sect. 2.3 CAMx calculated the diurnal variation of the photolysis rate JNO2for eclipse and no-eclipse conditions. An example for these calculations is shown
in Fig. 4. NO2photolysis rates (black curve) follow a sinusoidal curve increasing grad-ually after 04:00 UTC and returning to almost zero values after around 16:30 UTC.
25
When considering the eclipse in the calculations (magenta curve), the modelled NO2
photolysis rates gradually decrease after 09:30 UTC to minimize at around 11:00 UTC and one hour later return to the non-eclipse values. It should be noted the good level
ACPD
7, 11399–11428, 2007 Eclipse effects on surface atmospheric photooxidants P. Zanis et al. Title Page Abstract Introduction Conclusions References Tables Figures ◭ ◮ ◭ ◮ Back CloseFull Screen / Esc
Printer-friendly Version Interactive Discussion
EGU
of agreement at Finokalia between the modelled JNO2 values (Figu. 4a) and the ob-served JNO2values (Fig. 2a). The maximum of the observed JNO2 values is around
8.1×10⁻³s−1while the respective value calculated in CAMx is 7.6×10⁻³s−1. Further-more the appearance of clouds just after the eclipse introduced large variability in the observed JNO2and JO1D signals (Fig. 2a) while similarly the impact of clouds on
mod-5
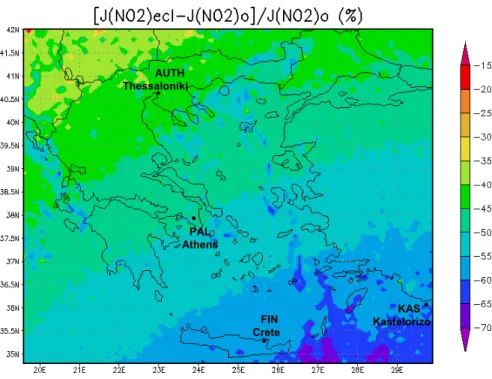
elled photolysis rates is also evident after 13:00 UTC at the site of Finokalia (Fig. 4a). Note that the relative reduction of photolysis rates is space dependent. To depict the impact of eclipse on JNO2 over the whole modelling region, the percentage of JNO2 relative decrease (JNO2ecl– JNO2o)/JNO2o was plotted over the master domain (here
subscript “o” denoting simulations without eclipse and “ecl” simulation with eclipse)
av-10
eraged for the time window 10:00–11:00 UTC (Fig. 5). A decrease in JNO2of 60–65% was calculated for Kastelorizo and 55–60% for Finokalia, 45–50% for Pallini (Athens) and 40–45% for the Thessaloniki.
The values of O3, NO2 and NO simulated by CAMx and averaged over the time window 09:30–12:00 UTC when the eclipse took place for the four different sites are
15
shown in Table 2. Comparing the simulations (Table 2) with the observations (Table 1) the following remarks can be made:
1. The simulated O3at Kastelorizo is significantly lower than the observations.
Sim-ilarly the simulated NOx levels are underestimated compared to the
observa-tions, possibly due to generally underestimated anthropogenic emissions over
20
Turkey, which lies only a few kilometers away from Kastelorizo and/or to the clean-atmosphere boundaries that was assumed for this run: Kastelorizo is the eastern-most Greek island close to the edges of our domain.
2. At Finokalia both the simulated O3and NOxvalues agree with the observations. 3. The modelled O3, NO2and NO values at Pallini and Thessaloniki compare rather 25
well with the respective observations.
ACPD
7, 11399–11428, 2007 Eclipse effects on surface atmospheric photooxidants P. Zanis et al. Title Page Abstract Introduction Conclusions References Tables Figures ◭ ◮ ◭ ◮ Back CloseFull Screen / Esc
Printer-friendly Version Interactive Discussion
EGU
by a few ppbv whereas both the observed and modelled NOx levels at Pallini are slightly higher than at Thessaloniki. This pattern is coherent with the non-linear behaviour in O3 production that associates an increase in NOx in these highly
polluted sites with a suppression of O3production.
The average differences of O3, NO2 and NO between eclipse and non-eclipse condi-5
tions in CAMx simulations over the time window of the eclipse (09:30–12:00 UTC) and for maximum coverage of the sun-disk for the four sites are indicated in Table 3. At the relatively unpolluted sites of Kastelorizo and Finokalia, the CAMx simulations indicate an ozone decrease of only –0.4 ppbv for Kastelorizo and –1.0 ppbv for Finokalia at the time of the maximum coverage of the sun-disk. These values are smaller than the
stan-10
dard deviation of the ozone measurements during the time window of the eclipse for both sites (see Table 1). Specifically the standard deviation of the ozone measurements for the time window 09:30–12:00 is 4.3 ppbv at Kastelorizo and 2.5 ppbv at Finokalia. If we also consider that the ozone instruments have a detection limit of about 1 ppbv then it is easily conceived why a clear evidence of the solar eclipse on O3 cannot be 15
supported for both Kastelorizo and Finokalia (Fig. 1). Similarly the CAMx simulations indicate only small changes for NO and NO2 for Kastelorizo and Finokalia during the solar eclipse. In particular, increases in NO2of 0.06 and 0.11 ppbv and decreases in
NO of 0.03 and 0.05 ppbv have been calculated at the time of the maximum cover-age of sun-disk for Kastelorizo and Finokalia, respectively. It should be further noted
20
from Table 3 that the differences from the observations of O3, NO2 and NO between
their averaged values in the time window of maximum total solar obscuration (10:30– 11:00 UTC) and their averaged values from both the time windows before and after the eclipse (09:30–10:00 UTC and 11:30–12:00 UTC) are generally not consistent with the CAMx calculations of the eclipse effects on these species. This inconsistency points to
25
the fact that at these relatively unpolluted sites the eclipse effects on the observations of O3, NO2and NO are masked.
Mind also that the changes in O3, NO2 and NO between eclipse and non-eclipse
ACPD
7, 11399–11428, 2007 Eclipse effects on surface atmospheric photooxidants P. Zanis et al. Title Page Abstract Introduction Conclusions References Tables Figures ◭ ◮ ◭ ◮ Back CloseFull Screen / Esc
Printer-friendly Version Interactive Discussion
EGU
though at Kastelorizo there was almost 100% sun coverage. This discrepancy can be attributed to the lower pollution levels at Kastelorizo in CAMx runs. Hence we anticipate that the CAMx simulations of the changes in O3, NO2and NO between eclipse and
non-eclipse conditions for Kastelorizo are underestimated because of the underestimation of O3and NOx levels in the CAMx results compared to observations (see Tables 1 and
5
2), earlier discussed.
At the polluted sites the CAMx simulations indicate an ozone decrease of 6.4 ppbv for Pallini and 10.6 ppbv for Thessaloniki at the time of the maximum coverage of the sun-disk. The CAMx simulated O3change between eclipse and non-eclipse conditions
integrated over the time window of the eclipse 09:30–12:00 UTC is –4.1 ppbv for Pallini
10
and –5.8 ppbv for Thessaloniki (see also Table 3). These simulated ozone decreases due to the solar eclipse are in good agreement with the in-situ ozone observations at the two polluted sites (see Table 3). For example, the difference in the observed O3 between the averaged value in the time window of maximum total solar obscura-tion (10:30–11:00 UTC) and the averaged values from both the time windows before
15
and after the eclipse (09:30–10:00 UTC and 11:30–12:00 UTC) is –8 and –4 ppbv for Thessaloniki and Pallini, respectively.
Furthermore, CAMx simulations indicate a decrease in NO of –2.55 ppbv and an increase in NO2 of 3.41 ppbv for Pallini over the time window of the eclipse 09:30–
12:00 UTC. The observations of NO and NO2at Pallini taking the difference between 20
the time window of the maximum coverage of the sun disk and the time windows before and after the completion of the solar eclipse indicate a NO decrease of –2.1 ppbv and NO2 increase of 5.6 ppbv. The CAMx simulations at Thessaloniki indicate a decrease
in NO of –0.19 ppbv and an increase in NO2of 3.44 ppbv over the time window of the eclipse 09:30–12:00 UTC whereas the observations indicate NO decrease of about
25
–1 ppbv and NO2 increase of about 2 ppbv. Hence the CAMx simulated values of the
differences of O3, NO2and NO between eclipse and non-eclipse conditions compare
reasonably well with observations for both Pallini and Thessaloniki.
ACPD
7, 11399–11428, 2007 Eclipse effects on surface atmospheric photooxidants P. Zanis et al. Title Page Abstract Introduction Conclusions References Tables Figures ◭ ◮ ◭ ◮ Back CloseFull Screen / Esc
Printer-friendly Version Interactive Discussion
EGU
shows the differences in NO2, NO and O3between eclipse and non-eclipse conditions
for the first model level Z1(<22 m) averaged over the time window 10:00–11:00 UTC. Over Greece the maximum impacts of the eclipse on O3, NO2and NO are calculated
to occur over the large urban agglomerations of Athens, and Thessaloniki where the maximum of the emissions occur. Furthermore, we note a stripe at the western Aegean
5
See with notable eclipse effects on these air pollutants which might be associated to ship emissions since ship trails coincide in space.
Comparing the net O3 production calculated by the box model and by the regional
air-quality model (see Table 4) there is agreement in the calculated NetPO3 and the
NetPO3 due to eclipse (∆NetPO3) when integrated over the eclipse window at Fi-10
nokalia. As explained the box model is evaluating the effect of eclipse on O3production
resulting from the photolysis rates changes alone. Thus it is calculating higher changes close to the maximum sun coverage than the regional model that, in addition, accounts for air masses mixing due to transport. However, at Kastelorizo the comparison be-tween box-model and CAMx calculations of NetPO3 and ∆NetPO3 is not satisfactory 15
with providing lower estimates in all cases (Table 4). The box model simulations that are forced to reproduce observed NOx levels indicate indeed larger impact of the eclipse on NetPO3at Kastelorizo than at Finokalia. As earlier discussed this underestimation
could be attributed to generally underestimated anthropogenic emissions over Turkey and/or to clean-atmosphere boundaries conditions assumed for the CAMx run at the
20
edge of our domain where the Kastelorizo is located.
4 Summary and conclusions
The present work investigated the chemical effects of the solar eclipse of 29 March 2006 on surface air quality levels over Greece based on observations at a number of sites in conjunction with chemical box modelling and 3-D air-quality modelling.
Em-25
phasis has been given on surface ozone and other photooxidants at four Greek sites Kastelorizo, Finokalia (Crete), Pallini (Athens) and Thessaloniki, which are located at
ACPD
7, 11399–11428, 2007 Eclipse effects on surface atmospheric photooxidants P. Zanis et al. Title Page Abstract Introduction Conclusions References Tables Figures ◭ ◮ ◭ ◮ Back CloseFull Screen / Esc
Printer-friendly Version Interactive Discussion
EGU
gradually increasing distances from the eclipse path and are characterized by differ-ent air pollution levels. The differdiffer-ent solar obscuration at each site combined with a variety of environments, by means of air quality level, namely polluted urban/suburban (Thessaloniki, Pallini), and relatively unpolluted coastal (Finokalia, Kastelorizo) enabled a thorough investigation of the response of photochemistry to an abrupt photolytical
5
change.
At the relatively unpolluted sites of Kastelorizo and Finokalia no clear impact of so-lar eclipse on surface O3, NO2 and NO concentrations can be deduced from the ob-servations and model simulations. The obob-servations corroborate with chemical box modelling and 3-D air-quality modelling. O3 at Finokalia has been associated with 10
a mean decrease in the net ozone production rate of 0.86 ppbv/h (box model) and 0.60 ppbv/h (CAMx) when integrated over the eclipse period (09:30–12:00 UTC). Sim-ilarly, at Kastelorizo (location with almost 100% coverage) O3 has been associated
with a mean decrease in the net ozone production rate of 1.36 ppbv/h (box model) and 0.16 ppbv/h (CAMx). Such changes in the net ozone production between eclipse and
15
non eclipse conditions, as calculated by both box and 3-D air quality models, are rather small compared to the ozone variability and hence the solar eclipse effects on ozone can be easily masked by transport.
Box model calculations also demonstrated the rapid decrease of the photochemically produced OH and HO2radicals by more than an order of magnitude to nighttime levels
20
at Finokalia during the eclipse period. Simultaneously the NO3radical concentration,
the main nighttime oxidant species, increased to the pptv level, which is typical for nighttime conditions over the area.
At the polluted urban and suburban sites of Thessaloniki and Pallini, respectively, solar eclipse effects on O3, NO2 and NO concentrations are clearly indicated from 25
both the measurements and 3-D air-quality modelling. The net effect is a decrease in O3 and NO while NO2 is accumulated. The common behaviour of O3, NO2 and
NO concentrations at the two polluted sites, Pallini and Thessaloniki, can be attributed to their perturbation from the photostationary state of O3, NO and NO2 during the
ACPD
7, 11399–11428, 2007 Eclipse effects on surface atmospheric photooxidants P. Zanis et al. Title Page Abstract Introduction Conclusions References Tables Figures ◭ ◮ ◭ ◮ Back CloseFull Screen / Esc
Printer-friendly Version Interactive Discussion
EGU
eclipse, with NO2formed from the reaction of O3with NO while at the same time NO2 is not efficiently photolysed. The 3-D air quality modelling over Greece simulates the maximum effects of the eclipse on O3, NO2and NO at the large urban agglomerations
of Athens, and Thessaloniki where the maximum of the emissions occur.
The net O3 production (NetPO3) and the impact of changing photolysis rates on it 5
(∆NetPO3) calculated by the box model and by the regional air-quality model agree
reasonably well when integrated over the eclipse window at Finokalia but is underesti-mated by CAMx for Kastelorizo. This underestimation is linked to an underestimation of CAMx O3, and NOx levels which could be in turn due to generally underestimated
an-thropogenic emissions over Turkey and/or the fact that Kastelorizo is close to the edge
10
of our domain with clean-atmosphere boundaries conditions assumed for the CAMx run.
Acknowledgements. Compilation and presentation of this work has been facilitated by the AC-CENT – EU network of excellence. Support by a research and education PYTHAGORAS II grant co-funded by the Greek Ministry of Education (25%) and the European Social Fund
15
(75%) is acknowledged. The air quality and meteorological data of Pallini, Athens were kindly provided by the Air Quality Monitoring Network of Athens International Airport (AIA) Eleftherios Venizelos.
References
CAMx User’s Guide, Version 4.30, ENVIRON International Corporation, February 2006,http: 20
//www.camx.com, 2006.
Curtis, A. R. and Sweetenham, W. P.: FACSIMILE/CHEKMAT User’s Manual AERE R-12805, United Kingdom Atomic Energy Authority (UKAEA), Harwell, 1988.
Gerasopoulos, E., Kouvarakis, G., Vrekoussis, M., Kanakidou, M., and Mihalopoulos, N.: Ozone variability in the marine boundary layer of the eastern Mediterranean based on 7-year
25
observations, J. Geophys. Res., 110(D15), D15309, doi:10.1029/2005JD005991, 2005. Gerasopoulos, E., Kouvarakis, G., Vrekoussis, M., Donoussis, C., Mihalopoulos, M., and
ACPD
7, 11399–11428, 2007 Eclipse effects on surface atmospheric photooxidants P. Zanis et al. Title Page Abstract Introduction Conclusions References Tables Figures ◭ ◮ ◭ ◮ Back CloseFull Screen / Esc
Printer-friendly Version Interactive Discussion
EGU Kanakidou, M.: Photochemical ozone production in the Eastern Mediterranean, Atmos.
En-viron., 40(17), 3057–3069, 2006.
Fabian, P., Rappenglueck, B., Stohl, A., Werner, H., Winterhalter, M., Schlager, H., Stock, P., Berresheim, H., Kaminski, U., Koepke, P., Reuder, J., and Birmili, W.: Boundary layer photochemistry during a total solar eclipse, Meteorologische Zeitschrift, 10(3), 187–192,
5
2001.
Founda, D., Melas, D., Lykoudis, S., Lisaridis, I., Gerasopoulos, E., Kouvarakis, G., Petrakis, M., and Zerefos, C.: The effect of the total solar eclipse of March 29, 2006 on meteorological variables in Greece, Atmos. Chem. Phys. Discuss., 7, 10 631–10 667, 2007.
Poupkou, A., Symeonidis, P., Lisaridis, I., Pouspourika, E., Yay, O.D., Melas, D., Ziomas, I.,
10
Balis, D., and Zerefos, C.: Compilation of an emission inventory for the purpose of studying the regional photochemical pollution in the Balkan Region, Proceedings of the Quadrennial Ozone Symposium 2004, Kos, Greece, 902–903, 2004.
Madronich, S.: UV radiation in the natural and perturbed atmosphere, in: Environmental Effects of UV (Ultraviolet) Radiation, edited by: Tevini, M., Lewis Publisher, Boca Raton, 17–69,
15
1993.
Mavrakis, A., Theoharatos, G., and Lykoudis, S.: Ultraviolet radiation and surface ozone vari-ations during the solar eclipse of 11 Aug. 1999, over Attica, Greece, Proceeding of the XX Quadrennial Ozone Symposium, Vol. II, Session 6, 1126–1127, 2004.
Mihalopoulos, N., Stephanou, E., Kanakidou, M., Pilitsidis, S., and Bousquet, P.: Tropospheric
20
aerosol ionic composition above the Eastern Mediterranean Area, Tellus, 49B, 314–326, 1997.
Sciare J., Kanakidou M., and Mihalopoulos, N.: Diurnal and seasonal variation of atmospheric dimethyl sulfoxide (DMSO) at Amsterdam island in the southern indian ocean, J. Geophys. Res., 105, 17 257–17 265, 2000.
25
Srivastava, G. P., Pakkir, M. P. M., and Balwalli, R. R.: Ozone concentration measurements near the ground at Raichur during the solar eclipse of 1980. Proceedings of Indian Natural Sciences Academy, A48(3), 138–142, 1982.
Tsigaridis, K. and Kanakidou, M.: Importance of Volatile Organic Compounds Photochemistry Over a Forested Area in Central Greece, Atmos. Environ., 36(19), 3137–3146, 2002.
30
Vrekoussis, M., Kanakidou, M., Mihalopoulos, N., Crutzen, P. J., Lelieveld, J., Perner, D., Berresheim, H., and Baboukas, E.: Role of the NO3 radicals in oxidation processes in the eastern Mediterranean troposphere during the MINOS campaign, Atmos. Chem. Phys., 4,
ACPD
7, 11399–11428, 2007 Eclipse effects on surface atmospheric photooxidants P. Zanis et al. Title Page Abstract Introduction Conclusions References Tables Figures ◭ ◮ ◭ ◮ Back CloseFull Screen / Esc
Printer-friendly Version Interactive Discussion
EGU 169–182, 2004,
http://www.atmos-chem-phys.net/4/169/2004/.
Vrekoussis, M., Liakakou, E., Mihalopoulos, N., Kanakidou, M., Crutzen, P. J., and Lelieveld, J.: Formation of HNO3and NO−3in the anthropogenically-influenced eastern Mediterranean ma-rine boundary layer, Geophys. Res. Lett., 33, L05811, doi:10.1029/2005GL025069, 2006.
5
Vrekoussis, M., Mihalopoulos, N., Gerasopoulos, E., Kanakidou, M., Crutzen, P. J., and Lelieveld, J.: Two-years of NO3 radical observations in the boundary layer over the East-ern Mediterranean, Atmos. Chem. Phys., 7, 315–327, 2007
Zanis, P., Zerefos, C. S., Gilge, S., Melas, D., Balis, D., Ziomas, I., Gerasopoulos, E., Tzoumaka, P., Kaminski, U., and Fricke, W.: Comparison of measured and modelled surface ozone
10
concentrations at two different sites in Europe during the solar eclipse on August 11, 1999, Atmos. Environ., 35, 4663–4673, 2001.
Zerefos, C. S., Balis, D. S., Zanis, P., Meleti, C., Bais, A. F. Tourpali,, K., Melas, D., Ziomas, I., Galani, E., Kourtidis, K., Papayannis, A., and Gogosheva, Z.: Changes in surface UV solar irradiance and ozone over the Balkans during the eclipse of August 11, 1999, Adv. Space
15
Res., 27(12), 1955–1963, 2001.
Zerefos, C. S, Balis, D. S., Meleti, C., Bais, A. F., Tourpali, K., Vanicek, K., Cappelani, F., Kaminski, U., Tiziano, C., Stubi, R., Formenti, P., and Andreae, A.: Changes in environmental parameters during the solar eclipse of August 11, 1999, over Europe. Effects on surface UV solar irradiance and total ozone, J. Geophys. Res., 105(D21), 26 463–26 473, 2000.
ACPD
7, 11399–11428, 2007 Eclipse effects on surface atmospheric photooxidants P. Zanis et al. Title Page Abstract Introduction Conclusions References Tables Figures ◭ ◮ ◭ ◮ Back CloseFull Screen / Esc
Printer-friendly Version Interactive Discussion
EGU
Table 1. Observations of O3, NO2 and NO averaged over the time window 09:30–12:00 UTC when the eclipse took place for the sites Kastelorizo, Finokalia, Pallini and Thessaloniki. The standard deviation is given in parenthesis.
O3(ppbv) NO2(ppbv) NO (ppbv) Kastelorizo 68.6 (±4.3 ) 1.57 (±1.40) 0.39 (±0.28) Finokalia 42.7 (±2.5) 0.34 (±0.13) 0.07 (±0.02) Pallini, Athens 36.9 (±3.6) 15.59 (±3.42) 4.83 (±1.13) Thessaloniki 43.5 (±4.3) 12.11 (±2.69) 1.89 (±1.16)
ACPD
7, 11399–11428, 2007 Eclipse effects on surface atmospheric photooxidants P. Zanis et al. Title Page Abstract Introduction Conclusions References Tables Figures ◭ ◮ ◭ ◮ Back CloseFull Screen / Esc
Printer-friendly Version Interactive Discussion
EGU
Table 2. Simulations of O3, NO2 and NO by CAMx averaged over the time window 09:30– 12:00 UTC when the eclipse took place for the sites Kastelorizo, Finokalia, Pallini and Thessa-loniki. The standard deviation is given in parenthesis.
O3(ppbv) NO2(ppbv) NO (ppbv) Kastelorizo 51.7 (±0.6) 0.17 (±0.01) 0.02 (±0.01) Finokalia 43.5 (±0.6) 0.30 (±0.04) 0.05 (±0.02) Pallini, Athens 34.8 (±6.4) 19.03 (±7.30) 6.21 (±4.28 ) Thessaloniki 42.48 (±3.4) 11.75 (±2.80) 3.22 (±0.50)
ACPD
7, 11399–11428, 2007 Eclipse effects on surface atmospheric photooxidants P. Zanis et al. Title Page Abstract Introduction Conclusions References Tables Figures ◭ ◮ ◭ ◮ Back CloseFull Screen / Esc
Printer-friendly Version Interactive Discussion
EGU
Table 3. Differences of O3, NO2and NO between eclipse and non-eclipse conditions in CAMx simulations over the time window of the eclipse 09:30–12:00 UTC for the sites Kastelorizo, Finokalia, Pallini and Thessaloniki. The values in parentheses correspond to the respective values of differences for the maximum sun coverage. The differences from the observations of O3, NO2and NO between their averaged values in the time window of maximum total solar ob-scuration 10:30–11:00 UTC and their averaged values from both the time windows before and after the eclipse (09:30–10:00 UTC and 11:30–12:00 UTC) are also provided for comparison.
∆O3(ppbv) Model Obs ∆NO2(ppbv) Model Obs ∆NO (ppbv) Model Obs Kastelorizo –0.3 (–0.4) 0.8 0.03 (0.06) –0.35 –0.01 (–0.03) –0.06 Finokalia –0.7 (–1.0) 2.3 0.06 (0.11) –0.07 –0.02 (–0.05) 0.00 Pallini, Athens –4.1 (–6.4) –4.0 3.41 (5.75) 5.56 –2.35 (–4.99) –2.10 Thessaloniki –5.8 (–10.6) –8.4 3.44 (7.3) 1.84 –0.19 (–1.25) –0.93
ACPD
7, 11399–11428, 2007 Eclipse effects on surface atmospheric photooxidants P. Zanis et al. Title Page Abstract Introduction Conclusions References Tables Figures ◭ ◮ ◭ ◮ Back CloseFull Screen / Esc
Printer-friendly Version Interactive Discussion
EGU
Table 4. Net O3chemical production (NetPO3=PO3-QO3) at the four studied stites for eclipse and non-eclipse conditions over the time window of eclipse 09:30–12:00 UTC in CAMx and Box Model as well as their difference ∆NetPO3between eclipse and non-eclipse conditions.
NetPO3eclipse (ppbv/h) NetPO3 non-eclipse (ppbv/h) ∆NetPO3 (ppbv/h) Kastelorizo CAMx 0.17 0.33 –0.16 Box Model 1.10 2.46 –1.36 Finokalia CAMx 0.72 1.32 –0.60 Box Model 0.55 1.41 –0.86
ACPD
7, 11399–11428, 2007 Eclipse effects on surface atmospheric photooxidants P. Zanis et al. Title Page Abstract Introduction Conclusions References Tables Figures ◭ ◮ ◭ ◮ Back CloseFull Screen / Esc
Printer-friendly Version Interactive Discussion EGU 08:300 09:00 09:30 10:00 10:30 11:00 11:30 12:00 12:30 25 50 75 100 08:30 09:00 09:30 10:00 10:30 11:00 11:30 12:00 12:30 0 25 50 75 100 08:30 09:00 09:30 10:00 10:30 11:00 11:30 12:00 12:30 0 25 50 75 100 08:300 09:00 09:30 10:00 10:30 11:00 11:30 12:00 12:30 25 50 75 100 Pallini 0 12 24 36 48 Finokalia 0.0 0.2 0.4 0.6 0.8 Thessaloniki 0 12 24 36 48 c) d) b) a) O3 GRx10 N O , N O 2 ( p p b v) Kasteloriso O3 ( p p b v) , G R x 1 0 ( Wm -2 ) 0.0 2.5 5.0 7.5 10.0 NO NO2
Fig. 1. Time series of O3, NO, NO2 and global radiation at Kastelorizo, Finokalia, Pallini and Thessaloniki during the eclipse day of 29 March 2006 from 08:38 to 12:28. Time is expressed in UTC.
ACPD
7, 11399–11428, 2007 Eclipse effects on surface atmospheric photooxidants P. Zanis et al. Title Page Abstract Introduction Conclusions References Tables Figures ◭ ◮ ◭ ◮ Back CloseFull Screen / Esc
Printer-friendly Version Interactive Discussion EGU 0 6 12 18 24 30 36 42 48 54 60 66 72 0 1 2 3 0 6 12 18 24 30 36 42 48 54 60 66 72 0 3 6 9 12 b)
a) Solar eclipse at Finokalia (observations)
Hour starting on 28 March 2007 at 0:00
J (N O 2 ) (1 0 -3 s -1 ) J (O 1 D ) (1 0 -5 s -1 ) JO1D 0 3 6 9 JNO2
Solar eclipse at Finokalia (model)
N O 3 ( p p tv) O H (1 0 6 r a d ica ls . cm -3 ) H O 2 ( 1 0 8 r a d ica ls . cm -3 ) OH HO2 0 1 2 3 4 NO3
Fig. 2. (a) Measured photolysis rates of NO2(JNO2) and O3(JO1D) at Finokalia over a 3 days period around the eclipse of the 29 March 2006. (b) hydroxyl (OH), hydrogen peroxy (HO2) and nitrate (NO3) radical levels simulated by the chemical box model for Finokalia during these 3 days. Time is expressed in UTC.
ACPD
7, 11399–11428, 2007 Eclipse effects on surface atmospheric photooxidants P. Zanis et al. Title Page Abstract Introduction Conclusions References Tables Figures ◭ ◮ ◭ ◮ Back CloseFull Screen / Esc
Printer-friendly Version Interactive Discussion EGU 0 6 12 18 24 0 1 2 3 24 30 36 42 48 0 3 6 9 12 0 6 12 18 24 b)
a) Eclipse at Finokalia 29th of March
P O3 Q O3 ( p p b v . h -1 ) PO3 - QO3 (eclipse) PO3 - QO3 (no eclipse) N O 3 ( p p tv) O H (1 0 6 r a d ica ls . cm -3 ) H O 2 ( 1 0 8 r a d ica ls . cm -3 ) OH_base_run HO2_base_run OH_day_before HO2_day_before 0 1 2 3 4 NO3_base_run NO3_day_before
Fig. 3. (a) Net O3 chemical production (NetPO3=PO3-QO3) at Finokalia during the day of the eclipse, 29 March 2006, simulated by considering the effect of eclipse of photolysis rates (NetPO3 base-run) and by neglecting it (NetPO3 jdaybefore) (b) as (a) but for OH, HO2 and NO3radical levels. Time is expressed in UTC. NetPO3= PO3–QO3, where PO3=ΣRRO2NONO, QO3=O1D+ H2O, alkenes + O3.
ACPD
7, 11399–11428, 2007 Eclipse effects on surface atmospheric photooxidants P. Zanis et al. Title Page Abstract Introduction Conclusions References Tables Figures ◭ ◮ ◭ ◮ Back CloseFull Screen / Esc
Printer-friendly Version Interactive Discussion EGU 0 2 4 6 8 10 12 14 16 18 20 22 24 0.0 2.5x10⁻³ 5.0x10⁻³ 7.5x10⁻³ 1.0x10⁻² 0 2 4 6 8 10 12 14 16 18 20 22 24 0.0 2.5x10⁻³ 5.0x10⁻³ 7.5x10⁻³ 1.0x10⁻² 0 2 4 6 8 10 12 14 16 18 20 22 24 0.0 2.5x10⁻³ 5.0x10⁻³ 7.5x10⁻³ 1.0x10⁻² 0 2 4 6 8 10 12 14 16 18 20 22 24 0.0 2.5x10⁻³ 5.0x10⁻³ 7.5x10⁻³ 1.0x10⁻² d) c) b) a) Thessaloniki Pallini Finokalia
J
N
O
2(
s
-1)
With eclipse No eclipse
Kastelorizo
Time (UTC)
Fig. 4. Diurnal variation of the photolysis rate constant J(NO2) values calculated in CAMx simu-lations for eclipse and non-eclipse conditions at Kastelorizo, Finokalia, Pallini and Thessaloniki.
ACPD
7, 11399–11428, 2007 Eclipse effects on surface atmospheric photooxidants P. Zanis et al. Title Page Abstract Introduction Conclusions References Tables Figures ◭ ◮ ◭ ◮ Back CloseFull Screen / Esc
Printer-friendly Version Interactive Discussion EGU KAS Kastelorizo PAL Athens AUTH Thessaloniki FIN Crete KAS Kastelorizo PAL Athens AUTH Thessaloniki FIN Crete
Fig. 5. Percentage decrease of NO2 photolysis rates averaged for the time window 10:00– 11:00 UTC over the master modeling domain. The four dots show the four observational sites.
ACPD
7, 11399–11428, 2007 Eclipse effects on surface atmospheric photooxidants P. Zanis et al. Title Page Abstract Introduction Conclusions References Tables Figures ◭ ◮ ◭ ◮ Back CloseFull Screen / Esc
Printer-friendly Version Interactive Discussion
EGU
Fig. 6. Differences of (a) NO2, (b) NO and (c) O3between eclipse and non-eclipse conditions in CAMx simulations over the master modeling domain for the first model level Z1 (<22 m) averaged for the time window 10:00–11:00 UTC.