HAL Id: hal-02183774
https://hal.archives-ouvertes.fr/hal-02183774
Submitted on 22 Oct 2019HAL is a multi-disciplinary open access
archive for the deposit and dissemination of sci-entific research documents, whether they are pub-lished or not. The documents may come from teaching and research institutions in France or abroad, or from public or private research centers.
L’archive ouverte pluridisciplinaire HAL, est destinée au dépôt et à la diffusion de documents scientifiques de niveau recherche, publiés ou non, émanant des établissements d’enseignement et de recherche français ou étrangers, des laboratoires publics ou privés.
Glycerol dehydration to hydroxyacetone in gas phase
over copper supported on magnesium oxide (hydroxide)
fluoride catalysts
Stephane Celerier, Sophie Morisset, Isabelle Batonneau-Gener, Thomas Belin,
Khaled Younes, Catherine Batiot-Dupeyrat
To cite this version:
Stephane Celerier, Sophie Morisset, Isabelle Batonneau-Gener, Thomas Belin, Khaled Younes, et al.. Glycerol dehydration to hydroxyacetone in gas phase over copper supported on magnesium ox-ide (hydroxox-ide) fluorox-ide catalysts. Applied Catalysis A : General, Elsevier, 2018, 557, pp.135-144. �10.1016/j.apcata.2018.03.022�. �hal-02183774�
Glycerol dehydration to hydroxyacetone in gas phase over copper supported on
magnesium oxide (hydroxide) fluoride catalysts
Stéphane Célerier, Sophie Morisset, Isabelle Batonneau-Gener, Thomas Belin, Khaled Younes and Catherine Batiot-Dupeyrat*
IC2MP, UMR CNRS 7285, ENSIP, Université de Poitiers, 1 rue Marcel Doré, 86022 Poitiers,
*Corresponding author: catherine.batiot.dupeyrat@univ-poitiers.fr, Phone: +33549453898,
Abstract:
The dehydration of glycerol to hydroxyacetone was studied over copper-based catalysts using
magnesium oxide (hydroxide) fluoride with various F/Mg ratio as support of copper. After
calcination at 350°C, the incorporation of copper, mainly at + II oxidation state, into the
support lattice was observed for MgO and MgF(OH) while, copper was stabilized as Cu+1 at
the surface of Cu-MgF2. The reaction of dehydration was performed using a mixture of
glycerol and water (80%wt of glycerol), in gas phase at 260°C. Cu-MgF2 was the most active
catalyst with a yield in hydroxyacetone of 45.5%, while the catalytic activity was very low for
Cu-MgF(OH) and Cu-MgO (yield in HA <10%). Moreover, the performances obtained for
Cu-MgF2 were higher than those obtained with La2CuO4, a reference catalyst. After four
hours of reaction, Cu-MgF2 was not significantly modified, while for the two other catalysts,
Cu2+ initially present was reduced into metallic copper. The results obtained revealed that the
basic properties of the catalysts did not govern the reaction of dehydration of glycerol into
HA. The best catalyst (Cu-MgF2) was the one possessing the higher amount of Lewis acid
Introduction
Glycerol, the main byproduct obtained from biodiesel industry, is a very promising
platform building blocks for fuels and chemicals production [1]. Many applications of
glycerol valorization were reported in the literature, such as hydrogenolysis of glycerol to
propanediols [2-4], dehydration to acrolein [5-8] and reforming to hydrogen or syngas [9].
Glycerol conversion into acrolein was successfully performed over solid acid catalysts such as
heteropoly acids [10] or zeolites [11]. The formation of acrolein is often accompanied by the
presence of hydroxyacetone.
Hydroxyacetone (HA) is an interesting chemical product used as flavour in food industry,
dyes or additive in cosmetics. It is also an intermediate in the production of valuable
compounds such as propyleneglycol, acrolein or propionaldehyde. Therefore there are needs
to develop active catalysts to produce selectively HA under mild experimental conditions, in a
fixed bed continuous flow process at atmospheric pressure. Indeed, heterogeneous catalytic
processes allow to avoid commonly encountered drawbacks of homogeneous catalytic
processes including the difficulty of catalysts separation and problems of waste disposal.
Hydroxyacetone can be obtained from glycerol dehydration in gas phase, over catalysts
containing Lewis acid sites such as MOx-Al2O3-PO4 [12] or Zn-Cr oxides [13] or catalysts
containing basic sites such as NiCo2O4 [14] while over strong Bronsted acid sites the
formation of acrolein is favoured [15]. High selectivity to HA was also achieved using the
5%Na doped CeO2 basic catalyst at 350°C, but a poor stability was observed with a rapid
deactivation with time on stream[16].
Copper-based catalysts were widely used to perform the hydrogenolysis of glycerol to
propanediols due to their lower price and higher resistance to poisoning than noble metals
[17]. Copper was also preferred to nickel or cobalt due to its lower activity for C-C bond
the hydrogenolysis of glycerol in aqueous solution, under hydrogen pressure. The high
activity was attributed to the strong basicity of the catalyst [18]. For the hydrogenolysis of
glycerol, copper is used in its reduced form (Cu°) in order to favour the hydrogenation step
which follows the dehydration one at the surface of the oxide support. Moreover it is also
proposed that the Cu metallic site is involved in the dehydrogenation of glycerol to
glyceraldehyde, followed by its dehydration and subsequent hydrogenation to HA[1]. Copper
based catalysts were also successfully used without reduction for low temperature glycerol
conversion to lactic acid in liquid phase under alkaline conditions[19]. The main drawbacks
of the reaction performed in liquid phase are the use of relatively high temperatures and
pressures requiring expensive equipments.
In the past decade, metal fluorides and oxide (hydroxide) fluorides prepared by soft
chemistry, exhibiting tunable acid-base properties and high specific surface area, have shown
promising results in different heterogeneous catalytic processes as active phase or support
[20,21]. More specifically, magnesium fluoride was used successfully as support for
numerous reactions such as CO oxidation [22], DeNOx [23] synthesis of menthol [24],
alkylation of thiophenic compounds [25], synthesis of furfural [26], hydrogenation [27]
among others, due to its high thermal and chemical stability. MgF2 is considered as an inert
support [28] or as an active support with high density of acid sites with moderate strength [29,
30], depending on the specific surface area and thus, on the synthesis process. Magnesium
oxide (hydroxide) fluorides MgF2-xOx/2 (or MgF2-x(OH)x) or, more specifically, the intimate
mixture with controlled composition of MgO and MgF2, formed after calcination above
400°C, were also successfully used as support in several applications [31, 32]. The synthesis
and characterization of this new Mg–O–F system and its application as catalytic support were
described [33-35]. As an example, MgF2–MgO can be considered as a potential support of NiO in NOx reduction by propene [33]. The synthesis of the MgF2–MgO mesoporous
material, particularly by sol-gel method [31,36], allows to increase the specific surface area
compared to single MgF2, MgO or Mg(OH)2 whatever the temperature of calcination [36].
For example, a specific surface area of 644 m2.g-1 can be obtained for MgF(OH) before
calcination whereas the specific surface area of MgF2 is of 231 m2.g-1 in the same synthesis
conditions. The higher specific surface area favors the high dispersion of the active phase at
the surface of the support, leading to high activity in several applications [31-34]. Moreover,
the easy control of the F/Mg ratio, by sol-gel process, allows to fine tune the acid-base
properties. Indeed, higher the fluorine content, higher the strength of Lewis acidity and lower
the amount and strength of basicity [37]. This is obviously due to the stronger inductive effect
of fluorine atom in comparison with oxygen atom. The interest of such materials was already
demonstrated for Michael addition reactions [38]. Among the different soft chemistry method
used to synthesize metal fluorides, the sol-gel method is very promising because it is simple,
flexible and cheap, offering an easy control of porosity and microstructural properties [20].
In this work, the selective production of HA from glycerol in gas phase using magnesium
oxide (hydroxide) fluoride as support of copper catalyst is reported. To the best of our
knowledge, there is no report on the use of such materials for glycerol conversion. A mixture
of glycerol and water (80wt % glycerol) was used while the reaction temperature was fixed at
260°C. For comparison, a La2CuO4 catalyst was also evaluated as a reference catalyst, since
we showed in a previous study that a high catalytic activity can be reached using pure
glycerol (99.9%) [39]. A correlation between the properties of the materials (acid-base,
Experimental
Catalyst synthesis
The oxide (hydroxide) fluoride materials used in this work were prepared by a sol-gel
method, partly based on the work of Scholz et al. [36]. In a first step, magnesium metal
(3.23g, Aldrich, 99,98%) was treated with methanol in excess (100 mL, Sigma-Aldrich,
99,8%) under reflux conditions for 6 h to form a Mg(OCH3)2 metal alkoxide solution. For
MgF2 support, stoichiometric amount of aqueous HF (11.074 g, 48 wt% HF in water) was
added progressively to the solution under stirring (avoiding the formation of a gel). A highly
exothermic reaction proceeds leading to the formation of a sol. This sol was stirred for 24 h,
aged at ambient temperature for 24 h, and dried at 100°C for 24 h, leading to the formation of
the powder named MgF2. For the support named MgF(OH), the protocol was the same except
the added amount of HF, which was adjusted to obtain an initial F/Mg ratio of 1. Additional
water was used for the hydrolysis of remaining -OCH3 groups, to form hydroxyl group
(hydrolysis reaction). For the support named MgO, no HF was added and the hydrolysis
reaction was carried out with an excess of water (6 g, H2O/Mg = 2.5). After drying at 100°C,
the materials were calcined at 350°C for 5 h under dry air.
For the impregnation of copper on the support, 2 g of powder were mixed with a copper
acetate solution: 330.5 mg of (CH3COO)2Cu.1H2O (Aldrich, 98%) dissolved in 17 mL of
water. The amount of copper precursor was adjusted to obtain a theoretical weight content of
metallic copper of 5 %. This mixture was stirred for 24 h, at ambient temperature and dried at
100°C on a sand bath followed by a final drying in a furnace at 80°C for 12 h. The catalysts
were then calcined at 350°C, for 5 hours, under dry air to form copper oxide, the materials are
named Cu-MgO, Cu-MgF(OH) and Cu-MgF2.
In order to compare the performances of these new catalysts with a reference catalyst,
Characterization
XRD analysis of samples were carried out with a PANalytical EMPYREAN powder
diffractometer using CuK radiation source (K1 = 1.5406 Å and K2 = 1.5444 Å). XRD
patterns were collected between 15 and 80° with a 0.033° step and 300 s dwell time at each
step. The identification of the phases was performed with the HighScorePlus software
(PANalytical©) and by comparison with the ICDD database reference files.
Nitrogen adsorption was performed at -196°C using a TRISTAR 3000 gas adsorption system.
Prior N2 adsorption, the powder samples were degassed under secondary vacuum for 12 h at
250°C. The BET equation was used to calculate the surface area of the samples (SBET in m2.g -1
). The total pore volume was calculated from the adsorbed volume of nitrogen at P/P0 equal
to 0.99. The average mesopore-size distribution was calculated from the desorption isotherm
branch using the Barret-Joyner-Halenda (BJH) method.
The magnesium and copper contents of the samples were determined by Inductively Coupled
Plasma-Optical Emission Spectrometry (ICP OES) using a PerkinElmer Optima 2000DV
instrument.
The amount of carbon deposition, after the catalytic test, was calculated by
Thermogravimetric analysis (TGA) using a Q600TA Instrument apparatus, under dry air, with
a heating rate of 5 °C min-1 from room temperature to 900°C.
The acidity of solid materials was measured by adsorption of pyridine followed by FT-IR
spectroscopy, using a ThermoNicolet NEXUS 5700 spectrometer with a resolution of 2 cm-1
and 128 scans per spectrum. The samples were pressed into thin pellets (10-30 mg) with
diameter of 16 mm under a pressure of 1-2 t.cm-2 and activated in situ during one night under
vacuum (10-5 Pa) at 250°C. Pyridine was introduced in excess, at 150°C, after the activation
period. The solid sample was vacuum-packed to eliminate physisorbed pyridine and IR
the integrated area band located between 1445 and 1455 cm-1, using 1.28 cm.mol-1 as molar extinction coefficient. Note that no Bronsted acid site was detected by this method on all
samples (no band observed between 1540 and 1550 cm-1).
Temperature programmed reduction analysis (TPR) were carried out in a Micromeritics
Autochem 2910 equipment using 100 mg of catalyst. The experiments were performed using
a 5 % H2/Ar mixture, with a flow rate of 100mL.min-1, while the temperature was raised at
5 °C min-1 from ambient to 900 °C, then maintained at this temperature for 30 min. Prior to
the measurements, the samples were outgassed under helium at 350 °C for 8 h.
CO2 adsorption experiments were performed to determine the basic properties of the catalysts.
Adsorption equilibrium data were measured thermogravimetrically at 298 K using a
symmetrical SETARAM microbalance. A weight of 10 to 15 mg of sample was outgassed
under secondary vacuum at 573 K for 6 hours and then cooled down to 298 K prior to the
sorption measurements. The temperature of the system is kept constant during analysis by a
water circulation in the double wall of the analysis tube. The CO2 pressure was then increased
step by step in order to obtain the entire adsorption isotherm. For each uptake, the equilibrium
was reached when the mass recorded versus time and the pressure were stable.
The XPS analysis were carried out with a Kratos Axis Ultra DLD spectrometer using a
monochromatic Al Kα source (10mA, 15kV). The charge Neutraliser system was operated for
all analysis. Instrument base pressure was 9 x 10⁻⁸ Pascal. High-resolution spectra were
recorded using an analysis area of 300 µm x 700 µm and a 40 eV pass energy. These pass
energies correspond to Ag 3d5/2 FWHM of 0.55 eV. Data were acquired with 0.1 eV steps.
All the binding energies were calibrated with the Mg2p binding energy fixed at 50.7eV as an
Catalytic activity
The reaction was performed using a mixture of glycerol and water (80%wt of glycerol)
with a liquid flow rate of 0.04 mL.min-1. The reactor was a quartz tube of 13mm i.d. and
400mm length. The catalytic decomposition of glycerol was carried out at atmospheric
pressure by passing a continuous flow of 20% v/v glycerol solution in N2 as the carrier gas
over the catalyst bed (200mg). The Gas Hourly Space velocity was equal to 13.5 L.h-1.g-1. A
two zone reactor was used, glycerol being vaporized in the first empty zone before arriving to
the reaction zone.
The temperature in the first reactor was maintained at 300°C, while the temperature in the
second reactor was fixed at 260°C. Liquid phase products were recovered by condensation in
two cold traps located at the reactor outlet for further analysis, whereas gas phase was
analyzed by gas chromatography during the reaction. We checked that under the experimental
conditions used (relatively low temperature) no significant gaseous products such as carbon
monoxide or carbon dioxide was produced. Separation and quantification of main organic
compounds in liquid phase were performed using a gas chromatograph (Varian 430 GC)
equipped with a capillary column (50 m x 0.25mm x 0.2 µm, CP WAX 58 CB) and a FID
detector. Quantification was performed by using butanol as internal standard. The products of
the glycerol decomposition were identified by GC-MS (Varian 3800, injector 1079) coupled
with a mass spectrometer (Analyser triple quadrupole Varian 1200L with an electric impact
source of 70eV).
Conversion of glycerol and selectivity to hydroxyacetone was calculated according to the
following equations:
Glycerol conversion (%) =
×
100Selectivity to hydroxyacetone (%) =
Results and discussion
Synthesis and characterization of the catalysts
The different magnesium oxide (hydroxide) fluorides were prepared according to a
sol-gel method, from a metal alkoxide precursor, in an aqueous HF solution. Briefly, a
competition between fluorolysis (reaction with HF) and hydrolysis (reaction with water)
occurs, resulting in the formation of MgF2-x(OH)x as described in ref [36]. Kinetically, the
fluorolysis rate is higher than the hydrolysis rate, allowing a partial control of the
composition. As reported previously, with an equivalent method [36], the final F/Mg ratio
(2-x) corresponds approximately to the initial HF/Mg ratio. The remaining -OCH3 groups of the
magnesium alkoxide react with water forming the hydroxyl groups of the hydroxide fluorides.
Based on previous works [36], materials with a composition closed to MgF2 (x = 0),
MgF(OH) (x = 1) and Mg(OH)2 (x = 2) were synthesized with an initial HF/Mg ratios of 2, 1
and 0 respectively. Thus, the fluorine content in the magnesium hydroxide fluoride is easily
tuned thanks to the amount of HF added [31].
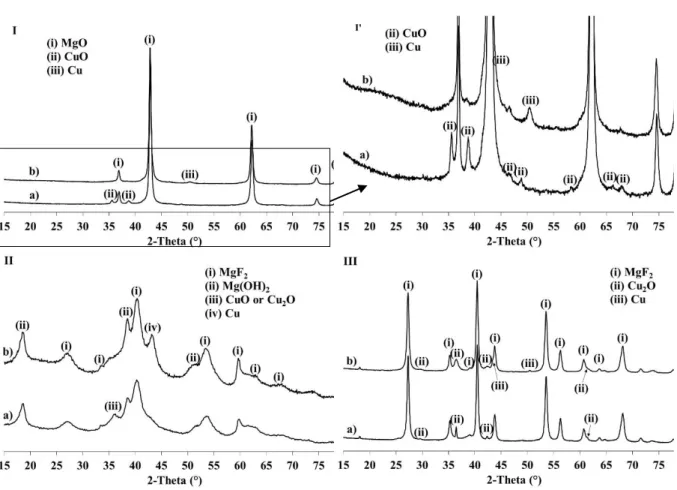
The X-ray diffraction (XRD) patterns of Cu-MgO, Cu-MgF(OH) and Cu-MgF2 obtained after
copper impregnation on the magnesium oxide hydroxide fluoride supports, and after
calcination at 350°C are reported in Figure 1. The calcination temperature was chosen in order
to stabilize thermally the catalysts while the reaction was performed at 260°C. MgO (card
n°01-089-7746 of the ICDD database), MgF2 (card n°98-009-4270) and a mixture of
Mg(OH)2 (card n°01-075-1527) and MgF2 are mainly observed on the samples MgO,
Cu-MgF2 and Cu-MgF(OH) respectively. Interestingly, MgO in Cu-MgO and Cu-MgF2 in Cu-Cu-MgF2
are well crystallized whereas a low degree of crystallinity is observed for Cu-MgF(OH).
Indeed, the presence of two phases affects the rate of crystallization of both phases as
not lead to the formation of a magnesium oxide (hydroxide) fluoride but to an intimate
mixture of magnesium oxide (or hydroxide in our case) and fluoride as already observed in
previous works [23]. The formation of CuO (card n°00-041-0254) with the main diffraction
peaks at 35.5 and 38.8° and Cu2O (card n°98-005-2043) with the main diffraction peaks at
36.4 and 42.3° are clearly observed for Cu-MgO and Cu-MgF2 respectively. Nevertheless, the
presence of CuO on Cu-MgF2 and Cu2O on Cu-MgO cannot be totally excluded due to the
overlapping of copper oxide with the peaks of the support. The attribution of the copper phase
is more difficult in the case of Cu-MgF(OH). Only one peak at 36.1 can be attributed to
copper oxide phase. Nevertheless, this broad peak with low intensity, characteristic of poorly
crystallized phase, can be attributed to (111) peak of CuO as well as (111) peak of Cu2O since
the other main peaks of these phases can be overlapped with the broad peaks of Mg(OH)2
and/or MgF2.
Finally, due to the low intensity of copper phases on XRD patterns, the determination of the
crystallite size of copper oxide is difficult. Nevertheless, the higher intensity and thinner
peaks of Cu2O in Cu-MgF2 is characteristic of larger crystallites in comparison with copper
oxides in Cu-MgOand Cu-MgF(OH).
The copper contents determined by ICP OES analysis (Table 1) are closed to the desired
theoretical content (5%) indicating that the chosen synthesis method is well adapted to control
the copper content.
The specific surface areas of the samples are reported in Table 1. As observed, after
calcination at 350°C and before impregnation of copper, the MgF(OH) support possesses a
very high specific surface area (270 m2.g-1), higher than the SBET of MgO (227 m2.g-1) and
especially the SBET of MgF2 (33 m2.g-1). This result confirms that the synthesis of magnesium
oxide (hydroxide) fluoride (or the intimate mixture of MgF2 and Mg(OH)2 in our case) by
be attributed to the low rate of crystallinity of this sample as discussed above. The
adsorption-desorption isotherms of all solids are shown in Fig. S1 (see supplementary information). A
type IV isotherm according to the IUPAC classification was observed for all samples,
whatever the fluorine content, showing the formation of mesoporous solids with high value of
porous volume (Table S1). The porous volume decreases with the increase of fluorine content.
The average pore size is significantly smaller for the MgF(OH) support in comparison with
MgF2 and MgO.
After impregnation of copper and calcination at 350°C, the specific surface area decreases for
Cu-MgF(OH) from 270 to 165 m2.g-1 and for Cu-MgO from 227 to 68 m2.g-1, whereas it
remains stable for Cu-MgF2 with 33 m2.g-1 before and 36 m2.g-1 after copper impregnation and
calcination. A type IV isotherm is retained for the three catalysts (Fig S1), the pore volume
decreases for Cu-MgF(OH) and for Cu-MgO in comparison with the supports without copper,
which is in accordance with the changes of specific surface area. The average pore sizes are
retained before and after copper impregnation and calcination (table S1). The decrease of the
specific surface area can be attributed to the impregnation step performed in water, with a
probable hydrolysis of the remaining –OCH3 due to the incomplete fluorination/hydrolysis of
the methanolic Mg(OCH3)2 solution [40]. Indeed, the higher the content of the remaining –OR
in the magnesium oxide (hydroxide) fluoride, the larger the surface. Nevertheless, very high
specific surface area is obtained for Cu-MgF(OH) compared to the two other samples which
is in accordance with the low rate of crystallinity observed by XRD (Fig. 1).
The determination of the acidity of the catalysts was performed by adsorption of pyridine
followed by FT-IR spectroscopy and the results are reported in Table 1 and fig S2. A deeper
discussion is also reported in section 2 of the supplementary information concerning the
experiments. Note that the characterization of the acidity of La2CuO4 catalyst was not
the quantification of acid sites. No significant amount of Lewis acid site is observed on
Cu-MgO and Cu-MgF(OH) by this method. On the contrary, a significant amount of Lewis acid sites (50 mol g-1
)is determined on Cu-MgF2. Interestingly, this value is closed to the amount observed on the support alone prepared at 350°C (48mol g-1
)showing that the presence of
copper does not change significantly the acidity of the material (section 2 of supplementary
information). This could be explained by the replacement of a Lewis acid site of MgF2 by
copper ion (+1), which acts as an electron acceptor providing Lewis acid centers [40].
However, it is also possible to propose that the Lewis acidity would result mainly from the
support since Cu+1 is present as large particles at the surface of the support (according to
XRD). Moreover, it is also possible that the Lewis acid sites of Cu+1 are not enough strong to
react with pyridine.
Furthermore, it is well known that the strength of Lewis acid sites of MgF2 is moderate [29].
For the supports MgO and MgF(OH), exhibiting no significant amount of Lewis acid sites
(but basic properties, as discussed below), the introduction of copper did not enhance the
number of Lewis acid site. The low acidity of CuOx-MgO catalysts was proved by Popescu et
al. [41]. It could also be explained by the diffusion of copper into the basic support as shown
by XPS (see below). Surprisingly, no Lewis acid sites are observed on Cu-MgF(OH) whereas
MgF2 is present in this sample (as shown by XRD). This can be explained by the formation of
an intimate mixture of MgF2 and Mg(OH)2 leading to strong interactions between both
phases. The presence of hydroxyl groups (Mg(OH)2) in the vicinity of unsaturated magnesium
Lewis acid sites (MgF2) decreases probably the strength of Lewis acidity due to the lower
inductive effect of -OH in comparison with fluorine atom. Consequently, the Lewis acid sites
of Cu-MgF(OH) are not enough strong to react with pyridine, a strong base.
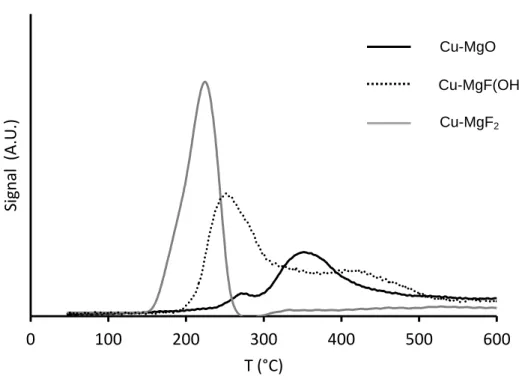
The TPR profiles of the catalysts Cu-MgO, Cu-MgF(OH) and Cu-MgF2 are reported in
Fig. 2.
The reduction profile of Cu-MgO shows two broad peaks in the 250-500°C temperature
range, which is in accordance with the results reported by Reddy et al. [42]. The first
reduction peak can be attributed to the reduction of well distributed CuO species or small
copper oxide clusters interacting weakly with the support, and the second reduction peak, at
higher temperature can be associated to large CuO particles or aggregated CuO clusters [42, 43]. Moreover, the reduction of CuO in two steps was also proposed (CuO → Cu2O → Cu°)
[41].
The reduction of Cu-MgF2 proceeds at low temperature (225°C) as a single peak, however the
non-gaussian profile of the peak suggests that different copper oxide species are present. As
shown in Fig. 1, Cu2O particles are observed in Cu-MgF2. According to previous studies,
CuO is more easily reduced than Cu2O, which seems in contradiction with the present study
[44, 45] by example the reduction peak of CuO/SiC is centered at 287°C against 302°C for
Cu2O/SiC [44]. However the reduction temperature depends strongly on the nature of copper
support. The reduction of Cu2O at a temperature as low as 225°C was reported by different
authors over TiO2 [46, 47]. It was also shown that the reduction temperature depends strongly
on phase structures: the rutile TiO2 interaction was much stronger than the
Cu2O-anatase TiO2 interaction. In our case, weak Cu2O interaction was observed with MgF2
possessing the biggest particles and lower specific surface area.
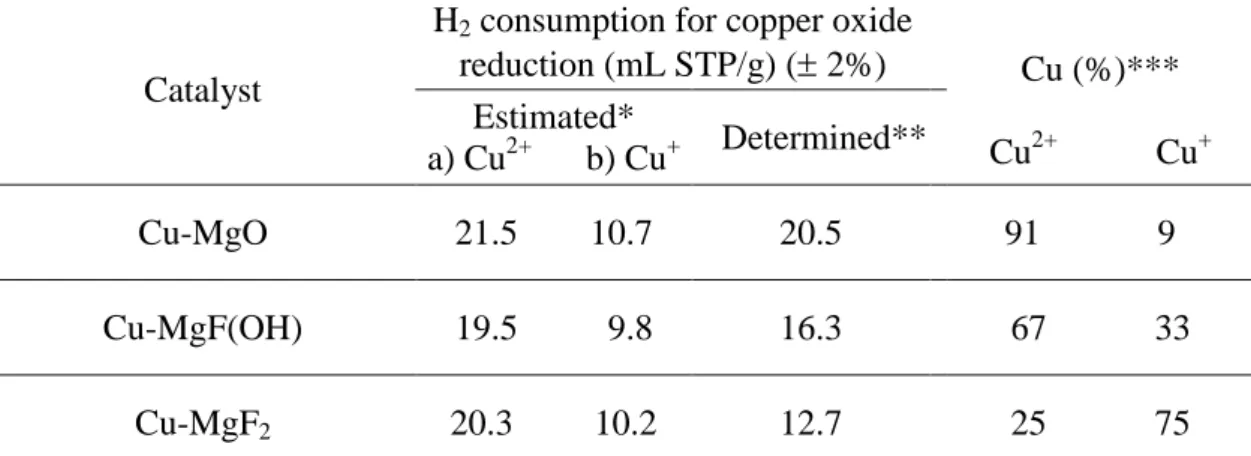
The amount of H2 consumed is reported in Table 2 for each catalyst. It can be observed that
the hydrogen consumption for the reduction of Cu-MgO is significantly higher than that for
the reduction of Cu-MgF(OH) and Cu-MgF2. Assuming that the hydrogen consumption
corresponds to copper oxide reduction, the amount of copper at the oxidation state of +2 and
CuO + H2 = Cu + H2O
Cu2O + H2 = 2Cu + H2O
The results show that Cu2+ is mainly obtained on MgO while Cu1+ is the major copper species
formed over MgF2. This is in agreement with the characterizations by XRD exhibiting the
presence of Cu2O in Cu-MgF2 and CuO in Cu-MgO. Thus, MgF2, the more acidic support,
stabilized copper species at +1 oxidation step, while a mixture of Cu2+ and Cu+ is obtained for
MgF(OH). Obtaining a mixture of Cu2+ and Cu1+ for this last catalyst is not surprising since
the support is composed of two intimately mixed phases (MgF2 and Mg(OH)2), each phase
stabilizing Cu+ and Cu2+ respectively.
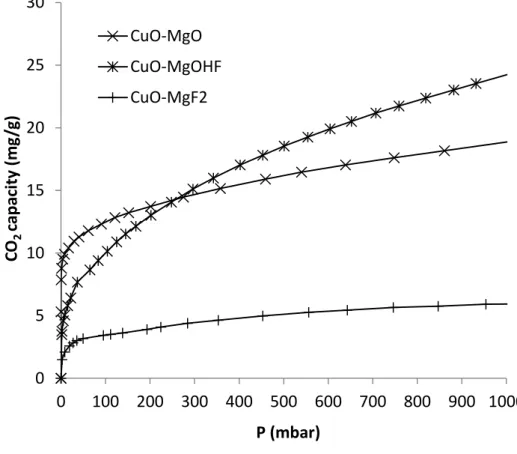
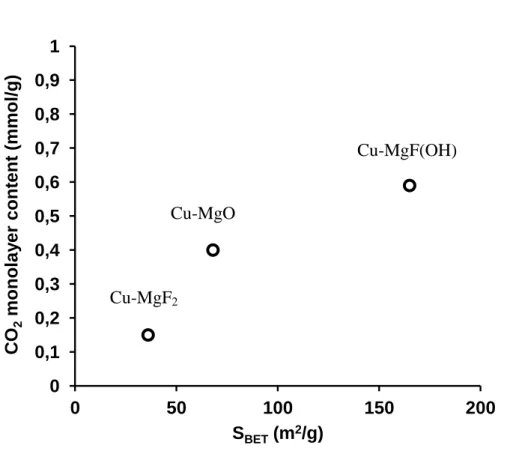
CO2 adsorption isotherms for Cu-MgO, Cu-MgFOH and Cu-MgF2 are used to characterize
the basicity and are presented in figure 3. From the observed results, it appears that the
material basicity is not linked to the copper content since the materials exhibit very different
CO2 adsorption behaviors. The total CO2 adsorption capacity depends on the material porosity
whereas the amount of CO2 adsorbed in the monolayer is directly linked to the basic site
number present at the material surface. So, these isotherms have been analyzed using the BET
model. As expected, the calculated amount of CO2 adsorbed in the monolayer is linked to the
material BET surface area determined by nitrogen physisorption (figure 4). The more
important the surface area is, the higher is the CO2 amount directly in interaction with the
solid surface. From these result, it appears that the Cu-MgFOH sample has the higher basic
site amount and Cu-MgF2 the lowest.
XPS analysis
The surface composition of the catalysts were determined by XPS analysis and the
Cu/Mg atomic ratio was calculated. As shown in Table 3, the Cu/Mg ratio is higher at the
the surface of MgF(OH) and MgO is observed. The occupation of the catalyst surface by Mg
was evidenced by Liu et al. studying a CuO-MgO-TiO2 catalyst [48]. So, with MgF(OH) and
MgO as support, copper is incorporated into the support lattice leading to a higher Cu-Mg
interaction, which corroborates the TPR profiles. Using MgF2 as support, the diffusion of
copper into the bulk is not favored, the metal-support interaction is lower explaining the lower
reduction temperature (see Fig. 2).
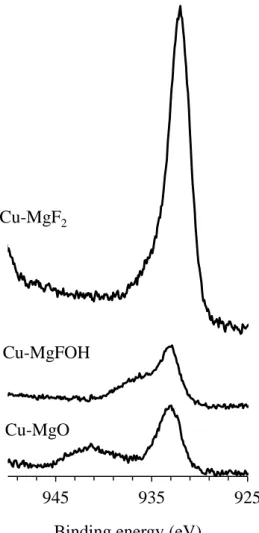
Cu 2p3/2 XPS spectra of the catalysts Cu-MgO, Cu-MgFOH and Cu-MgF2 are shown in
Figure 5. For the Cu-MgO catalyst, the presence of Cu2+ species is observed thanks to the
presence of the satellites peaks (BE region between 938 eV and 944 eV) which is the
fingerprint of Cu2+ oxidation state. However the binding energy corresponding to Cu 2p3/2 is
observed at 932.9eV, a value significantly lower than the expected one: 933.6eV [49]
probably due a charge transfer from the metal ion toward the support matrix.
For Cu-MgFOH, two Cu species seem to be present, one with a Cu 2p3/2 binding energy of
932.8 eV and the other with a Cu 2p3/2 binding energy of 936.1 eV. These are consistent with
Cu(II) species and the latter is consistent with Cu(OH)2 as proposed by Frost et al. [50].
Nevertheless the presence of CuF2 cannot be excluded since fluoride atom are present in the
support and can react with copper species. The formation of such species would confirm the
reaction between copper and the support during the calcination step.
For the Cu-MgF2 sample a single and intense peak centered at 932.1 eV is visible, while no
satellite peaks are observed indicating that there is no Cu2+ but the presence of reduced copper
species. As it is well known, XPS cannot differentiate between Cu0 and Cu+ since the binding
energy is similar. However, the presence of Cu0 is unlikely in the present study since the
catalyst was calcined at 350°C under air and no metallic copper are observed by XRD.
The XPS analysis are in accordance with the results obtained by XRD and TPR, showing the
significant higher amount of copper is observed at the surface of MgF2 compared to both
other catalysts.
Consequently the combination of characterization methods (TPD, XRD, TPR, XPS), proves
that copper is obtained at different oxidation state depending on the nature of the support.
However it is not possible to propose a simple correlation between oxidation state of copper
and support physico-chemical properties since the three materials differ strongly in terms of
acid/base properties, fluorine content, size of particles…
Catalytic results
The reaction was investigated in gas phase using a mixture of glycerol and water (80 wt
% glycerol) at 260°C to avoid the production of gaseous products at higher temperatures. The
main product was HA but pyruvaldehyde and glyceraldehyde were also formed. Other
products were analysed but they were present in low amount: propionaldehyde, glycidol, 1,3
propanediol, 1 propanol...
First, using the support alone (without copper) it was confirmed that no glycerol
transformation occurs, indicating the crucial role of copper.
The catalytic activity of the copper supported on oxide (hydroxide) fluoride catalysts is
compared with La2CuO4, which exhibited a high activity toward glycerol dehydration into
hydroxyacetone in the absence of water in the gas feed [39]. The catalytic behavior of the
three oxide (hydroxide) fluoride based catalysts differs strongly. The highest glycerol
conversion is obtained over the Cu-MgF2 catalyst, it reaches 82 % and remains relatively
stable during four hours of reaction (figure 6). Cu-MgO and Cu-MgFOH are little active
under our experimental conditions with a glycerol conversion of 19 % and 33 % after one
slightly with time on stream (figure 7). Moreover, the Cu-MgF2 catalyst is significantly more
active than La2CuO4, in the presence of water.
High glycerol conversions were also reported by Carvalho et al. [51] using Cu-based
hydroyapatites. The authors showed that glycerol conversion increased with the amount of
copper (from 3 to 17 %) highlighting the crucial role of copper as in the present work.
However a catalytic deactivation is observed after few hours on stream. Sato et al. [52]
studied the influence of the support on glycerol conversion over copper-based catalysts in gas
phase at 250°C, they found that the acid-base property of the support affected the selectivity:
basic MgO, CeO2 and ZnO supports showed low selectivity to hydroxyacetone, while acidic
supports such as Al2O3, ZrO2, Fe2O3 and SiO2 promoted HA selectivity which is in
accordance with our results (Cu-MgF2 being the most acidic catalyst).
Glycerol dehydration into hydroxyacetone implies the removal of one of the two OH groups
from the terminal carbons in the glycerol molecule, while the removal of the OH group from
the central carbon atom leads to the formation of acrolein through the unstable
3-hydroxypropenal. The predominant route depends mainly on the nature of the acid sites, it has
been suggested that acrolein is formed over Brønsted acid sites and hydroxyacetone over
Lewis acid sites [53]. The role of basic centers was also proposed by Stosic et al. [53]. The
authors showed that the yield in HA was increased with the number of basic sites. However,
using hydroxyapatite catalyst, the main reaction product was acrolein, they concluded that
acrolein formation was not only controlled by the surface acidity but also by hindering the
number/strength/activity of the basic sites, and thus limiting the side reactions which affect
the selectivity in acrolein. An intermediate enol is suggested to be formed at the surface of
basic centers, afterwards the enol is rapidly transformed by rearrangement into
1-hydroxyacetone. The results obtained in the present study showed that the basic properties of
preferentially produced over the catalyst possessing Lewis acidity (Cu-MgF2), while no
acrolein was formed. The high yield in HA can be directly correlated with the amount of
Cu+1, which also corresponds to the maximum number of Lewis acid sites (figure 8).
Moreover, the Lewis acid sites of the MgF2 support are not able to convert glycerol into
hydroxyacetone since no activity was observed with MgF2 alone. Mitta et al. [40] also showed
that a Y zeolite possessing 180µmol g-1 of Lewis acid sites exhibited a very low glycerol
conversion without copper. It is thus possible to conclude that the dehydration of glycerol
requires the presence of copper under the experimental conditions used (vapor phase,
relatively low reaction temperature: 260°C in the present study and 210°C in the work of
Mitta et al.).
The reaction route to hydroxyacetone involves the formation of an enol as proposed by
different authors on copper based catalysts [54]. The important role of copper oxidation state
was indicated by Pinheiro et al. [55] and Xiao et al. [56]. The weak acid sites, Cu2+ cannot be
responsible for dehydration [57], as confirmed by the results we obtained in the present paper.
It is also clear that metallic copper is an active site for dehydration of glycerol to HA,
dehydrogenation at the surface of Cu° occurs first and the formation of Cu-alkoxide species is
proposed [53, 58, 59]. Over Cu+, the reaction mechanism is more difficult to establish,
different authors showed that Cu+ is active for dehydration of glycerol [56, 57] which
corroborates our results. Xiao et al. [56] indicate that it is not possible to state if Cu+ is active “per se” or if it is due to the Lewis acid properties of Cu+
.
So according to the studies published and to the results we obtained two different mechanisms
are proposed: one based on Lewis acid properties of Cu+ and the other one based on the
oxidation state of copper: Cu+.
The involvement of the Lewis acid sites of Cu+ can be proposed according to the mechanism
dissociation (similar to the one proposed on metallic copper, Fig.9 b). The C-H bond rupture
at the surface of Cu+ is supported by the work of Wang et al. [60], who performed DFT
calculations to explain the dehydrogenation of cyclohexanol to cyclohexanone. The authors
proved that the hydrogen bonded to carbon is more easily removed on Cu+ than on Cu°, so a
homolytic rupture of the C-H bond in glycerol by Cu+ is proposed.
In order to support the mechanism, theoretical calculations were performed and compared
with the results of Nimlos [61] who established the more probable intermediate species in
glycerol dehydration to HA. The calculations were performed at the B3LYP/6-31+G(d,p)
level. Transition states took into consideration were radical intermediate of glycerol as shown
in Fig. 9b. All computed energies of the mechanism compounds are Gibbs free energies at
534.15 K. Calculations were performed with the Gaussian09 code.
The relative energies of the transition states involved in the two mechanisms are 70.9 and 73.2
kcal/mol for mechanism 9a) and 9b) respectively (Fig. 10). Such high energy barriers indicate
that these reactions are only likely to occur at high temperatures and under pyrolysis
conditions. The values obtained, are in the same order indicating that the formation of
intermediate species in the mechanism we propose are favorable in our experimental
conditions (T=260°C).
Shortcomings of the simulation held should be highlighted, in our case we didn’t take
into consideration the “Transition State” theory as we considered each step of the mechanism
as independent reactions. Additionally, the surface of the catalyst wasn’t taken into
consideration. This simplification hindered essential details about sorption and stabilization of
glycerol on the surface.
Further studies on the theoretical and experimental level should be held on the role of
the copper catalyst, and we consider that the discussion on the mechanism is still an open
A low catalytic activity towards HA formation is observed with Cu-MgO and Cu-MgF(OH),
which can result from low amount (or absence) of Cu1+ at the surface of the support and high
amount of basic sites which probably favors the occurrence of side reactions giving
by-products such as acids, aldehydes, aromatic compounds, glycerol oligomers [62]… and also
coke as evidenced by TGA analysis (figure 11), as discussed below.
Characterization of the catalysts after reaction
After catalytic tests, the crystalline structure of the supports is retained (Fig. 1) showing
the good stability of the magnesium oxide (hydroxide) fluoride materials under our
experimental conditions, confirming their potential as support. The peaks corresponding to
copper oxides disappear and the formation of metallic copper is observed on Cu-MgF(OH)
and Cu-MgO. This result can be explained by the reduction properties of glycerol according
to Jin et al. [63].
On the contrary, Cu2O is always observed on Cu-MgF2 even if the formation of Cu° cannot be
totally excluded due to the peaks with very low intensity at 43.3° (shoulder) and 50.4° (figure
1). Moreover, the peaks of Cu2O are broadened after reaction reflecting a decrease of the
crystallites size probably due to a partial reduction of the oxide. Nevertheless, in our
experimental conditions, MgF2 support seems to stabilize the copper oxide at a degree of
oxidation +I while metallic copper is obtained over the two other supports.
As observed in Table 1, the specific surface areas of Cu-MgF(OH) and Cu-MgO decrease
drastically (from 165 to 17 m2.g-1 and from 68 to 37 m2.g-1 respectively) after catalytic tests
whereas the specific surface area remains comparatively stable for Cu-MgF2. This is in
agreement with the XRD pattern since no change is observed after the catalytic test for
Thermal analyses (TGA) were performed on the catalysts before and after catalytic tests until
900°C (figure 11). As observed, a very weak weight loss (2.5%) is observed on Cu-MgF2
corresponding to the removal of physisorbed water and/or remaining organic compounds
derived from the sol-gel synthesis process. This weight loss is higher on Cu-MgO (4.7 %) and
especially on Cu-MgF(OH) (14.6 %). In addition to physisorbed water and remaining organic
compounds, these weight losses between 300 and 400 °C for Cu-MgO and between 400 and
500 °C for Cu-MgF(OH) can be explained by the dehydroxylation of magnesium hydroxide.
This is in agreement with the XRD pattern of Cu-MgF(OH) (figure 1) showing the presence
of magnesium hydroxide. Moreover, the XRD pattern of Cu-MgF(OH) after TGA (not
shown) corresponds to a mixture of MgO and MgF2 confirming this dehydroxylation. Even if
only MgO is observed for Cu-MgO (figure 1), the presence of a small amount of hydroxyl
group cannot be totally excluded. After catalytic tests, the weight losses are higher whatever the catalysts. This is due to the formation of “coke” on the catalyst during the transformation
of glycerol, removed by oxidation during the thermal analysis under dry air. The deposition of
coke is clearly limited on Cu-MgF2 since the difference of weight loss before and after the
catalytic test is only of 2.5 %. By contrast, the amount of coke is clearly higher for the two
other catalysts with a difference of weight loss of 24 % for MgF(OH) and 12.9 % for
Cu-MgO. These results are consistent with the SBET which decreases after reaction for both
catalysts while SBET of Cu-MgF2 remains stable as discussed above. Based on the assumption
that basic sites play a role on the coke formation by side-reactions as discussed above, the
amount of coke is also in accordance with basic properties, higher the basicity (figure 4),
higher the amount of coke.
Thus, Cu-MgF2 is a more suitable catalyst than the two other catalysts to avoid decrease of
specific surface area, formation of coke and deactivation. Long terms experiment should be
Conclusions
The dehydration of glycerol to hydroxyacetone was successfully investigated over
copper supported on magnesium oxide (hydroxide) fluoride catalysts, in gas phase in the
presence of water at 260°C. The catalysts were prepared according to a sol-gel method
following by a copper impregnation step and led to different CuOx-magnesium oxide
(hydroxide) fluoride composites with different crystallinities, copper oxidation state and
tunable acid-base properties. Among the different studied catalysts, Cu-MgF2 is the most
interesting since Cu+, the active site, is stabilized at the surface of the support, whereas no (or
little) coke formation during time on stream is observed contrary to MgO and
Cu-Mg(OH)F catalysts. Moreover, this catalyst led to the best catalytic activity and stability, with
a glycerol conversion reaching 82% and a yield in hydroxyacetone of 45.5% after one hour of
reaction. Cu-MgF2 is much more active than La2CuO4 (26.7% yield in HA) which exhibited a
high activity towards HA synthesis but in the absence of water. The results obtained in the
present study showed that the basic properties of the catalysts did not governed the
dehydration of glycerol into HA. The best catalyst (Cu-MgF2) is the one possessing Lewis
acidity and stabilizing copper at +1 oxidation state.
Thanks to their tunable properties (acid/base, specific surface area, metal/support interaction),
this work confirms the potential of magnesium oxide (hydroxide) fluoride as support for
different heterogeneous catalytic processes as already observed for other reactions. In another
way, it offers new opportunities for the production of hydroxyacetone from glycerol with an
environmentally friendly process.
References
[2] D. Sun, Y. Yamada, S. Sato, W. Ueda, Appl. Catal. B: Env., 193 (2016) 75-92
[3] D. Roy, B. Subramaniam, R. V.Chaudhari, Catal. Today, 156 (2010) 31-37
[4] V. Montes, M. Checa, A. Marinas, M. Boutonnet, J.M. Marinas, F.J. Urbano, S. Järas, C. Pinel, Catal. Today, 223, (2014) 129-137
[5] M. Massa, A. Andersson, E. Finocchio, G. Busca, J Catal. 307 (2013) 170-184
[6] J. Deleplanque, J.-L. Dubois, J.-F. Devaux, W. Ueda, Catal. Today, 157 (2010) 351-358
[7] A. Talebian-Kiakalaieh, N. Aishah Saidina Amin,Renewable Energy, 114 (2017) 794-804
[8] T. Ma, J. Ding, R. Shao, W. Xu, Z. Yun, Chem. Eng. J., 316 (2017) 797-806
[9] M. E Doukkali, A. Iriondo, J.F. Cambra, I. Gandarias, L. Jalowiecki-Duhamel, F. Dumeignil, P.L. Arias, Appl. Catal. A: Gen. 472 (2014) 80-91
[10] M. Dalil, D. Carnevali, M. Edake, A. Auroux, J.L. Dubois, G.S. Patience, J. Mol. Cat. A: Chem., 421 (2016) 146-155
[11] L. H. Vieira, K.T.G. Carvalho, E. A. Urquieta-González, S . H. Pulcinelli, C. V. Santilli, L. Martins, J. Mol. Cat. A: Chem., 422 (2016) 148-157
[12] W. Suprun, M. Lutecki, H. Papp, Chem. Eng. Tech. 33 (2010) 1-7
[13] A. Alhanash, E. F. Kozhevnikova, I. V. Kozhevnikov, Appl. Catal. A: Gen., 378 (2010) 11-18
[14] C.L. Lima, S. J.S. Vasconcelos, J.M. Filho, B. C. Neto, M.G.C. Rocha, P. Bargiela, A. C. Oliveira, Appl. Catal. A: Gen 399 (2011) 50-62
[15] P. Lauriol-Garbey, J.M.M. Millet, S. Loridant, V. Bellière-Baca, P. Rey, J. Catal. 281 (2011) 362-370
[16] A. Kinage, P. Upare, P. Kasinathan, Y. Kyu Hwang, J.S. Chang, Catal. Comm. 11 (2010) 620-623
[17] C. Montassier, J.C. Ménézo, L.C. Hoang, C. Renaud, J. Barbier, J. Mol. Cat. 70 (1991) 99-110
[18] S. Xia, R. Nie, X. Lu , L.Wang, P. Chen, Z. Hou, J. Catal. 296 (2012)1-11 [19] D. Roy, B. Subramaniam, R. V. Chaudhari, ACS Catal. 1 (2011) 548-551 [20] E. Kemnitz, Catal. Sci. Technol. 5 (2015), 786-806
[21] S. Célérier F. Richard, Catal. Commun. 67 (2015) 26-30
[24] A. Negoi, S. Wuttke, E. Kemnitz, D. Macovei, V. I. Parvulescu, C. M. Teodorescu, S. M. Coman, Angew. Chem. Int. Ed. 49 (2010) ) 8134 –8138
[25] F. Richard, S. Célérier, M. Vilette, J. D. Comparot, V. Montouillout, Appl. Catal. B 152-153 (2014) 241-249
[26] I. Agirrezabal-Telleria, F. Hemmann, C. Jäger, P.L. Arias, E. Kemnitz, J. Catal. 305 (2013) 81–91
[27] M. Zielinski, M. Pietrowski, A. Kiderys, M. Kot, E. Alwin, J. Fluor. Chem. 195 (2017) 18–25
[28] M. Wojciechowska, M. Zielinski, M. Pietrowski, J. Fluor. Chem. 120 (2003) 1-11
[29] S. Wuttke, S. M. Coman, G. Scholz, H. Kirmse, A. Vimont, M. Daturi, S. L. M. Schroeder, E. Kemnitz , Chem. Eur. J. 14 (2008) 11488 – 11499
[30] E. Kemnitz, S. Wuttke, S. M. Coman, Eur. J. Inor. Chem., (2011) 4773-4794
[31] M. Wojciechowska, A. Wajnert, I. Tomska-Foralewska, M. Zielinski, B. Czajka, Catal Lett 128 (2009) 77–82
[32] I. Tomska-Foralewska, M. Zielinski, M. Pietrowski, W. Przystajko, M. Wojciechowska, Catal. Today 176 (2011) 263–266
[33] M. Zielinski, I. Tomska-Foralewska, M. Pietrowski, W. Przystajko, M. Wojciechowska, Catal. Today 191 (2012) 75–78
[34] M. Zielinski, A. Kiderys, M. Pietrowski, I. Tomska-Foralewska, M. Wojciechowska, Catal. Commun. 76 (2016) 54–57
[35] M. Bonarowska, M. Wojciechowska, M. Zielinski, A. Kiderys, M. Zielinski, P. Winiarek, Z. Karpinski, Molecules 21 (2016) 1620
[36] G. Scholz, C. Stosiek, M. Feist, E. Kemnitz, Eur. J. of Inorg. Chem. 14 (2012) 2337-2340
[37] S. Wuttke, S. M. Coman, J. Kroehnert, F. C. Jentoft, E. Kemnitz, Catal. Today 152 (2010) 2-10
[38] H. A. Prescott, Z. J. Li, E. Kemnitz, J. Deutsch, H. Lieske, J. Mater. Chem. 15 (2005) 4616–4628
[39] M. Velasquez, A. Santamaria, C. Batiot-Dupeyrat, Appl. Catal. B: Env, 160-161 (2014) 606-613
[40] H. Mitta, P. Kumar Seelam, S. Ojala, R. L. Keiski, P. Balla, Appl. Catal. A, General 550 (2018) 308-319
[41] I. Popescu, N. Tanchoux, D. Tichit, I.C. Marcu, Appl. Catal. A: Gen 538 (2017) 81-90 [42] K.H.P. Reddy, Y.W. Suh, N. Anand, B.D. Raju, K. S. Rama Rao, Catal. Com. 95 (2017)21-25
[43] M. Jablonska, L. Chmielarz, A. Wegrzyn, K. Guzik, Z. Piwowarska, S. Witowski, R.I. Walton, P.W. Dunne, F. Kovanda, J. Therm. Anal. Calorim. 114 (2013) 731-747
[44] Y. Wang, X. Guo, M. Lu, Z. Zhai, Y. Wang, X. Guo, Chinese Journal of Catalysis 38 (2017) 658-664
[45] C.S. Polster, H. Nair, C.D. Baertsh, J. Catal. 266 (2009) 308-319 [46] Y. Liu, Z. Wang, W. Huang, Appl. Surf. Sci. 389 (2016) 760-767
[47] C.S. Chen, T.C. Chen, C.C. Chen, Y.T. Lai, J.H. You, T.M. Chou, C.H. Chen, J.F. Lee, Langmuir, 28 (2012) 9996-10006
[48] C. Liu, X. Guo, Q. Guo, D. Mao, J. Yu, G. Lu, J. Mol. Cat. A: Chemical 425 (2016) 86– 93
[49] M.C. Biesinger, L.W.M. Lau, A.R. Gerson, R.S.C. Smart, Appl. Surf. Sci. 257 (2010) 887–898
[50] Ray L. Frost, Yunfei Xi, Barry J. Wood, Thermochimica Acta 545 (2012) 157– 162 [51] D. C. Carvalho, L. G. Pinheiroa, A. Campos, E. R.C. Millet, F. F. de Sousac, J. M. Filhoc, G. D. Saraivac, E. C. da Silva Filhod, M. G. Fonsecae, A. C. Oliveira, Appl. Catal. A: Gen 471 (2014) 39-49
[52] S. Sato, M. Akiyama, R. Takahashi, T. Hara, K. Inui, M. Yokota, Appl. Catal. A : Gen 347 (2008) 186-191
[53] D. Stosic, S. Bennici, S. Sirotin, C. Calais, J.L. Couturier, J.L. Dubois, A. Travert, A. Auroux, Appl. Catal. A: Gen., 447-448 (2012) 124-134
[54] B. Katryniok, S. Paul, V. Bellière-Baca, P. Reye and F. Dumeignil, Green Chem., 12 (2010) 2079-2098
[55] T.Pinheiro Braga, N. essayem, A. Valentini, J. Therm. Anal. Calorim. 129 (2017) 65-74 [56] Z. Xiao, X. Wang, J. Xiu, Y. Wang, C.T. Williams, C. Liang, Catal. Today, 234 (2014) 200-207
[57] P.A. Torresi, V.K. Diez, P.J. Luggren, J.I. Di Cosimo, Appl. Catalysis A: general 458 (2013) 119-129
[58] A.J. Gellman, M.T. Buelow, S.C. Street, T.H. Morton, J. Phys. Chem. A 104 (2000) 2476
[59] R.M. Rioux, M.A. Vannice, J. Catal. 216 (2003) 362-376 [60] Z. Wang, X. Liu, R. P. Hu, Surface Science 640 (2015) 181-189
[61] M.R. Nimlos, S.J. Blanksby, X. Qian, M.E. Himmel, D.K. Johnson, J.Phys. Chem. A 110 (2006) 6145-6156
[62] F.A.A. Barros, H.S.A. de Sousa, A . C. Oliviera, M.C. Junior, J.M. Filho, B.C. Viana, A.C. Oliveira, Catal. Today, 212 (2013) 127-136
Table 1 Textural properties of the catalysts Support SBET (m2 g-1) Catalyst SBET (m2 g-1) SBET (m2 g-1) after catalytic test Weight content of Cu (%)1 Lewis Acidity (µmol g-1) MgO 227 Cu-MgO 68 37 4.7 < 10 MgF(OH) 270 Cu-MgF(OH) 165 17 4.6 < 10 MgF2 33 Cu-MgF2 36 27 4.8 50 La2CuO4 2.2 n.d. 1
determined from ICP OES analysis
Table 2 Hydrogen consumption and Cu2+/Cu+ concentration determined from TPR analysis.
Catalyst
H2 consumption for copper oxide
reduction (mL STP/g) ( 2%) Cu (%)*** Cu2+ Cu+ Estimated* a) Cu2+ b) Cu+ Determined** Cu-MgO 21.5 10.7 20.5 91 9 Cu-MgF(OH) 19.5 9.8 16.3 67 33 Cu-MgF2 20.3 10.2 12.7 25 75 *Estimated: calculated from the nominal composition of the material according to the following reactions: a) CuO + H2 = Cu + H2O and b) Cu2O + H2 = 2Cu + H2O
**Determined: obtained from H2-TPR profile
Table 3 Cu/Mg atomic ratio
Atomic ratio Cu/Mg Cu-MgO Cu-MgF(OH) Cu-MgF2
Bulk* 0.036 0.050 0.054
Surface** 0.008 0.029 0.082
* Calculated from ICP OES
Figure 1. XRD patterns of (I and I’) Cu-MgO, (II) Cu-MgF(OH) and (III) Cu-MgF2 after
Figure 2: TPR analysis 0 100 200 300 400 500 600 Sign al ( A .U .) T (°C) Cu-MgO Cu-MgF(OH) Cu-MgF2
Figure 3: Isotherms of CO2 adsorption on Cu-magnesium fluoride catalysts 0 5 10 15 20 25 30 0 100 200 300 400 500 600 700 800 900 1000 CO 2 ca p aci ty (m g/ g) P (mbar) CuO-MgO CuO-MgOHF CuO-MgF2
Figure 4: CO2 monolayer content versus surface area for MgO, MgF(OH) and Cu-MgF2 0 0,1 0,2 0,3 0,4 0,5 0,6 0,7 0,8 0,9 1 0 50 100 150 200 CO 2 monola y e r c ont e nt (mmol/ g) SBET (m2/g) Cu-MgF2 Cu-MgO Cu-MgF(OH)
Figure 5: XPS analysis of Cu-MgO, Cu-MgFOH and Cu-MgF2
925 935
945
Binding energy (eV) Cu-MgO
Cu-MgFOH
Figure 6: Glycerol conversion as a function of reaction time and catalyst 0 10 20 30 40 50 60 70 80 90 100 0 1 2 3 4 c onv e rs ion (% ) Time (hours) Cu-MgO Cu-MgF2 La2CuO4 Cu-MgFOH
Figure 7: Yield in HA as a function of reaction time and catalyst 0 10 20 30 40 50 60 70 80 90 100 0 1 2 3 4 y ie ld in H A Time (hours) Cu-MgO Cu-MgF2 La2CuO4 Cu-MgFOH
Figure 8: Hydroxyacetone yield after 1 hour of reaction as function of acid sites density and Cu+1 concentration 0 0,002 0,004 0,006 0,008 0,01 0,012 0,014 0,016 0,018 0 10 20 30 40 50 60 70 80 90 100 0 10 20 30 40 50 Cu +1 p e r u n it su rf a ce (m m o l/m 2 ) L e w is a cid site s (µ m o l/g ) Yield in HA (%)
Figure 9: Proposed reaction routes of hydroxyacetone formation from glycerol on Cu-MgF2
(a) Lewis acid mechanism proposed by Alhanash; (b) homolytic dissociation mechanism
+ + + + H2O (a) (b) +
Figure 10: Potential energy plot for the reaction of neutral glycerol to form acetol (red: Nimos et al. [61], black: calculated Gibbs energy for mechanism b)
-20 0 20 40 60 80 100 0.0 73.2 6.9 60.3 -4.0 80.4 12.9 -11.3 E0 relat iv e (kcal/m o l)
ΔG
1ΔG
2ΔG
3 H2OFigure 11: TGA curves of a) Cu-MgO, b) Cu-MgF(OH) and c) Cu-MgF2 before (solid line)