HAL Id: hal-03117487
https://hal.archives-ouvertes.fr/hal-03117487
Submitted on 21 Jan 2021
HAL is a multi-disciplinary open access
archive for the deposit and dissemination of
sci-entific research documents, whether they are
pub-lished or not. The documents may come from
teaching and research institutions in France or
abroad, or from public or private research centers.
L’archive ouverte pluridisciplinaire HAL, est
destinée au dépôt et à la diffusion de documents
scientifiques de niveau recherche, publiés ou non,
émanant des établissements d’enseignement et de
recherche français ou étrangers, des laboratoires
publics ou privés.
Distributed under a Creative Commons Attribution - NonCommercial - NoDerivatives| 4.0
Impact of Raltegravir or Efavirenz on Cell-Associated
Human Immunodeficiency Virus-1 (HIV-1)
Deoxyribonucleic Acid and Systemic Inflammation in
HIV-1/Tuberculosis Coinfected Adults Initiating
Antiretroviral Therapy
H. M. Delagreverie, Claire Bauduin, N. de Castro, B. Grinsztejn, M. Chevrier,
F. Jouenne, S. Mourah, I. Kalidi, J. H. Pilotto, C. Brites, et al.
To cite this version:
H. M. Delagreverie, Claire Bauduin, N. de Castro, B. Grinsztejn, M. Chevrier, et al.. Impact of
Raltegravir or Efavirenz on Cell-Associated Human Immunodeficiency Virus-1 (HIV-1)
Deoxyribonu-cleic Acid and Systemic Inflammation in HIV-1/Tuberculosis Coinfected Adults Initiating
Antiretro-viral Therapy. Open Forum Infectious Diseases, Oxford University Press, 2020, 7 (2), pp.ofz549.
�10.1093/ofid/ofz549�. �hal-03117487�
M A J O R A R T I C L E
Open Forum Infectious Diseases
Received 9 October 2019; editorial decision 30 December 2019; accepted 2 January 2020. Correspondence: Constance Delaugerre, PharmD, PhD, Laboratoire de Virologie, Hôpital Saint Louis, 1 Avenue Claude Vellefaux, Paris, France 75010 ([email protected]).
Open Forum Infectious Diseases®
© The Author(s) 2020. Published by Oxford University Press on behalf of Infectious Diseases Society of America. This is an Open Access article distributed under the terms of the Creative Commons Attribution-NonCommercial-NoDerivs licence (http://creativecommons.org/licenses/ by-nc-nd/4.0/), which permits non-commercial reproduction and distribution of the work, in any medium, provided the original work is not altered or transformed in any way, and that the work is properly cited. For commercial re-use, please contact [email protected] DOI: 10.1093/ofid/ofz549
Impact of Raltegravir or Efavirenz on Cell-Associated
Human Immunodeficiency Virus-1 (HIV-1)
Deoxyribonucleic Acid and Systemic Inflammation
in HIV-1/Tuberculosis Coinfected Adults Initiating
Antiretroviral Therapy
Héloïse M. Delagreverie,1,2, Claire Bauduin,3 Nathalie De Castro,4 Beatriz Grinsztejn,5 Marc Chevrier,6 Fanélie Jouenne,7 Samia Mourah,7 Issa Kalidi,8 Jose Henrique Pilotto,9 Carlos Brites,10 Nemora Tregnago Barcellos,11 Ali Amara,2 Linda Wittkop,3,12 Jean-Michel Molina,2,4 and Constance Delaugerre1,2
1Laboratoire de Virologie, Hôpital Saint Louis, Assistance Publique-Hôpitaux de Paris, Paris, France, 2INSERM U944, Université de Paris, Paris, France, 3ISPED, Inserm, Bordeaux Population Health
Research Center, Team MORPH3EUS, UMR 1219, CIC-EC 1401, Bordeaux University, Bordeaux, France, 4Maladies Infectieuses et Tropicales, Hôpital Saint Louis, Assistance Publique-Hôpitaux de
Paris, Paris, France, 5Evandro Chagas Clinical Research Institute-Fiocruz, STD/AIDS Clinical Research Laboratory, Rio de Janeiro, Brazil, 6Laboratoire de Biochimie, Hôpital Saint Louis, Assistance
Publique-Hôpitaux de Paris, Paris, France, 7Laboratoire de Pharmacologie, Hôpital Saint-Louis Assistance Publique-Hôpitaux de Paris, Paris, France, 8Laboratoire d’Hématologie, Hôpital
Saint-Louis Assistance Publique-Hôpitaux de Paris, Paris, France, 9Hospital Geral de Nova Iguaçu, Departamento de DST/AIDS, Rio de Janeiro, Brazil, 10Hospital Universitário Profesor Edgar Santos,
Laboratório de Pesquisa em Doenças Infecciosas, Bahia, Brazil, 11Health State Secretariat/RS, Hospital Sanatório Partenon, Porto Alegre, Brazil, 12Pole de Santé Publique, Service d’Information
Medicale, CHU de Bordeaux, Bordeaux, France
Background. In view of the fast viremia decline obtained with integrase inhibitors, we studied the respective effects of initiating
efavirenz (EFV) or raltegravir (RAL)-based antiretroviral therapy (ART) regimens on human immunodeficiency virus (HIV)-1 de-oxyribonucleic acid (DNA) levels and inflammation biomarkers in the highly inflammatory setting of advanced HIV-1 disease with tuberculosis (TB) coinfection.
Methods. We followed cell-associated HIV-1 DNA, high-sensitivity C-reactive protein (hsCRP), interleukin 6 (IL-6), soluble
CD14 and D-Dimer levels for 48 weeks after ART initiation in the participants to the ANRS12-180 REFLATE-TB study. This phase II open-label randomized study included ART-naive people with HIV and TB treated with rifampicin to receive RAL 400 mg twice daily (RAL400), RAL 800 mg twice daily (RAL800) or EFV 600 mg QD with tenofovir and lamivudine.
Results. In 146 participants, the median (interquartile range [IQR]) week (W)0 HIV-1 DNA level was 4.7 (IQR, 4.3–5.1) log10
copies/106 CD4+, and the reduction by W48 was −0.8 log
10 copies/106 CD4+ on EFV, −0.9 on RAL400, and −1.0 on RAL800 (P = .74).
Baseline median (IQR) hsCRP, IL-6, sCD14, and D-Dimer levels were 6.9 (IQR, 3.3–15.6) mg/L, 7.3 (IQR, 3.5–12.3) pg/mL, 3221 (IQR, 2383–4130) ng/mL, and 975 (IQR, 535–1970) ng/mL. All biomarker levels decreased over the study: the overall W0–W48 mean (95% confidence interval) fold-change on ART was 0.37 (IQR, 0.28–0.48) for hsCRP, 0.42 (IQR, 0.35–0.51) for IL-6, 0.51 (IQR, 0.47–0.56) for sCD14, and 0.39 (IQR, 0.32–0.47) for D-Dimers. There were no differences in biomarker reduction across treatment arms.
Conclusions. In participants with HIV and TB, EFV, RAL400, or RAL800 effectively and equally reduced inflammation and
HIV-1 DNA levels.
Keywords. HIV-1 DNA; HIV integrase inhibitors; inflammation; raltegravir; tuberculosis. Integrase strand transfer inhibitors (INSTIs) are widely
re-commended for first-line and maintenance antiretroviral therapy (ART) because of their potency for rapid viremia
suppression, their good tolerance profile, and few drug-drug interactions. This is the reason why INSTIs appear to be an alternative to efavirenz (EFV) in people with human immu-nodeficiency virus (HIV) coinfected with tuberculosis (TB) and treated with rifampin. Raltegravir (RAL) is metabolized by glycuronoconjugation (and not by CYP450) and can be coadministered with rifampin. The manufacturer recommends that RAL dosage be doubled to 800 mg twice daily (BID) to im-prove trough concentrations [1, 2].
The ANRS 12180 REFLATE-TB trial was a phase II, multicenter, noncomparative, open-label, randomized study of the efficacy of 2 doses of RAL (400 mg or 800 mg BID) or EFV-based first-line ART to suppress viral replication in participants
applyparastyle “fig//caption/p[1]” parastyle “FigCapt”
coinfected with HIV-1 and TB. Safety and efficacy were sim-ilar between treatment arms at week (W)48, and, as expected, viral suppression was achieved faster with RAL between W0 and W24 [3]. In the pharmacokinetics (PK) study, the trough concentration of RAL and other PK parameters were modestly altered by rifampicin coadministration [4].
People with HIV/TB coinfection typically present with low nadir CD4+ T-cell count and high HIV viral load. These char-acteristics are associated with marked systemic inflammation [5–8] and a greater viral reservoir [9, 10]. In addition to drug interactions and toxicities, ART initiation during TB infection is at high risk of immune reconstitution inflammatory syn-drome (IRIS) [11]. In view of the fast decrease of HIV viral load with INSTI-based ART, these drugs raised high expectations regarding HIV reservoir reduction and immune activation/in-flammation recovery but also concern regarding the risk of IRIS [12, 13].
In this substudy of ANRS 12-180 REFLATE-TB, we investi-gated the impact of ART initiation with 2 doses of RAL com-pared with EFV on the size of the total cell-associated HIV-1 deoxyribonucleic acid (DNA) reservoir, the levels of inflam-mation and coagulation markers (high-sensitivity C-reactive protein (hsCRP), interleukin 6 (IL-6), soluble CD14 (sCD14) and D-Dimers) and IRIS rate. This is the first report of a large randomized study of reservoir and inflammation reduction after INSTI-based ART initiation in people with HIV and TB coinfection and high baseline inflammation.
METHODS
Study
ANRS12-180 REFLATE-TB is registered in www.ClinicalTrials. gov (NCT00822315). Adult participants with untreated chronic HIV-1 infection and plasma viral load >1000 copies/mL were recruited in Brazil and France from July, 2009 to June, 2011 and randomized into 3 treatment arms: RAL (Merck, Philadelphia, PA) 400 mg BID (RAL400), RAL 800 mg BID (RAL800), or EFV (Bristol Myers Squibb, Rueil Malmaison, France) 600 mg once daily associated with tenofovir (Gilead Sciences, Foster City, CA) (245 mg once daily) and lamivudine (ViiV HealthCare, Marly le Roi, France) (300 mg once daily). Participants in the RAL800 arm switched to the standard 400 mg dose of RAL 1 month after rifampin discontinuation, but not before W24. Tuberculosis treatment was initiated 2–8 weeks before ART in-itiation (W0). All participants with available W0 samples were included in the reservoir and inflammation study.
Ethics Statement
The study was carried out in accordance with the ANRS Ethical Chart for Research in Developing Countries, the Brazilian reg-ulatory requirements for clinical trials, and the Declaration of Helsinki. The protocol was approved by national and local ethics
committees in Brazil (Comissao Nacional de Etica em Pesquisa and Comite de Etica em Pesquisa at Instituto de Pesquisa Clínica Evandro Chagas–Fundação Oswaldo Cruz [IPEC–FIOCRUZ]) and France (Comité de Protection des Personnes de Paris Ile-de-France I). The experiments were conducted with the under-standing and the written consent of each participant.
Samples
Ethylenediaminetetraacetic acid (EDTA) blood samples were collected at W0, W24, and W48 for cell-associated HIV-1 DNA quantification. Inflammation and coagulation biomarkers were measured in EDTA plasma samples collected at W0, W4, W12, W24, and W48. Samples were banked at −80°C.
Total Cell-Associated Human Immunodeficiency Virus-1 Deoxyribonucleic Acid Quantification
Total DNA was extracted from thawed EDTA whole blood samples using the DSP DNA Mini Kit with a QiaSymphony instrument (QIAGEN, Courtaboeuf, France). Human immu-nodeficiency virus-1 DNA copy numbers were quantified by real-time polymerase chain reaction (PCR) using the Generic HIV-1 DNA Cell kit ([Biocentric, Bandol, France] variability coefficient 3.9% [14]) and normalized by the total cell input into the PCR (by µg DNA) and the frequency of CD4+ T cells in pe-ripheral blood (by flow cytometry).
Inflammation Biomarkers
High-sensitivity CRP and IL-6 levels were measured with the high-sensitivity Tina-Quant CRP Gen3 (limit of quantification [LOQ] 0.1 mg/L, interassay variability coefficient at LOQ 6.2%) and the IL-6 Elecsys Immunoassay (LOQ 1.5 pg/mL, variability coefficient 3.1%) kits with an automated COBAS Modular plat-form (Roche Diagnostics, Meylan, France). D-Dimers were quantified using the LIATEST DdiPlus STA kit (LOQ 270 ng/ mL, variability coefficient 7.31%) with a STA-R coagulation an-alyzer (Stago Diagnostica, Asnières-sur-Seine, France). Human sCD14 was measured with the hCD14 Quantikine ELISA Kit (LOQ 250 pg/mL, variability coefficient 7.4%; R&D Systems, Minneapolis, MN). Biomarkers were quantified using con-sistent reagent lots to eliminate lot-to-lot variability.
Statistical Analysis
Qualitative variables were described in terms of frequency and proportion. Quantitative variables were described in terms of median, interquartile range, minimum, and maximum. Overall comparisons between the 3 arms were made by using a Kruskal-Wallis test. Two-by-two comparisons were performed using a Student’s t test or a Wilcoxon test as appropriate. Transformations to normalize distributions were performed when necessary. Within each treament arm, 2-sided Wilcoxon signed-rank tests were used to assess significant changes from W0 to W4 and from W0 to W48 for biomarkers levels. Correlations between 2 quan-titative variables were calculated using the Spearman correlation
coefficient. Tests were 2-sided with the risk α set at 5%. Fold-changes of each biomarker level from W0 to W4 (early fold-change) and from W0 to W48 (late fold-fold-change) were calculated as the mean differences of the biomarker level at W4 (early fold-change) and at W48 (late fold-fold-change) compared with baseline on the log10 scale and backtransformed to represent mean fold-change from baseline. Fold-fold-changes were described with mean and 2-sided 95% confidence interval (CI) of the mean, with 1 indicating no change. Separate linear mixed models including random effects on intercept and slope were adjusted on sex and age and used to study factors associated with the evolution of HIV-DNA, hsCRP, Il-6, D-Dimer, and sCD14 to account for intrapatient correlation. An unstructured variance-covariance matrix was used, and biomarkers were log10 transformed to re-spect model assumptions, ie, normality and homoscedasticity of residuals. Analyses were performed using SAS software (version 9.4; SAS Institute, Cary, NC).
RESULTS
Participant Characteristics at Baseline
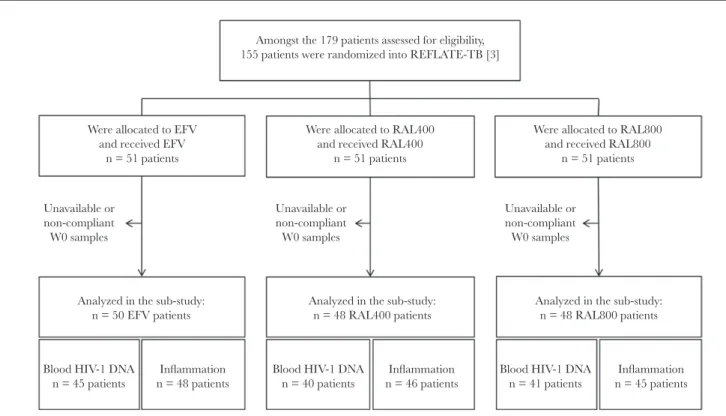
Of the 155 participants randomized into ANRS12-180 REFLATE-TB, 146 participants were included in this study: 50 in the EFV arm, 48 in the RAL400 arm, and 48 in the RAL800 arm (Figure 1). Blood and plasma samples were not available for all participants at W0; there-fore, HIV-1 DNA blood levels and systemic inflammation markers were analyzed in 126 and 139 participants, respectively.
Baseline characteristics were similar across treatment arms
(Table 1) and to those of the overall participants initially
in-cluded in the trial [3]. A total of 72.6% of the participants were men, the median age was 37 years, and the median body mass index was 21 kg/m2 (below 18.5 kg/m2 in 23% of the partici-pants). Participants had received TB treatment for a median of 5.8 weeks (interquartile range [IQR], 4.9–7.0), the median CD4+ T-cell count was 140 cells/mm3 (IQR, 57–297), and the median plasma HIV-1 ribonucleic acid (RNA) viral load was 4.9 log10 copies/mL (IQR, 4.4–5.4), with no differences between arms.
The overall median HIV-1 DNA level was 4.7 (IQR, 4.3– 5.1) log10 copies/106 CD4+ T cells at W0: 4.9 (IQR, 4.4–5.1) in the
EFV arm, 4.7 (IQR, 4.2–5.1) in the RAL400 arm, and 4.6 (IQR, 4.2–5.0) in the RAL800 arm (P = .28).
The median plasma levels of all 4 biomarkers at W0 in the EFV, RAL400, and RAL800 arms, respectively, were as fol-lows: hsCRP levels were 5.4 mg/L (IQR, 3.5–13.3), 8.5 mg/L (IQR, 3.2–19.9), and 10.6 mg/L (IQR, 3.3–20.8), respec-tively (P = .19); IL-6 levels were 6.3 pg/mL (IQR, 3.1–11.4), 7.3 pg/mL (IQR, 3.9–13.7), and 8.3 pg/mL (IQR, 3.5–14.1), respectively (P = .39); sCD14 levels were 3490 ng/mL (IQR, 2800–4126), 3025 ng/mL (IQR, 2163–4203), and 3137 ng/ mL (IQR, 2300–4049), respectively (P = .37); and D-Dimer levels were 890 ng/mL (IQR, 460–1570), 1200 ng/mL (IQR, 620–2980), and 985 ng/mL (IQR, 555–1840), respectively (P = .24). Unavailable or non-compliant W0 samples Unavailable or non-compliant W0 samples Unavailable or non-compliant W0 samples Amongst the 179 patients assessed for eligibility,
155 patients were randomized into REFLATE-TB [3]
Were allocated to EFV and received EFV
n = 51 patients
Analyzed in the sub-study: n = 50 EFV patients
Analyzed in the sub-study: n = 48 RAL400 patients
Analyzed in the sub-study: n = 48 RAL800 patients Were allocated to RAL400
and received RAL400 n = 51 patients
Were allocated to RAL800 and received RAL800
n = 51 patients
Blood HIV-1 DNA
n = 45 patients n = 48 patientsInflammation Blood HIV-1 DNAn = 40 patients n = 46 patientsInflammation Blood HIV-1 DNAn = 41 patients n = 45 patientsInflammation
Figure 1. Study flow diagram.
Viral Suppression on Antiretroviral Therapy
After ART initiation, the suppression of HIV-1 viremia was faster with RAL: by W4, the median (IQR) viremia was sig-nificantly higher on EFV (2.2 [IQR, 1.8–2.7] log10 copies/mL) than on RAL (RAL400 1.7 [IQR, 1.7–2.0] and RAL800 1.7 [IQR, 1.7–1.9] log10 copies/mL) (P < .0001). At W12, W24, and W48, median HIV-1 RNA was suppressed below the LOQ of 1.7 log10 copies/mL in all treatment arms.
Evolution of Cell-Associated Human Immunodeficiency Virus-1 Deoxyribonucleic Acid Levels on Antiretroviral Therapy
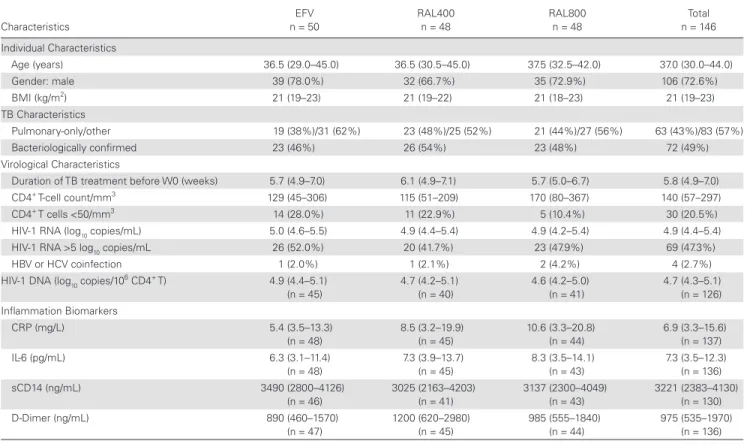
Overall, HIV-1 DNA levels declined to 4.1 (3.8–4.3) log10 copies/106 CD4+ by W24 (W0–W24 variation: −0.5 [−0.7 to −0.3]) and to 3.8 (3.5–4.1) log10 copies/106 CD4+ by W48 (W24–W48 variation: −0.3 [−0.4 to 0.0]). In the EFV, RAL400, and RAL800 arms, HIV-1 DNA levels decreased by −0.8, −0.9, and −1.0 log10 copies/106 CD4+ T cells over the 48 weeks of the study, reaching 3.9 (3.6–4.2), 3.9 (3.5–4.1), and 3.8 (3.5–4.0) log10 copies/106 CD4+ at W48, respectively (P = .74) (Figure 2). The reduction in HIV-1 DNA was similar in the 3 treatment arms, both in the earlier W0–W24 period (median, −0.6, −0.6, and −0.5 log10 copies/106 CD4+, respectively; P = .47) and in the later W24–W48 period (median, −0.2, −0.4, and −0.3 log10 copies/106 CD4+, respectively; P = .32).
In a linear mixed model, the slope of HIV-1 DNA decay over 48 weeks did not associate with the treatment arm (P = .99) (see
Table: Supplementary Digital Content 1 for statistical results of
covariate-ajusted linear mixed models). The change in HIV-1 DNA levels between W0 and W48 was inversely correlated with W0 HIV-1 RNA viral load (r = −0.42). It did not associate with on-ART HIV-1 RNA at W24 (proportion of participants with HIV-1 RNA <50 copies/mL: 76%, 79%, and 89% in the EFV, RAL400, and RAL800 arms, respectively) or W48 (HIV-1 RNA <50 copies/mL in 90%, 91%, and 85% of participants in the EFV, RAL400, and RAL800 arms, respectively). Human im-munodeficiency virus-1 DNA change between W0 and W48 was correlated with W0 (r = 0.38) and W24 (r = 0.24) CD4+ T-cell counts.
Inflammation and Coagulation Biomarkers Reduction on Antiretroviral Therapy
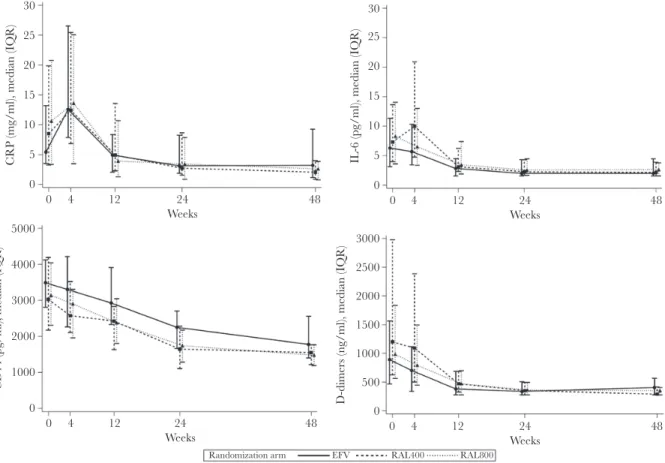
The evolution of W0, W4, W12, W24, and W48 inflamma-tion and coagulainflamma-tion biomarkers levels by treatment arm is shown in Figure 3 (see Table: Supplementary Digital Content 2 for detailed values and ranges). Overall median hsCRP levels first increased by +3.3 mg/L (IQR, −1.3 to +9.4) by W4 before subsiding through W48. This increase was significant in the EFV arm (+6.4 mg/L [IQR, +2.0 to +12.1], within-arm change;
Table 1. Participant Characteristics at W0a
Characteristics EFV n = 50 RAL400 n = 48 RAL800 n = 48 Total n = 146 Individual Characteristics Age (years) 36.5 (29.0–45.0) 36.5 (30.5–45.0) 37.5 (32.5–42.0) 37.0 (30.0–44.0) Gender: male 39 (78.0%) 32 (66.7%) 35 (72.9%) 106 (72.6%) BMI (kg/m2) 21 (19–23) 21 (19–22) 21 (18–23) 21 (19–23) TB Characteristics Pulmonary-only/other 19 (38%)/31 (62%) 23 (48%)/25 (52%) 21 (44%)/27 (56%) 63 (43%)/83 (57%) Bacteriologically confirmed 23 (46%) 26 (54%) 23 (48%) 72 (49%) Virological Characteristics
Duration of TB treatment before W0 (weeks) 5.7 (4.9–7.0) 6.1 (4.9–7.1) 5.7 (5.0–6.7) 5.8 (4.9–7.0)
CD4+ T-cell count/mm3 129 (45–306) 115 (51–209) 170 (80–367) 140 (57–297)
CD4+ T cells <50/mm3 14 (28.0%) 11 (22.9%) 5 (10.4%) 30 (20.5%)
HIV-1 RNA (log10 copies/mL) 5.0 (4.6–5.5) 4.9 (4.4–5.4) 4.9 (4.2–5.4) 4.9 (4.4–5.4)
HIV-1 RNA >5 log10 copies/mL 26 (52.0%) 20 (41.7%) 23 (47.9%) 69 (47.3%)
HBV or HCV coinfection 1 (2.0%) 1 (2.1%) 2 (4.2%) 4 (2.7%)
HIV-1 DNA (log10 copies/10
6 CD4+ T) 4.9 (4.4–5.1) (n = 45) 4.7 (4.2–5.1) (n = 40) 4.6 (4.2–5.0) (n = 41) 4.7 (4.3–5.1) (n = 126) Inflammation Biomarkers CRP (mg/L) 5.4 (3.5–13.3) (n = 48) 8.5 (3.2–19.9) (n = 45) 10.6 (3.3–20.8) (n = 44) 6.9 (3.3–15.6) (n = 137) IL-6 (pg/mL) 6.3 (3.1–11.4) (n = 48) 7.3 (3.9–13.7) (n = 45) 8.3 (3.5–14.1) (n = 43) 7.3 (3.5–12.3) (n = 136) sCD14 (ng/mL) 3490 (2800–4126) (n = 46) 3025 (2163–4203) (n = 41) 3137 (2300–4049) (n = 43) 3221 (2383–4130) (n = 130) D-Dimer (ng/mL) 890 (460–1570) (n = 47) 1200 (620–2980) (n = 45) 985 (555–1840) (n = 44) 975 (535–1970) (n = 136)
Abbreviations: BMI, body mass index; CRP, high sensitivity C-reactive protein; DNA, deoxyribonucleic acid; EFV, efavirenz; HBV, hepatitis B virus; HCV, hepatitis C virus; HIV, human immu-nodeficiency virus; IL-6, interleukin 6; RAL, raltegravir; RNA, ribonucleic acid; sCD14, soluble CD14; TB, tuberculosis; W, week.
aData are n (%) or median (interquartile range).
P < .001) and in the RAL800 arm (+2.1 mg/L [IQR, −1.3 to
+7.9], within-arm change; P = .04). Interleukin-6 levels did not vary significantly from W0 to W4 but decreased after W4 in all arms. Soluble CD14 and D-Dimer levels started decreasing as soon as the W0–W4 period.
All 4 markers were significantly reduced over the study period in the 3 treatment arms. By W48, median hsCRP levels had de-creased to 3.2 (IQR, 1.1–9.3) mg/L, 2.1 (IQR, 0.8–4.0) mg/L, and 2.6 (IQR, 0.7–3.9) mg/L in the EFV, RAL400, and RAL800 arms, respectively (P = .30); IL-6 levels decreased to 2.0 (IQR, 1.5–4.5) pg/mL, 2.1 (IQR, 1.5–3.9) pg/mL, and 2.6 (IQR, 1.5– 3.8) pg/mL, respectively (P = .78); sCD14 levels decreased to 1775 (IQR, 1392–2565) ng/mL, 1549 (IQR, 1204–1775) ng/mL, and 1475 (IQR, 1182–1779) ng/mL, respectively (P = .01, with EFV levels higher than in the RAL arms); and D-Dimer levels decreased to 405 (IQR, 270–570) ng/mL, 290 (IQR, 270–420) ng/mL, and 350 (IQR, 270–410) ng/mL, respectively (P = .26). The mean overall fold-change from W0 to W48 was 0.37 (95% CI, 0.28–0.48) for hsCRP, 0.42 (95% CI, 0.35–0.51) for IL-6, 0.51 (95% CI, 0.47–0.56) for sCD14, and 0.39 (95% CI, 0.32– 0.47) for D-Dimers. By W48, the respective mean fold-change from baseline in the EFV, RAL400, and RAL800 arms was as follows: 0.58 (95% CI, 0.41–0.82), 0.30 (95% CI, 0.17–0.51), and 0.26 (95% CI, 0.16–0.42), respectively, for hsCRP; 0.47 (95% CI, 0.35–0.63), 0.40 (95% CI, 0.28–0.56), and 0.39 (95% CI, 0.27–0.56), respectively, for IL-6; 0.54 (95% CI, 0.46–0.62), 0.52 (95% CI, 0.44–0.60), and 0.48 (95% CI, 0.41–0.56), respectively, for sCD14; and 0.51 (95% CI, 0.37–0.71), 0.30 (95% CI, 0.21– 0.43), and 0.37 (95% CI, 0.26–0.52), respectively, for D-Dimers. Biomarker variations were confirmed by multivariable linear mixed models including random effects on intercept and slope.
Human immunodeficiency virus-1 DNA quantification did not appear to be correlated with inflammation biomarkers levels at W0, W24, or W48 (r values from −0.15 to +0.14). Baseline median HIV-1 DNA levels were 4.8 log10 copies/106 CD4+ (IQR, 4.4–5.1) in the subgroup of participants with an initial increase in hsCRP on ART and 4.8 log10 copies/106 CD4+ (IQR, 4.4–5.1) and 4.9 log10 copies/106 CD4+ (IQR, 4.4–5.1) in those with ≥1
inflammation biomarker in the highest quartile of the distribu-tion by W24 and W48 of ART, similarly to the levels in the total population. The changes in inflammation biomarker levels were not notably correlated with RNA viral load or with CD4+ T-cell counts at W0, W24, or W48 (r values from −0.20 to +0.14) (see
Table: Supplementary Digital Content 3 for detailed values).
Clinically Relevant Events
Six participants (4%) included in the substudy died during fol-low-up. Grade III/IV IRIS were reported in 11 of 146 partici-pants (8%): 5 in the EFV arm, 2 in the RAL400 arm, and 4 in the RAL800 arm. We did not observe an increased risk of mortality (3%) or grade III/IV IRIS (8%) in participants with increased hsCRP levels at W4.
DISCUSSION
Faster viremia control is obtained on INSTI-based regimens compared with nonnucleoside reverse-transcriptase inhibitor regimens. Consequently, INSTI-based ART raised high expec-tations regarding HIV reservoir reduction and immune activa-tion/inflammation recovery, but also concern regarding the risk of IRIS.
Raltegravir may be an option in the context of HIV/TB coinfection with concurrent rifampin administration. The ANRS 12180 REFLATE-TB phase II trial has demonstrated a similar safety and efficacy of RAL 400 mg BID, RAL 800 mg BID, and EFV 600 mg QD based-regimens [3].
In this substudy, we focused on the evolution of HIV-1 DNA and systemic inflammation after ART initiation in randomized participants with HIV and TB. Antiretroviral therapy initiation with EFV, RAL400, or RAL800 consistently decreased blood HIV-1 DNA levels. There were no differences across treatment arms: EFV decreased HIV-1 DNA as effectively as RAL, and the standard dose of RAL was as effective as the double dose. The overall reduction was estimated as −0.9 log10 copies/106 CD4+ T cells over 48 weeks, in accordance with previous studies of HIV-1 reservoir decay on RAL and EFV [15, 16]. In REFLATE-TB participants, changes in HIV-1 DNA levels from W0 to W48 were associated with baseline HIV-1 RNA levels and CD4+ T-cell counts, independently from the ART regimen and from inflammation biomarkers. Indeed, baseline HIV-1 RNA and HIV-1 DNA levels have been widely reported to be correlated and to associate with their decay slope and setpoint on ART [17–19]. Inflammation has also been often reported
0 0 24 Weeks 48 1 2 3 4 5 6 HIV -1 DN A (log10 copies/million CD3+ CD4+), median (IQR)
Randomization arm EFV RAL400 RAL800
Figure 2. Evolution in cell-associated human immunodeficiency virus (HIV)-1
oxyribonucleic acid (DNA) levels, by randomized treatment arm. Results are de-tailed for the 3 antiretroviral therapy arms: efavirenz 600 mg QD (EFV); raltegravir 400 mg BID (RAL400); and raltegravir 800 mg BID (RAL800). Symbols, median CD4+
T-cell associated HIV-1 DNA levels; error bars, interquartile range (IQR).
to drive HIV reservoir persistence through CD4+ T-cell ac-tivation and proliferation [10, 20, 21], but a study by Gandhi et al [7] reported that levels of cell-associated HIV-1 DNA and RNA depend on pre-ART levels, independently from persistent on-ART inflammation.
The impact of INSTI-based regimens on the viral reservoir size has been investigated mostly in ART switch and intensi-fication trials so far, with conflicting results regarding HIV-1 DNA levels that were either unchanged or decreased [22–27]. Little data are available regarding the evolution of the viral res-ervoir after ART initiation with INSTI. In an observational nonrandomized study of 8 chronically infected participants initiating RAL, HIV-1 DNA levels decreased by −0.61 log10 copies/106 CD4+ over 1 year [15]. The overall reduction in HIV-1 DNA levels was greater in our study, possibly because we included a larger number of participants (81 vs 8) with ad-vanced HIV disease and low CD4+ T-cell counts and where baseline HIV-1 DNA levels were higher than in the study by Koelsch et al [15].
We also studied the plasma levels of 4 major inflammation and coagulation biomarkers, known to associate with mortality rates in people with HIV: hsCRP, IL-6, sCD14, and D-Dimers
[28–32]. At W0, all 4 markers were increased to 2- to 4-fold
higher levels than is commonly observed in ART-naive people chronically infected with HIV-1 but without TB [33, 34]. We followed the evolution of these markers over 48 weeks after ART initiation. All biomarker levels decreased in all arms, and there were no major differences in the dynamics or amplitude of the reduction according to the ART regimen. Despite this con-sistent reduction, the levels of inflammation biomarkers at W48 of ART were still higher than those described in ART-treated patients without TB; in fact, they were closer to the numbers generally observed before ART initiation [33, 34].
High levels of systemic inflammation are expected during TB [8, 35, 36] and were likely to account for the higher biomarker levels we observed at W0 compared with TB-free people with HIV. This might also participate in the lack of direct correla-tion between inflammacorrela-tion levels and HIV-1 RNA reduccorrela-tion on ART in this study. The impact of INSTI-based ART initia-tion on systemic inflammainitia-tion has been reported in a number of studies in TB-free participants: ART initiation with RAL decreased IL-6 and D-Dimer levels in a single-arm study [37] and led to a greater reduction in hsCRP and IL-6 levels than protease inhibitor-based regimens did in a comparative trial [33]. Elvitegravir reduced sCD14 and hsCRP levels more than EFV [34]. In the current study, all 4 biomarkers decreased
0 5 10 15 20 25 30 CRP (mg/ml), median (IQR) 0 4 12 24 Weeks 48 0 1000 2000 3000 4000 5000 CD14 (pg/ml), median (IQR) 0 4 12 24 Weeks 48 0 1000 2000 2500 500 1500 3000
D-dimers (ng/ml), median (IQR)
0 4 12 24 Weeks 48 0 5 10 15 20 25 30
IL-6 (pg/ml), median (IQR)
0 4 12 24
Weeks
48
Randomization arm EFV RAL400 RAL800
Figure 3. Evolution in inflammation marker levels, by randomized treatment arm. Inflammation biomarker levels are shown for the week (W)0–W48 study period. Efavirenz
600 mg QD (EFV); raltegravir 400 mg BID (RAL400); and raltegravir 800 mg BID (RAL800). Symbols, median plasma levels; error bars, interquartile range (IQR). CRP, C-reactive protein.
significantly over 48 weeks, and we did not observe a difference between 2 doses of RAL or EFV. Baseline inflammation levels were high in REFLATE-TB participants, and the combination of TB treatment and ART initiation was presumably favorable to a marked decline in systemic inflammation. In a longer fol-low-up period, we may have been able to uncover a difference in biomarker setpoints. Nevertheless, in coinfected patients with such high baseline values, a longer period on ART with optimal adherence is probably necessary to further decrease residual in-flammation, which associates with long-term mortality in HIV infection [28–32]. Long-term clinical and biological moni-toring of these vulnerable patients is warranted.
Given the fast virological response elicited by INSTI-based ART regimens, their impact on IRIS rates must be carefully documented. In this substudy of REFLATE-TB, severe IRIS (n = 11 total) was not more frequent in participants ran-domized to the RAL arms, but numbers are limited. Despite alarming first reports in retrospective observational studies [12,
13], RAL intensification and dolutegravir initiation were indeed found not to increase the frequency of TB-IRIS in large pro-spective randomized trials [38–40]. In REFLATE-TB partici-pants, hsCRP levels increased at W4 after ART initiation in the EFV and RAL800 arms. Early immune reconstitution on ART may be one explanation for this observation. However, the early increase in hsCRP was not associated with clinical outcomes such as grade III/IV IRIS, death, or TB treatment failure, nor were levels of inflammation biomarkers in the highest quar-tile of the distribution, perhaps because the numbers of clinical events were limited.
Preliminary results were recently presented at the IAS 2019 conference regarding the phase III ANRS 12-300 REFLATE-TB-2 trial of RAL 400 mg BID versus EFV in par-ticipants with HIV-1 and TB from 5 countries [41]. In con-trast with the results of ANRS 12-180 where we designed this substudy, RAL was not noninferior to EFV in the ANRS 12-300 trial, with lower rates of virological suppression in all treatment arms. We cannot apply our results to ANRS 12-300 directly, but it can be expected that the viral DNA and inflammation decay may be similar across treatment arms in virologically sup-pressed participants.
This study has some limitations: first, TB treatment and ART were successful in the majority of participants, and the limited number of major clinical events might hinder the statistical analysis of clinical outcomes. Despite the randomized nature of the study, inflammatory markers may be impacted by a variety of daily life stimuli, and baseline HIV-1 DNA and RNA levels may have impacted the virological outcomes, because they are reported to associate with the time to viral suppression and with their own persistent levels on ART [17–19]. The role of residual viremia could not be assessed. In addition, sample availability prevented a more detailed analysis of the HIV-1 DNA decay kinetics, which may differ across treatment arms between W0
and W24, although all regimens led to a similar HIV-1 DNA reduction by W24. Sample availability also limited the number of reservoir markers tested.
CONCLUSIONS
In conclusion, this randomized study of EFV or RAL initiation in HIV-1/TB coinfection found a similar efficacy of EFV, RAL, and a double dose of RAL in reducing HIV-1 DNA burden in CD4+ T-cells as well as in decreasing systemic inflammation over 48 weeks. Doubling the dose of RAL did not appear bene-ficial in regard to these 2 parameters. In the context of TB treat-ment, RAL and EFV had similar effects on reservoir reduction and inflammation biomarkers.
Supplementary Data
Supplementary materials are available at Open Forum Infectious Diseases online. Consisting of data provided by the authors to benefit the reader, the posted materials are not copyedited and are the sole responsibility of the authors, so questions or comments should be addressed to the corre-sponding author.
Table: Supplementary digital Content 1. Statistical results of
covariate-adjusted linear mixed models covariate-adjusted on sex and age.
Table: Supplementary digital Content 2. Inflammation marker levels and
evolution, by randomized treatment arm.
Table: Supplementary digital Content 3. Spearman rank correlations
be-tween participant characteristics and inflammation change and bebe-tween bi-omarker levels, from W0 to W48.
Acknowledgments
We thank Audrey Gabassi and the technicians of the Diagnostic Biologique Automatisé laboratory (Hôpital Saint-Louis, Paris) for their con-tribution to this work.
Author contributions. C. D., J.-M. M., N. D. C., and B. G. designed the study; J. H. P., C. Br., N. T. B., B. G., N. D. C., and J.-M. M. provided medical care to the participants and collected clinical and biological data; H. M. D., M. C., I. K., F. J., and S. M. performed experiments; H. M. D., C. D., A. A., C. Ba., and L. W. lyzed the results and made the figures; C. B. and L. W. performed statistical ana-lyses; H. M. D., C. Ba., and C. D. drafted the initial version of the paper. All authors revised the manuscript and approved the final version.
Financial support. This work was funded by the French National Agency for Research on AIDS and Viral Hepatitis (ANRS), the Brazilian National STD/AIDS Program of the Ministry of Health, and MERCK (Investigator Initiated Studies Program; IISP 50621).
Potential conflicts of interest. All authors: No reported conflicts of in-terest. All authors have submitted the ICMJE Form for Disclosure of Potential Conflicts of Interest.
References
1. Wenning LA, Hanley WD, Brainard DM, et al. Effect of rifampin, a potent in-ducer of drug-metabolizing enzymes, on the pharmacokinetics of raltegravir. Antimicrob Agents Chemother 2009; 53:2852–6.
2. Reynolds HE, Chrdle A, Egan D, et al. Effect of intermittent rifampicin on the pharmacokinetics and safety of raltegravir. J Antimicrob Chemother 2015; 70:550–4.
3. Grinsztejn B, De Castro N, Arnold V, et al.; ANRS 12 180 Reflate TB study group. Raltegravir for the treatment of patients co-infected with HIV and tuberculosis (ANRS 12 180 Reflate TB): a multicentre, phase 2, non-comparative, open-label, randomised trial. Lancet Infect Dis 2014; 14:459–67.
4. Taburet AM, Sauvageon H, Grinsztejn B, et al. Pharmacokinetics of raltegravir in HIV-infected patients on rifampicin-based antitubercular therapy. Clin Infect Dis
2015; 61:1328–35.
5. Achhra AC, Phillips A, Emery S, et al.; International Network for Strategic Initiatives in Global HIV Trials (INSIGHT) Strategic Management of
Antiretroviral Therapy (SMART) and Flexible Initial Retrovirus Suppressive Therapies (FIRST) study groups. Pre-therapy inflammation and coagulation ac-tivation and long-term CD4 count responses to the initiation of antiretroviral therapy. HIV Med 2015; 16:449–54.
6. Ghislain M, Bastard JP, Meyer L, et al.; ANRS-COPANA Cohort Study Group. Late antiretroviral therapy (ART) initiation is associated with long-term persistence of sys-temic inflammation and metabolic abnormalities. PLoS One 2015; 10:e0144317. 7. Gandhi RT, McMahon DK, Bosch RJ, et al.; ACTG A5321 Team. Levels of HIV-1
persistence on antiretroviral therapy are not associated with markers of inflam-mation or activation. PLoS Pathog 2017; 13:e1006285.
8. Olsson O, Björkman P, Jansson M, et al. Plasma profiles of inflammatory markers associated with active tuberculosis in antiretroviral therapy-naive human immu-nodeficiency virus-positive individuals. Open Forum Infect Dis 2019; 6:ofz015. 9. Avettand-Fènoël V, Hocqueloux L, Ghosn J, et al. Total HIV-1 DNA, a marker of viral
reservoir dynamics with clinical implications. Clin Microbiol Rev 2016; 29:859–80. 10. Chomont N, El-Far M, Ancuta P, et al. HIV reservoir size and persistence
are driven by T cell survival and homeostatic proliferation. Nat Med 2009; 15:893–900.
11. Manosuthi W, Wiboonchutikul S, Sungkanuparph S. Integrated therapy for HIV and tuberculosis. AIDS Res Ther 2016; 13:22.
12. Wijting I, Rokx C, Wit F, et al. Integrase inhibitors are an independent risk factor for iris: an athena cohort study | CROI Conference. Available at: http://www. croiconference.org/sessions/integrase-inhibitors-are-independent-risk-factor-iris-athena-cohort-study. 2017. Accessed 6 June 2018.
13. Dutertre M, Cuzin L, Puglièse P, et al. Initiation of art based on integrase in-hibitors increases the risk of iris | CROI Conference. Available at: http://www. croiconference.org/sessions/initiation-art-based-integrase-inhibitors-increases-risk-iris. 2017. Accessed 6 June 2018.
14. Avettand-Fènoël V, Chaix ML, Blanche S, et al.; French Pediatric Cohort Study ANRS-CO 01 Group. LTR real-time PCR for HIV-1 DNA quantitation in blood cells for early diagnosis in infants born to seropositive mothers treated in HAART area (ANRS CO 01). J Med Virol 2009; 81:217–23.
15. Koelsch KK, Boesecke C, McBride K, et al.; PINT study team. Impact of treatment with raltegravir during primary or chronic HIV infection on RNA decay charac-teristics and the HIV viral reservoir. AIDS 2011; 25:2069–78.
16. Besson GJ, Lalama CM, Bosch RJ, et al. HIV-1 DNA decay dynamics in blood during more than a decade of suppressive antiretroviral therapy. Clin Infect Dis
2014; 59:1312–21.
17. Parisi SG, Andreis S, Mengoli C, et al. Baseline cellular HIV DNA load predicts HIV DNA decline and residual HIV plasma levels during effective antiretroviral therapy. J Clin Microbiol 2012; 50:258–63.
18. Uprety P, Chadwick EG, Rainwater-Lovett K, et al. Cell-associated HIV-1 DNA and RNA decay dynamics during early combination antiretroviral therapy in HIV-1-infected infants. Clin Infect Dis 2015; 61:1862–70.
19. Alteri C, Scutari R, Stingone C, et al. Quantification of HIV-DNA and residual viremia in patients starting ART by droplet digital PCR: their dynamic decay and correlations with immunological parameters and virological success. J Clin Virol
2019; 117:61–7.
20. Massanella M, Fromentin R, Chomont N. Residual inflammation and viral reser-voirs: alliance against an HIV cure. Curr Opin HIV AIDS 2016; 11:234–41. 21. Khoury G, Fromentin R, Solomon A, et al. Human immunodeficiency virus
per-sistence and T-cell activation in blood, rectal, and lymph node tissue in human immunodeficiency virus-infected individuals receiving suppressive antiretroviral therapy. J Infect Dis 2017; 215:911–9.
22. Buzón MJ, Massanella M, Llibre JM, et al. HIV-1 replication and immune dy-namics are affected by raltegravir intensification of HAART-suppressed subjects. Nat Med 2010; 16:460–5.
23. Delaugerre C, Charreau I, Braun J, et al.; ANRS 138 study group. Time course of total HIV-1 DNA and 2-long-terminal repeat circles in patients with controlled
plasma viremia switching to a raltegravir-containing regimen. AIDS 2010; 24:2391–5.
24. Lam YM, McBride KL, Amin J, et al. Switching virally suppressed, treatment-experienced patients to a raltegravir-containing regimen does not alter levels of HIV-1 DNA. PLoS One 2012; 7:e31990.
25. Hatano H, Strain MC, Scherzer R, et al. Increase in 2-long terminal repeat cir-cles and decrease in D-dimer after raltegravir intensification in patients with treated HIV infection: a randomized, placebo-controlled trial. J Infect Dis 2013; 208:1436–42.
26. Vallejo A, Gutierrez C, Hernandez-Novoa B, et al. The effect of intensification with raltegravir on the HIV-1 reservoir of latently infected memory CD4 T cells in suppressed patients. AIDS 2012; 26:1885–94.
27. Rossetti B, Meini G, Bianco C, et al. Total cellular HIV-1 DNA decreases after switching to raltegravir-based regimens in patients with suppressed HIV-1 RNA. J Clin Virol 2017; 91:18–24.
28. Kuller LH, Tracy R, Belloso W, et al.; INSIGHT SMART Study Group. Inflammatory and coagulation biomarkers and mortality in patients with HIV infection. PLoS Med 2008; 5:e203.
29. Wada NI, Bream JH, Martínez-Maza O, et al. Inflammatory biomarkers and mor-tality risk among HIV-suppressed men: a multisite prospective cohort study. Clin Infect Dis 2016; 63:984–90.
30. Hunt PW, Sinclair E, Rodriguez B, et al. Gut epithelial barrier dysfunction and innate immune activation predict mortality in treated HIV infection. J Infect Dis
2014; 210:1228–38.
31. Lee S, Byakwaga H, Boum Y, et al. Immunologic pathways that predict mortality in HIV-infected Ugandans initiating antiretroviral therapy. J Infect Dis 2017; 215:1270–4.
32. Baker JV, Sharma S, Grund B, et al.; INSIGHT START (Strategic Timing of AntiRetroviral Treatment) Study Group. Systemic inflammation, coagu-lation, and clinical risk in the START Trial. Open Forum Infect Dis 2017; 4:ofx262.
33. Kelesidis T, Tran TT, Stein JH, et al. Changes in inflammation and immune ac-tivation with atazanavir-, raltegravir-, darunavir-based initial antiviral therapy: ACTG 5260s. Clin Infect Dis 2015; 61:651–60.
34. Hileman CO, Kinley B, Scharen-Guivel V, et al. Differential reduction in mon-ocyte activation and vascular inflammation with integrase inhibitor-based ini-tial antiretroviral therapy among HIV-infected individuals. J Infect Dis 2015; 212:345–54.
35. Sasindran SJ, Torrelles JB. Mycobacterium tuberculosis infection and inflamma-tion: what is beneficial for the host and for the bacterium? Front Microbiol 2011; 2:2.
36. Sullivan ZA, Wong EB, Ndung’u T, et al. Latent and active tuberculosis infection increase immune activation in individuals co-infected with HIV. EBioMedicine
2015; 2:334–40.
37. Funderburg NT, Andrade A, Chan ES, et al. Dynamics of immune recon-stitution and activation markers in HIV+ treatment-naïve patients treated with raltegravir, tenofovir disoproxil fumarate and emtricitabine. PLoS One 2013; 8:e83514.
38. Dooley KE, Kaplan R, Mwelase T, et al. Inspiring: safety and efficacy of dolutegravir-based art in TB/HIV coinfected adults at week 48. AIDS Conference 2018 (Amsterdam, Netherlands).
39. Gibb D, Szubert A, Chidziva E, et al. Impact of raltegravir intensification of first-line art on IRIS in the reality trial. CROI 2018 (Boston, MA).
40. Lelievre JD, Assoumou L, Aznar E, et al. Are integrase inhibitors a risk factor for iris in the ANRS 146 optimal trial? CROI Conference 2018 (Boston, MA). 41. De Castro N, Marcy O, Chazallon C, et al. Virologic efficacy of raltegravir vs.
efavirenz-based antiretroviral treatment in HIV1-infected adults with tubercu-losis: W48 results of the ANRS 12300 Reflate TB2 trial. [MOAB0101]. IAS 2019 (Mexico). July 21, 2019.