Taste
–Odor Integration in Espresso Coffee
Ariya Chiralertpong&Terry E. Acree&John Barnard&Karl J. Siebert
Received: 4 February 2008 / Accepted: 7 April 2008 / Published online: 6 May 2008 # 2008 Springer Science + Business Media, LLC
Abstract Espresso coffee samples were freshly prepared with 10% sucrose, 0.0143% sucralose (equivalent in sweetness to 10% sucrose), or unsweetened, each with and without nondairy creamer. A sensory panel rated the intensities of “malty,” “caramel,” “roasty,” and “coffee-like.” The concentrations of flavor chemicals associated with the latter three sensations (Furaneol, 2-ethyl-3,5-dimethyl [EDM] pyrazine, and 2-furfuryl thiol, respectively) were determined by gas chromatography, using solid-phase microextraction sampling of coffee headspace. Furaneol and furfuryl thiol were essentially unaffected by creamer addition, but the more nonpolar EDM pyrazine was greatly reduced. The malty, caramel, roasty, and coffee-like flavor intensities were not significantly affected by creamer addition. This appears to be a case of disconnect between the absence of an odorant and perception. Furaneol, furfuryl thiol, and EDM pyrazine concentrations were unaffected by adding either sweetener. The malty sensation was the same with and without added sweetener. The roasty and coffee-like ratings both decreased to similar extents in the samples with the two added sweeteners. The ratings for caramel were considerably increased, again to a similar extent, by both sweeteners. Since the added sweeteners were both nonvolatile, this is clearly a case where taste affected odor perception.
Keywords Chemosensory . Integration . Odor . Taste . Synesthesia
Introduction
Flavor is a multistimulus perception that involves several senses modulated by a number of brain states: memory, emotion, cognition, etc. Flavor sensations have intensities ranging from subliminal to unbearably strong and qualita-tive features such as the “greenness” of 2-methoxy pyrazines or the “sweetness” of sucrose. These qualitative features have been called qualia (singular quale) for over a century by philosophers (Lewis1929) and more recently by neurobiologists studying consciousness (Koch 2004) and chemists studying flavor (Acree et al. 2007). The briefest component of a flavor experience is a sensory quale. It is a unitary component percept, created in the mind in response to stimuli acting on sensory receptors. Several elemental qualia are integrated into the phenomenon of flavor.
Multiple qualia from separate modalities, e.g., taste and smell, can enhance or suppress each other, but the process of experiencing an increase in a taste quale (e.g., sweetness) when certain compounds are smelled (e.g., ethyl methyl-phenylglycidate“synthetic strawberry odor”) is called odor– taste synesthesia (Stevenson and Boakes 1998, 2004). During the descriptive analysis of ethyl methylphenylgly-cidate by 140 subjects (Dravnieks1985), only 42 subjects used “strawberry” while 91 used “sweet” to describe its aroma. Whether the subjects actually experience sweet taste is difficult to prove and provides fodder for some philosophical disagreements (Dennett 1988; De Leon
2001). In psychophysical experiments when subjects have been trained to associate language with standard odor-ants, a consistent increase in taste intensity simultaneous with the perception of specific odorants has been demonstrated (Stevenson et al.1995; Stevenson and Boakes
1998; Stevenson et al. 1999; Stevenson and Boakes2004; Stevenson et al.2005). This work supports the proposition A. Chiralertpong
:
T. E. Acree:
J. Barnard:
K. J. Siebert (*)Department of Food Science and Technology, Cornell University, Geneva, NY 14456-0462, USA
that synesthesia is an integral part of the processing of sensory information rather than a rare, abnormal, or even pathological brain state (Prescott2004).
In the experiments reported here, the effects of the taste quale “sweetness” on the intensity of several odor qualia were investigated in a real world system, espresso coffee. Using a globally available espresso machine and coffee beans, an experimental system easily reproducible in other laboratories was developed. Descriptive analysis was used to assess odor qualia in sweetened and unsweetened espresso coffee. Two different sweeteners, the high-potency sweetener sucralose and the common sweetener sucrose, were used to distinguish the difference between the effects of the sweeteners on volatility and the more central effect of quale–quale interactions. Since many coffee drinkers use creamer, it was also included in the study. Chemical analysis was used to test for changes in volatility of key odorants.
Materials and Methods
Chemicals 2-Furfuryl thiol, 2-ethyl-3,5-dimethylpyrazine, Furaneol® (2,5-dimethyl-4-hydroxy-3(2H)-furanone), 3-methylbutanal, guaiacol, β-damascenone, and 2,3-butane-dione were purchased from Sigma-Aldrich (St. Louis, MO, USA). Sucralose was a gift from Tate & Lyle® (Decatur, IL, USA).
Sample Preparation Dannon® Spring Water (Danone Waters of North America, California, USA) and Medium Roasted Arabica Coffee Beans (Illy® Caffè North America, Scottsdale, AZ, USA) were used to prepare espresso coffee with a Saeco® Royal automatic espresso machine (Saeco® International Group, Italy). The grind was set to level“4,” which corresponds to medium ground coffee, and 7.0 g of beans was used for an approximately 47-mL cup. Each aliquot from the espresso machine was split into two 23.5-mL portions, and one portion constituted one sample. Nestlé CoffeeMate® (Nestlé Beverage, California, USA), 2.45 g, 25% fat content, was used for the creamer-added samples, resulting in a final volume of 24.5 mL. For the sweetened samples, the sweetener used was either sucrose (Domino® granulated sugar, Domino Foods, New York, USA) or sucralose.
Sensory Evaluation Sensory tests were conducted in isola-tion booths under moderate fluorescent lighting in a well-ventilated room designed for sensory testing. Subjects were from the Food Science and Technology Department at the New York Agricultural Experiment Station, Geneva, NY, USA. Unsalted crackers and rinse water were provided for the judges during the evaluation period.
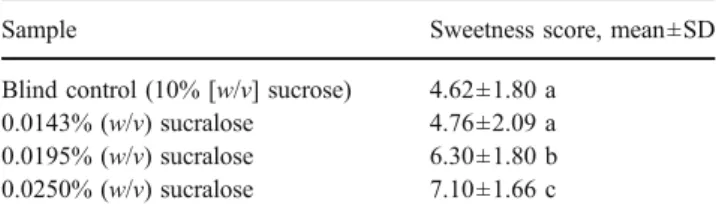
Sensory Test for Iso-sweetness To find the sucralose concentration that provided sweetness intensity comparable to that of 10% sucrose (iso-sweet), a sensory test format was adapted from the difference-from-control (Meilgaard et al. 1999) and the relative-to-reference tests (Stoer and Lawless1993). The sensory panel had 27 members, 17 men and 10 women; all liked coffee and drank it occasionally, and their average age was 37. They reported they were generally healthy, had normal senses of taste and smell, and no history of medical problems with coffee, sugar, or any other sweetener. Three levels of sucralose (0.0143%, 0.0196%, and 0.025% [w/v]) in espresso coffee were compared with a 10% (w/v) sucrose control. Five espresso coffee samples were served in 4-oz paper hot cups. The first sample was a labeled 10% sucrose control. The other four consisted of the three sucralose-added samples plus one blind control; these were labeled with random three-digit codes and were presented in random order across sessions and subjects. Subjects were asked to taste the control sample first and then to evaluate the size and direction of the difference between each sample and the control, which was assigned a value of “5” on a nine-point scale. Since most, if not all, psychometric tests suffer scaling bias, the use of a blind control removed the scale from the determination of iso-sweetness. The test was carried out three times, each on a different day.
Sensory Descriptive Analysis Eleven subjects, six men and five women, with an average age of 33, participated in this study. Subjects reported that they had no dentures, diabetes, oral or gum disease, hypoglycemia, food allergies, or hypertension and that they took no medications that affected their senses of taste or smell. Training sessions were conducted with reference odorants (see “Training”) and preliminary sensory descriptive analysis (SDA) tests adapted from quantitative descriptive analysis (Lawless and Heymann 1998) were carried out prior to the coffee evaluations to evaluate individual performance and general trends. Two subjects were removed from the panel because their responses were too noisy, and two new subjects were trained for the SDA session, providing the minimum 10–12 judges recommended for quantitative descriptive analysis (Lawless and Heymann1998).
Training Subjects were introduced to four aroma com-pounds orthonasally that were the focus of this study: 2-furfuryl thiol (coffee-like), 2-ethyl-3,5-dimethylpyrazine (roasty), Furaneol® (caramel-like), and 3-methylbutanal (malty). Experiencing single odorants should produce the same quale whether ortho- or retronasally administered, although this would not be true of mixtures. These samples were prepared by dipping filter paper strips into solutions of the compounds and then placing a strip in a screw cap vial.
Subjects were each provided with a set of labeled aroma standards for individual familiarization and self-training. After 3 days, subjects were presented with seven samples labeled with three-digit codes in random order. Four of these contained the target compounds, while the other three were other compounds that have been identified in coffee: guaiacol (medicinal), β-damascenone (fruity), and 2,3-butanedione (buttery). Subjects were asked to match each target aroma descriptor with one of the seven samples, or mark“other” if they did not think the sample matched any target descriptor. Each subject was subjected to at least three matching tests, depending on how well he or she did on the previous test. If the subject could not match the four target aromas correctly on three consecutive matching tests, he or she was required to return for another test until at least three consecutive correct records were produced. Subjects were required to wait at least 2 h before attempting another matching test. In later testing, the reference standard for the “malty” character was changed from 3-methylbutanal to actual ground malt. The self-training and matching test were repeated with the new “malty” reference before continuing.
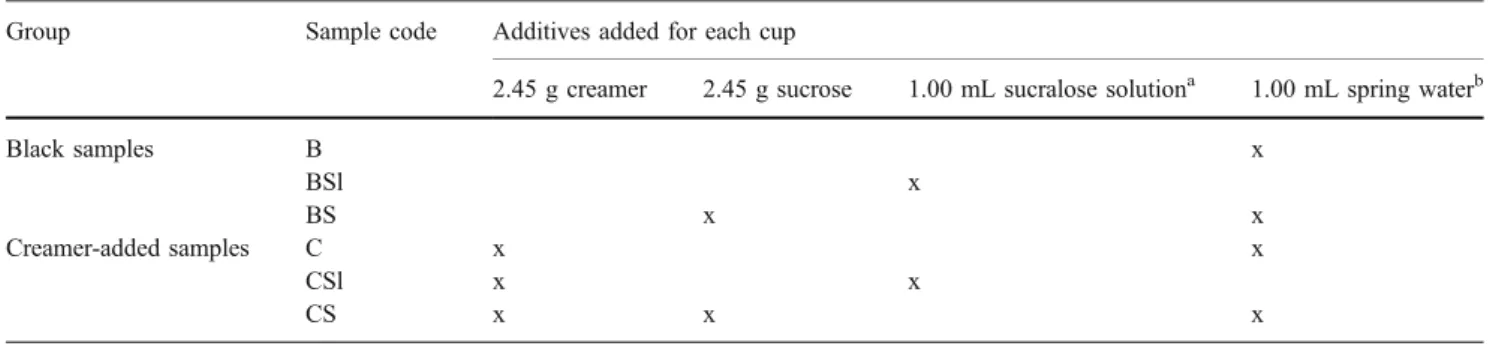
SDA of Espresso Treatments Six coffee samples with different combinations of additives were presented to each subject (see Table1). To avoid bias from sample appear-ance, the samples were divided into two groups, the black coffee group and the creamer-added coffee group. The black coffee group contained the three samples that did not have added coffee creamer. The study was carried out in triplicate over six sessions, with three sessions for each sample group. Each sample was prepared immediately prior to serving by dispensing from the espresso machine into a 3-oz white ceramic coffee cup labeled with a three-digit code and containing the appropriate additives (water blank or additive[s] in water). The cup was immediately covered with a watch glass, which remained in place until a subject removed it to taste the sample. The samples were served one cup at a time in random order across sessions and
subjects. Subjects were asked to drink the coffee and then rate each sample for the perceived intensity of each of the four target aromas on 15-cm line scales anchored with“not detectible” on the left and “extremely strong” on the right. Then, the subjects returned the cup with any remaining coffee and, to reduce lingering taste and odor, ate some crackers and rinsed with water before the next sample was served. Electronic ballots were used to collect the data. The ballots were created using the program FileMaker Pro 7® (FileMaker, California, USA). Subjects were asked to wait at least 2 h before participating in the next tasting session to avoid fatigue.
Sample Headspace Analysis
Sample Preparation The six coffee samples were prepared in the same way as for the descriptive analysis (see Table1).
Analysis of 2-Furfurylthiol and 2-Ethyl-3,5-Dimethylpyrazine A 6-mL portion of each coffee sample was placed in a 15-mL vial and was immediately sealed with a crimped-on, Teflon-faced silicone rubber serum cap (Supelco, Belle-fonte, Pennsylvania, USA). Each vial was equilibrated at 50 °C for 30.0 min in the temperature-controlled autosam-pler carousel of a model CP-8200 SPME mode autosamautosam-pler (Varian, Palo Alto, CA, USA). A 50/30μm divinylbenzene/ carboxen on polydimethyl siloxane fiber (Supelco) was then exposed in the vial headspace for 1.0 min.
Analysis of Furaneol® The same procedure as for 2-furfurylthiol and 2-ethyl-3,5-dimethylpyrazine was used except that the SPME fiber coating was polyacrylate (Supelco) and the extraction time in the headspace was 30.0 min instead of 1.0 min.
Gas Chromatography Parameters After exposure in the vial headspace, the fiber was retracted into its housing and
Table 1 Six coffee samples and their coffee additive combinations
Group Sample code Additives added for each cup
2.45 g creamer 2.45 g sucrose 1.00 mL sucralose solutiona 1.00 mL spring waterb
Black samples B x BSl x BS x x Creamer-added samples C x x CSl x x CS x x x
aThe sucralose solution concentration was 0.35%(w/v). b
was then inserted into the gas chromatograph (GC) inlet port, which was held at 250 °C. The fiber was exposed 5.0 min for desorption. The purge valve was opened during the last 2 min of desorption. The column oven initial temperature was 35 °C; this was maintained for 5.0 min and then programmed to 250 °C at the rate of 6 °C/min. The carrier gas was helium. The GC was a Hewlett Packard model 5890 series II instrument equipped with a flame ionization detector (FID). The column was 30-m, 0.25-mm inner diameter fused silica, coated with a 0.5-μm film of methylsilicone (DB-5; Agilent). All samples were analyzed in triplicate.
Identification Chromatographic peaks were identified by comparison with the retention of authentic standards and confirmed with an Agilent GC equipped with an Agilent 5973 Quadrupole mass-selective detector.
Quantification External standards prepared in Dannon spring water containing 0.2% (v/v) ethanol and adjusted to pH 5.4 (the pH of the Espresso coffee) were used to calibrate the GC-FID procedure. The concentration ranges used for each compound spanned the range found in the coffee samples. Peak areas were integrated using the Agilent ChemStation program (Rev A.09.03). Results were averages of at least three replicate determinations of each standard concentration used. If the coefficient of variation (CV) was greater than 15%, additional replicates were analyzed until the CVs were less than or equal to 15%.
Results and Discussion
Difference Test
A sensory difference test was carried out to find the sucralose concentration that provided sweetness intensity comparable to that of 10% sucrose in the espresso coffee. The results are shown in Table 2. The lowest sucralose
concentration used (0.0143%) produced a sweetness inten-sity closest to and not significantly different from 10% sucrose. This is a 700-fold concentration ratio for equally sweet sucrose and sucralose.
The Effect of Whitener on Coffee Aroma
Figure 1 shows the liquid-phase concentrations of key coffee odorants equivalent to those measured in the headspace above black and whitened coffee. As expected, the nonpolar pyrazine was much less volatile in whitened than in black coffee, while the extremely polar compounds were unaffected by the lipophilic whitener. Changes in the relative volatility of odorants when lipids are added to an aqueous matrix occur because lipophilic odorants such as 2-ethyl-3,5-dimethylpyrazine (log P=1.96, where P is the octanol–water partition coefficient) are extremely soluble and less volatile in the lipid phase, while less lipophilic compounds like 2-furfurylthiol (log P=0.9) or the extreme-ly nonlipophilic compound Furaneol® (log P=−1.69) become more volatile in the presence of lipids. This differential effect on volatility can distort odor perception if the magnitude is significant. However, as shown in Fig. 2, none of the qualia were affected by the addition of whitener (p=0.05). The“malty” and “caramel” qualia were the weakest while the“roasty” and “coffee” notes were the most intense. Greater changes upon the addition of creamer have been reported in brewed coffee (Bücking and Steinhart 2002; Calvino et al. 1990). Perhaps the higher lipid content of espresso minimizes the effects of added lipid. These results are like those of Maeztu et al. (2001), which found no correlation between the “malty” character and the concentrations of Strecker aldehydes that are thought to be malty aroma contributors. In this study, the whitener had a significant effect on relative odorant volatility but no effect on perception.
Table 2 Mean scores for sweetness intensity of the blind control and coffee with several levels of added sucralose
Sample Sweetness score, mean±SD
Blind control (10% [w/v] sucrose) 4.62±1.80 a 0.0143% (w/v) sucralose 4.76±2.09 a 0.0195% (w/v) sucralose 6.30±1.80 b 0.0250% (w/v) sucralose 7.10±1.66 c
All pairwise comparisons were made by Tukey’s test at the 95% confidence level. Means with the same letter were not significantly different.
Furaneol EDM-Pyrazine Furfuryl-SH
0 500 1000 1500 ng/mL (aqueous equilivant) Creamer Black
}
Fig. 1 The concentrations in nanograms per milliliter liquid-phase equivalent of the key coffee odorants in the headspace above black and whitened coffee (mean ±standard errors)
The Effects of Sweeteners on Coffee Aroma
Figure 3 shows the concentrations in nanograms per milliliter (liquid phase equivalent) of the key coffee odor-ants in the headspace above unsweetened, sweetened with sucrose, and sweetened with sucralose coffees (mean± standard errors). It is striking how completely unaffected the concentrations of the most potent odorants in coffee headspace were by any of the treatments. Although there may be a slight reduction in the apparent volatility of 2-ethyl-3,5-dimethylpyrazine in the coffee sweetened with sucrose, there was no significant difference (at the 95% level) between the sucrose and sucralose samples. Ebeler (2001) stated that compound volatility would only be affected when sucrose concentration is above 20% (w/w). This implies that at the olfactory receptor, the concen-trations of the key odorants released from espresso coffee are unaffected by the presence of different sweeteners, even though sucrose is 700 times more concentrated than sucralose. A previous report predicted that the retention of hydrophobic compounds should be greater due to an increase in hydrophobicity of the matrix after sucrose is added (de Roos and Wolswinkel 1993). The current study does not support this idea even for Furaneol® (log P= −1.69), one of the most hydrophilic compounds found in foods. Therefore, any changes in odor due to the presence of sweeteners must be the result of top-down processing (the modulation of responses initiated at the periphery by signals from more central areas of the brain, Wilson and Stevenson2006) and not due to modulation of the chemical processes at the periphery.
Figure 4 shows the effects of sweetener on the four coffee attributes or qualia. It is assumed that, as a result of training, these qualia change only in intensity and not in their nature, but we have no way to verify this experimen-tally. There were no significant changes in the “malty”
qualia caused by either sweetener, while significant increases (>100%) in the “caramel” note were caused by the presence of either sweetener. The magnitude of the effect was the same for both sucrose and sucralose even though their concentrations were 700-fold different. That these two sweeteners had the same sweetness intensity indicates that the enhanced caramel intensity was caused by a top-down process from a place in the brain remote from the periphery. In contrast, the “coffee-like” and “roasty” notes were significantly (p=0.05) reduced by the presence of both sweeteners to similar extents. This again supports the notion that the effects are central and not peripheral. It is possible that some of these shifts in relative perceptual intensity are the result of“dumping,” the process in which an attribute appears to change in nature due to ballot restrictions (Lawless and Heymann 1998). Dumping has only been observed with naïve consumer panels (Clark and Lawless 1994); untrained subjects tend to colocalize taste and smell and lack the ability to parse their perceptions.
Fig. 2 Intensity scores for each sensory attribute (mean± standard errors)
Fig. 3 The concentrations of the key odorants (mean± standard errors) above the coffee treatments as described in Fig.1
Fig. 4 Intensity scores for each sensory attribute (means ± standard errors)
This effect has been shown to diminish with training (Bingham et al.1990).
Prescott reported that flavor perception is highly depen-dent on both past experience with specific odor–taste combinations (the origin of congruence) and on cognitive factors that influence whether or not the flavor elements are combined. In their studies, subjects reported that they tended to associate“roasty” character with barbeque sauce, which is often sweet. Thus, it is possible that the“roasty” character may be associated with “sweetness” for some people, and the relevant example is the usual co-occurrence of the two characters in barbeque sauce. Once more, this might be a result of the interaction between smell and taste (Blake2004). This phenomenon is not uncommon, as prior studies have shown that pairings of certain tastes and certain odors can cause mutual enhancement or suppression in perceptions of the sensory qualities (Hornung and Enns
1994) (Keast et al. 2004). It is possible that the subjects associated“coffee-like” odor with bitterness and/or astrin-gency and thus felt the suppression of “coffee-like” odor once sweetness, which suppresses perception of other tastes, was detected.
According to Frank and Byram (1988), odors take on taste qualities through frequent co-occurrence with partic-ular tastes. Since the co-occurrence of sweet taste and “caramel” odor is common in many foods and beverages, it is possible that the sweet taste increased the intensity of the “caramel” quale. It has been reported that sweet taste can be evoked when caramel odor is present; such behavior is an example of odor–taste synesthesia (Stevenson et al.1995). The results reported here show that the converse is also true, that taste can increase the intensity of odor. This is an example of taste–odor synesthesia in a real food system, espresso coffee.
Acknowledgment This material is based upon work supported by the Cooperative State Research, Education and Extension Service, US Department of Agriculture, under project NYG 623-496 and NYG 623-482.
References
Acree TE, Kittel K, Kurtz A (2007) Flavor chemistry and qualia. In: Hofmann T, Meyerhof W, Schieberle P (eds) Proceedings of the 8th Wartburg Symposium on Flavor Chemistry and Biology, Eisenach, Germany, pp 33–38
Bingham AF, Birch GG, de Graf C, Behan JM, Perring KD (1990) Sensory studies with sucrose maltol mixtures. Chem Senses 15:447–456
Blake AA (2004) Flavour perception and the learning of food preferences. In: Taylor A, Roberts D (eds) Flavor Perception. Blackwell, Oxford, UK, pp 172–202
Bücking M, Steinhart H (2002) Headspace GC and sensory analysis characterization of the influence of different milk additives on the flavor release of coffee beverages. J Agric Food Chem 50:1529– 1534
Calvino AM, Garcia-Medina MR, Cometto-Muniz JE (1990) Interactions in caffeine–sucrose and coffee–sucrose mixtures: evidence of taste and flavor suppression. Chem Senses 15:505–519
Clark CC, Lawless HT (1994) Limiting response alternatives in time– intensity scaling: an examination of the halo-dumping effect. Chem Senses 19:583–594
De Leon D (2001) The qualities of qualia. Commun Cogn 34(1–2):121– 138
de Roos KB, Wolswinkel K (1993) Non-equilibrium partition model for predicting flavour release in the mouth. In: 7th Weurman Flavour Research Symposium Noordwijkerhout, Elsevier, The Netherlands Dennett DC (1988) Quining Qualia. In: Marcel A, Bisiach E (eds) Consciousness in Modern Science. Oxford University Press, Oxford Dravnieks A (1985) Atlas of odor character profiles. American
Society for Testing and Materials, Philadelphia
Ebeler SE (2001) Analytical chemistry: unlocking the secrets of wine flavor. Food Rev Int 17:45–64
Frank RA, Byram J (1988) Taste–smell interactions are tastant and odorant dependent. Chem Senses 13(3):445–456
Hornung D, Enns M (1994) The synergistic action of the taste and smell components of flavour. Synergy, Andover, UK
Keast RSJ, Dalton PH, Breslin PAS (2004) Flavor interactions at the sensory level. In: Taylor A, Roberts D (eds) Flavor Perception. Blackwell, Oxford, UK, pp 228–255
Koch C (2004) The quest for consciousness a neurobiological approach. Roberts, Englewood, CO
Lawless HT, Heymann H (1998) Sensory Evaluation of Food: Principles and Practices. Plenum, New York
Lewis CI (1929) Mind and the World-Order; Outline of a Theory of Knowledge. C. Scribner’s Sons, New York
Maeztu L, Sanz C, Andueza S, Paz De Pena M, Bello J, Cid C (2001) Characterization of espresso coffee aroma by static headspace GC-MS and sensory flavor profile. J Agric Food Chem 49:5437–5444 Meilgaard M, Civille GV, Carr BT (1999) Sensory Evaluation
Techniques. CRC, Boca Raton, FL
Prescott J (2004) Psychological processes in flavour perception. In: Taylor A, Roberts D (eds) Flavor Perception. Blackwell, Oxford, UK, pp 256–278
Stevenson R-J, Case T-I, Boakes R-A (2005) Implicit and explicit tests of odor memory reveal different outcomes following interference. Learn Motiv 36:353–373
Stevenson RJ, Boakes RA (1998) Changes in odor sweetness resulting from implicit learning of a simultaneous odor–sweetness association: an example of learned synesthesia. Learn Motiv 29:113–132 Stevenson RJ, Boakes RA (2004) Sweet and sour smells: learned
synesthesia between the senses of taste and smell. In: Calvert GA, Spence C, Stein BE (eds) The Handbook of Multisensory Processes. MIT, Cambridge, MA, pp 69–83
Stevenson RJ, Prescott J, Boakes RA (1995) The acquisition of taste properties by odors. Learn Motiv 26:1–23
Stevenson RJ, Prescott J, Boakes RA (1999) Confusing tastes and smells: how odours can influence the perception of sweet and sour tastes. Chem Senses 24:627–635
Stoer NL, Lawless HT (1993) Comparison of single product scaling and relative-to-reference scaling in sensory evaluation of dairy products. J Sensory Stud 8:257–270
Wilson DA, Stevenson RJ (2006) Learning to smell: olfactory perception from neurobiology to behavior. The John Hopkins University Press, Baltimore, MD, pp 172–174