Developmental Cell, Volume46
Supplemental Information
Nrf2-Mediated Fibroblast Reprogramming Drives
Cellular Senescence by Targeting the Matrisome
Paul Hiebert, Mateusz S. Wietecha, Michael Cangkrama, Eric Haertel, Eleni Mavrogonatou, Michael Stumpe, Heiko Steenbock, Serena Grossi, Hans-Dietmar Beer, Peter Angel, Jürgen Brinckmann, Dimitris Kletsas, Jörn Dengjel, and Sabine Werner
A X loxp loxp Nrf2 exon 5 E L ctrl ko 0 20 40 60 % B rd U + c e lls ctrl ko BrdU Propidium Iodide vehic le tBHQ vehic le tBHQ 0 5 10 15 20 25 ctrl ko Nqo1 ** m R N A f o ld c hange M ctrl ko 0.0 0.5 1.0 1.5 2.0 p21Cip1 R e l. m R N A ex pr essi on ctrl ko 0.0 0.5 1.0 1.5 2.0 p16ink 4a R e l. m R N A ex pr essi on ctrl ko 0.0 0.5 1.0 1.5 2.0 2.5 p15ink 4b R e l. m R N A ex pr essi on
Col1α2Cre-Nrf2flox/flox wt-Nrf2flox/flox
wt-Nrf2flox/flox (ctrl) Col1α2Cre-Nrf2flox/flox (ko) Collagen1α2 Cre loxp loxp Nrf2 exon 5 ctrl caNrf2 0.0 0.5 1.0 1.5 2.0 2.5 CellROX R e l. f luor esc enc e K Q K ctrl caNrf2 B ctrl ko D Ki67 PDGFRα-eGFP Hoechst 33342 P2.5 10w 10w Figure S1. Related to Figures 1 and 2.
ctrl caNrf2 nt tBHQ nt SFN nt CDD O-Im 0 10 20 30 40 50 60 *** *** Nqo1 *** * m R N A f o ld c hange Whole skin 1 Whole skin 2 p0 fibrob lasts 1 p0 fibrob lasts 2 0 20 40 60 80 100 % of l iv e si ngl e c e lls Immune cells: CD45+ Endothelial cells: CD31+ Keratinocytes: CD45-CD31-CD140a-CD49f+ Fibroblasts: CD45-CD31-CD140a+ CD45CD31VW F Meca3 2 K14 Vimen tin Collagen1 a1 Collagen1 a2 Pdgfra 0 50000 100000 150000 200000 400000 500000 600000 700000 800000 Fibroblast markers Non-fibroblast markers N o rm al iz ed c ount FSC-A Dead-Syt ox green Live cells 41.2% Single cells 96.5% SSC-A SSC-H CD45-Pacific blue CD31-PE CD31+ 1.13% CD45+ 2.94% CD31- CD45-95.2% PDGFRα-BV 605 CD49f-BV 711 Whole skin
Fibroblasts in primary culture
Dead-Syt ox green FSC-A Live cells 87.1% mary culture SSC-H SSC-A Single cells 96.1% CD45-Pacific blue CD31-PE CD31+ 0% CD45+ 0.04% CD31- CD45-99.7% PDGFRα-BV 605 CD49f-BV 711 CD49f+ 4.67% PDGFRα+ 91.3% CD49f+ 47.3% PDGFRα+ 49.3% F G H I J nt tBH Q 0 5 10 15 R e l. m R N A ex pr essi on * NQO1 ctrl KEAP1-/- (1)KEAP1-/- (2) 0 2 4 6 8 R e l. m R N A ex pr essi on NQO1 * *
caNRF2 -DOXcaNRF2 + DOX 0.0 0.5 1.0 1.5 2.0 2.5 R e l. m R N A ex pr essi on NQO1 ** N 0 20 40 60 CD45+ ctrl caNrf2 % of l iv e si ngl e c e lls 0 20 40 60 CD3 -CD11b -CD11b+CD11bhiCD11bloCD3hi CD3lo TCRb -CD3lo TCRb+ TCRb+ CD4+ % o f CD4 5 + c e lls 0.0 0.2 0.4 0.6 0.8 1.0 Ly-6G+ NKp46+CD64+ F4/80+ CD11b+ * * % of C D 45 + c e lls C
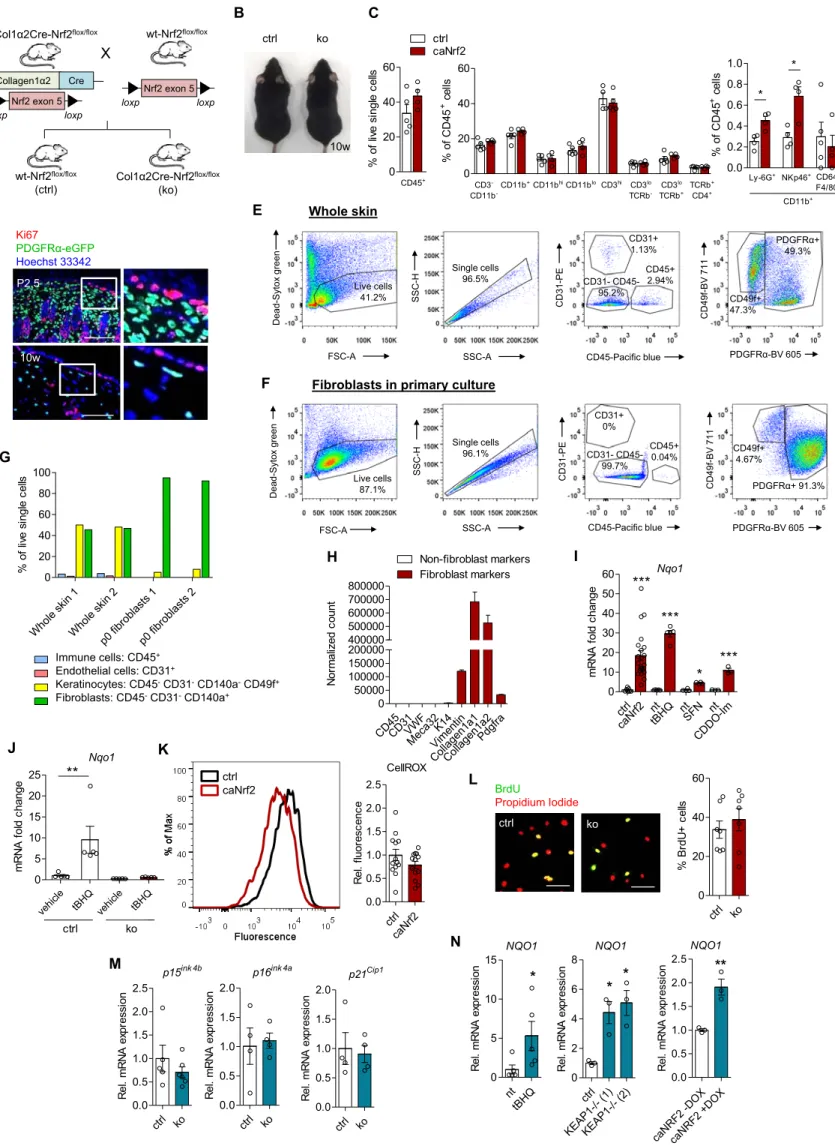
Figure S1. Characterization of mice with Nrf2 gain- and loss-of-function in fibroblasts. Related to Figures 1 and 2.
(A) Scheme depicting the generation of mice lacking Nrf2 in fibroblasts. (B) Macroscopic
appearance of ko vs ctrl mice at 10 weeks of age. (C) Flow-cytometric analysis of the immune cell composition in back skin from mice during homeostasis at 10 weeks of age. (D) Skin sections from PDGFRα-eGFP transgenic mice at P2.5 and 10 weeks of age stained for Ki67, demonstrating a lack of proliferating fibroblasts in the skin during homeostasis. (E) – (G) Flow-cytometric analysis of (E) whole skin from mice at P2.5 and (F) freshly isolated and cultured primary fibroblasts from P2.5 mouse back skin. (G) The percentage of different cell types in whole skin or freshly isolated fibroblast cultures. (H) Gene expression of fibroblast and non-fibroblast markers at passage 2 based on RNA-seq data. (I) Relative expression of Nqo1 by caNrf2 (N=7-22 cultures per genotype from different mice) and wild-type fibroblasts treated with tBHQ (N=5), SFN (N=4) or CDDO-Im (N=3). (J) Relative expression of Nqo1 in fibroblasts at passage 2 isolated from ko vs ctrl mice treated with either vehicle or tBHQ (N=5 cultures per genotype from different mice). (K) ROS detection in caNrf2 vs ctrl fibroblasts using the CellROX® Orange ROS detection kit (N=13). (L) BrdU incorporation and immunostaining on fibroblasts from ko vs ctrl mice at passage 2 (N=7). (M) Gene expression of senescence markers p15ink4b, p16ink4a and p21Cip1 in ko vs ctrl fibroblasts at passage 2. Bar graphs shown mean and SEM. ***P<0.001, **P<0.01, *P<0.05, Mann-Whitney U test (C, I, M, N) or 2-way ANOVA with Bonferroni posttest (J). Scale bars = 100 μm (D) and 50 μm (L).
5d wounds ctrl ko 0 25 50 75 100 Closed Open P e rc ent ctrl ko ctrl ko 0 50 100 R eepi thel ia lizat ion ( % ) ctrl ko 0 20 40 60 80 100 C ont ra c ti on ( % ) ctrl ko 0 50 100 150 200 N eoepi der m a l th ic kness ( P m) ctrl ko 0.0 0.2 0.4 0.6 0.8 1.0 G ranul at io n ti ssue ar ea ( m m 2) G H J ctrl ko 0 5 10 15 20 25 N eoepi der m a l th ic kness ( P m) ctrl ko 0 20 40 60 80 100 C ont ra c ti on ( % ) 5d wounds 14d wounds Fibrobl asts Ker atinocyt es Immune cells 0 10 20 30 ctrl caNrf2 Nqo1 * m R N A f o ld c hange F I 14d wounds ctrl ko ctrl caNrf2 A
Figure S2. Related to Figure 4.
5d wounds y-ctrl y-caNrf2 0 50 100 R eepi thel ia lizat ion ( % ) y-ct rl y-caNr f2 0 10 20 30 40 50 N eoepi der m a l th ic kness ( P m) P = 0.065 E D y-caNrf2 5d wounds y-ctrl C 5d wounds SA-β-gal y-ctrl y-caNrf2 SA-β-gal 5d wounds 14d wounds B Hoechst Meca32 GFP Overlay
Figure S2. Normal wound healing in mice with Nrf2 deficiency in fibroblasts and wound healing in young caNrf2-transgenic mice. Related to Figure 4.
(A) Examination of wounds from 10 week-old ctrl and caNrf2 mice at 14 days post wounding
using SA-β-gal histochemistry. (B) Co-immunofluorescence staining of blood vessels in the granulation tissue for the endothelial marker Meca32 and GFP (reflecting transgene expression). Nuclei were counterstained with Hoechst. (C,D) Examination of wounds from 4 week-old (young) ctrl (y-ctrl) and caNrf2 (y-caNrf2) mice at 5 days post wounding using SA-β-gal histochemistry (C) or hematoxylin & eosin staining (D). (E) Quantification of reepithelialization and neoepidermal thickness in 5-day wounds of ctrl and caNrf2 mice at the age of 4 weeks (N=3 mice, n=6 wounds). (F) Expression of Nqo1 in FACS-isolated cells from 5-day wounds of caNrf2 vs ctrl mice (N=3-4 mice; n=3-4 wounds). *P<0.05, 2-way ANOVA with Bonferroni posttest. (G) Representative histological sections of 5-day and 14-day wounds from ko and ctrl mice stained with hematoxylin and eosin. Arrow heads point to the edge of the migrating epithelium. (H) Quantification of the number of open/closed wounds from ko vs ctrl mice (N=5-7; n=5-7). (I) Morphometric analysis of 5-day (N=7-8; n=7-8) and (J) 14-day (N=6-9; n=6-9) wounds from ko vs ctrl mice. Bar graphs show mean and SEM. Scale bars = 100 μm.
C CD11b -CD3 + CD 11b hi CD3 TCRb lo CD3 + TCRb lo CD3 + CD4 + TCRb 0 10 20 30 40 * % of C D 45 + c e lls Unwounded skin + Ly-6G + NKp4 6 + F4/ 80 hi CD64 0.0 0.5 1.0 2 4 6 8 10 CD11b+ % of C D 45 + c e lls 0 10 20 30 40 * % of l iv e si ngl e c e lls A 5d wounds 0 5 10 15 20 25 % of l iv e si ngl e c e lls -CD 11b - CD3 + CD 11b hi CD3 TCRb lo CD3 + TCRb lo CD3 + CD4 + TCRb 0 10 20 30 40 60 80 * * * ** % of C D 45 + c e lls Unwounded skin CD11b -CD3 + CD 11b hi CD3 TCRb lo CD3 + TCRb lo CD3 + CD4 + TCRb 0 5 10 15 20 60 80 % of C D 45 + c e lls 0 5 10 15 * % of l iv e si ngl e c e lls B + Ly-6G + NKp4 6 + F4/8 0 hi CD64 0 5 10 15 20 CD11b+ * * % of C D 45 + c e lls + Ly-6G + NKp4 6 + F4/ 80 hi CD64 0 1 2 3 4 5 6 15 20 25 CD11b+ % of C D 45 + c e lls D ctrl ctrl
Figure S3. Related to Figure 4.
caNrf2
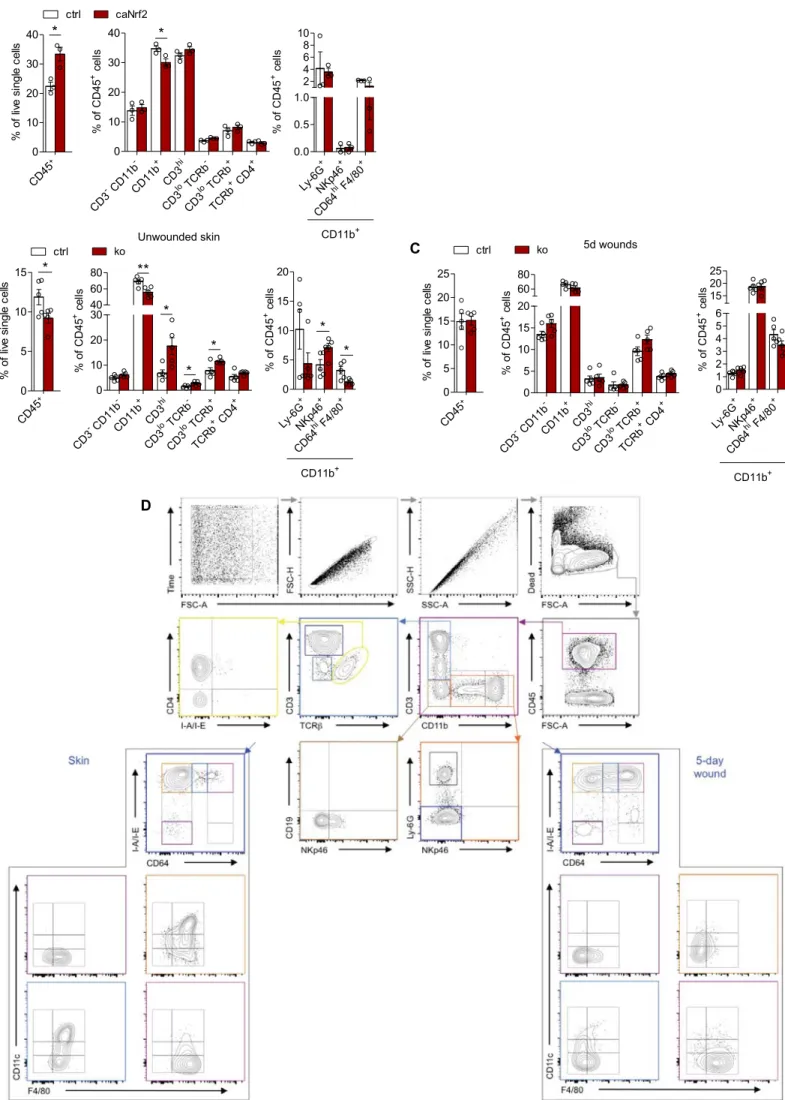
Figure S3. Immune cell composition in unwounded skin and 5d wounds. Related to Fig. 4. (A)
Flow-cytometric analysis of the immune cell composition in unwounded skin from caNrf2 and ctrl mice, (B) 5 day wounds from ko and ctrl mice and (C) unwounded skin from ko and ctrl mice. Bar graphs show mean and SEM. (D) Gating strategy used for profiling of immune cells in wounds and unwounded skin.
esophagus thyroid gland skin ovary kidney gall b ladder endometri um stomach fall opian tube uri nary bladder smooth muscle lung cervix uterine seminal vesicle epididymis testis prostate parath yroid gland placenta breast 0 100 200 300 T ransc ri p ts per m ill ion
Index Name Adjusted
p-value Z-score Combined score 1 NFE2L2_20460467_ChIP-Seq_MEFs_Mouse 7.946e-12 -1.89 58.93 2 NRF2_20460467_ChIP-Seq_MEFs_Mouse 7.946e-12 -1.88 58.76 3 Nerf2_26677805_Chip-Seq_MACROPHAGESS_Mouse 1.126e-11 -1.85 56.54
ChIP-seq Enrichment Analysis 2016 (upregulated ECM proteins and genes)
Index Name Adjusted
p-value Z-score
Combined score
1 NRF2 pathway Homo sapiens WP2884 2.807e-10 -2.00 53.64
2
XPodNet - protein-protein interactions in the podocyte expanded by STRING Mus musculus WP2309
0.0001696 -2.20 28.18
3
Focal Adhesion-PI3K-Akt-mTOR-signaling pathway Mus musculus WP2841
0.001528 -2.24 21.24
WikiPathways 2016 (upregulated ECM proteins and genes)
H E C Log2FC +2 -2 D Collagens Col3a1 Col1a2 Col1a1 Proteoglycans Aspn Bgn Vcan Glycoproteins Coch Lamc3 Rspo1 Mfap4 Eln Lama1 ECM affiliated proteins Elfn1 Sema3e Parm1 Clec3b C1qtnf7 C1qtnf3 ECM regulators Serpinb9b Slpi Serpinb9 Pappa2 Adamts15 Pcsk6 Secreted Factors Brinp3 Prl2c2 Il7 Chrdl1 Angptl6 Flt3l caNrf2 matrisome genes
Figure S4. Related to Figures 5 and 6.
Gene Symbols: Overlapping ECM proteins and genes (upregulated)
Abcc1 Cd14 Gja1 Maoa Ptprc Slc6a9 Abcc4 Chl1 Gpc1 Mst1r Ptprs Slc7a11 Abi3bp Chpf2 Gpr176 Myh11 Serpinb5 Sqrdl Adam23 Cpxm1 Hal Nes Serpinb9b Tfrc
Adcy2 Dysf Heph Nid1 Serpine1 Tgfbr2 Alcam Ecm1 Hspa12a Nqo1 Sfn Ugt1a6b Aldh3b1 Efnb2 Itga3 Nrcam Siglec1 Ugt1a7c Angptl2 Epha2 Itga7 Nrp1 Slc1a4 Wnt5a Atp1b1 Esd Itga8 Palm3 Slc20a2
C3 Ezr Itgam Panx1 Slc22a23 Cat Gclm Itgb2 Pkp3 Slc2a1 Cbr3 Ggt5 Jph2 Ptgr1 Slc6a6
G
Gene Symbols: Overlapping ECM proteins and genes (downregulated)
Acot2 Fam129a Rap2c Aldh18a1 Fmr1 Rnf213 Aldh1l2 H1f0 Smoc2 Arhgef2 Hist2h2bb Svil
Asns Hmgcs1 Tnfrsf11b Aspn Htra3 Col3a1 Lonp1 Crabp1 Lrrc17 Csgalnact1 Pck2 Eln Postn F A NRF2 RNA
(Human Protein Atlas) CarcinomaBasal Cell
B
Squamous Cell Carcinoma NRF2 protein (Human Protein Atlas)
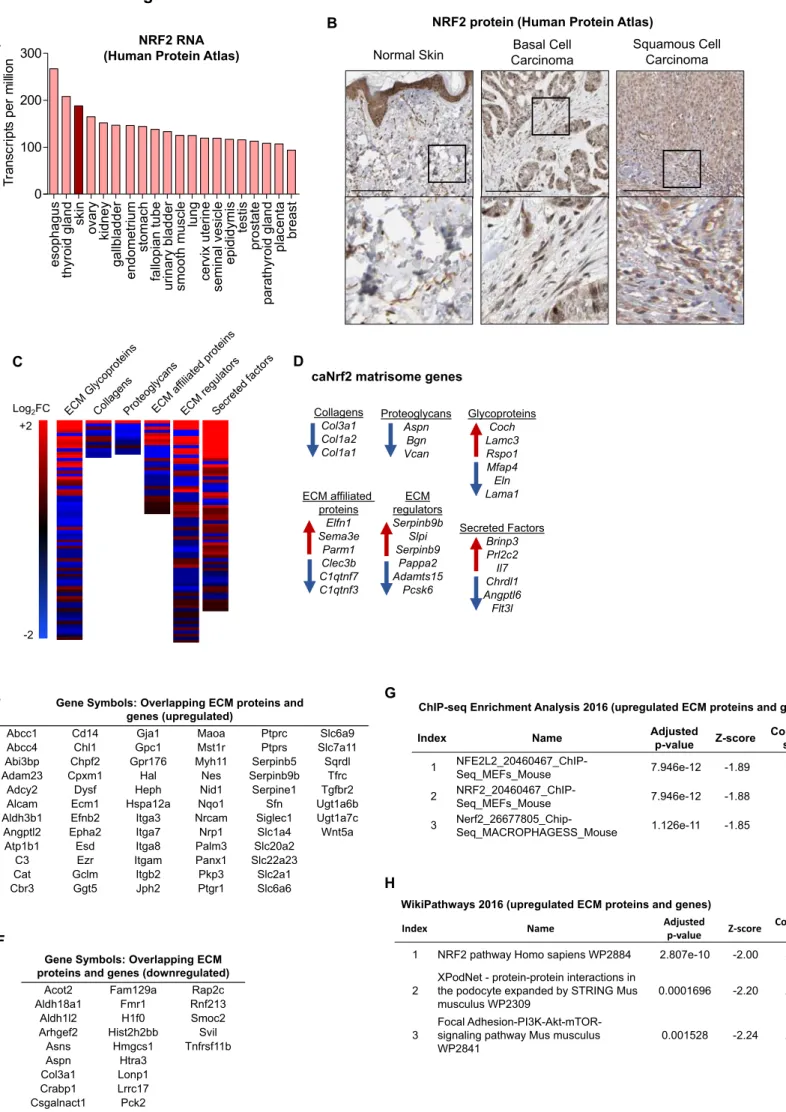
Figure S4. Altered expression and deposition of ECM genes in caNrf2 fibroblasts. Related to Figures 5 and 6.
(A) Data from the Human Protein Atlas showing NRF2 (NFE2L2) gene expression in transcripts per million from different tissues. (B) Immunohistochemistry images from the Human Protein Atlas showing NRF2 expression in normal skin (https://www.proteinatlas.org/ENSG00000116044-NFE2L2/tissue), basal cell carcinoma and cutaneous squamous cell carcinoma
(https://www.proteinatlas.org/ENSG00000116044-NFE2L2/pathology/tissue/skin+cancer#ihc).
Scale bars = 200 μm. (C) Heat maps of differentially expressed genes identified by RNA-seq in caNrf2 fibroblasts corresponding to matrisome categories. (D) List of differentially expressed genes identified by RNA-seq in caNrf2 fibroblasts corresponding to matrisome categories. (E, F) List of genes upregulated (E) or downregulated (F) in caNrf2 fibroblasts that are also upregulated or downregulated ECM components according to the mass spectrometry data. (G) ChIP-seq enrichment analysis comparing upregulated ECM proteins deposited by caNrf2 fibroblasts to previously published ChIP-seq datasets. (H) Comparison of ECM proteins deposited to a larger extent by caNrf2 compared to ctrl fibroblasts with known cellular pathways using Wikipathways.
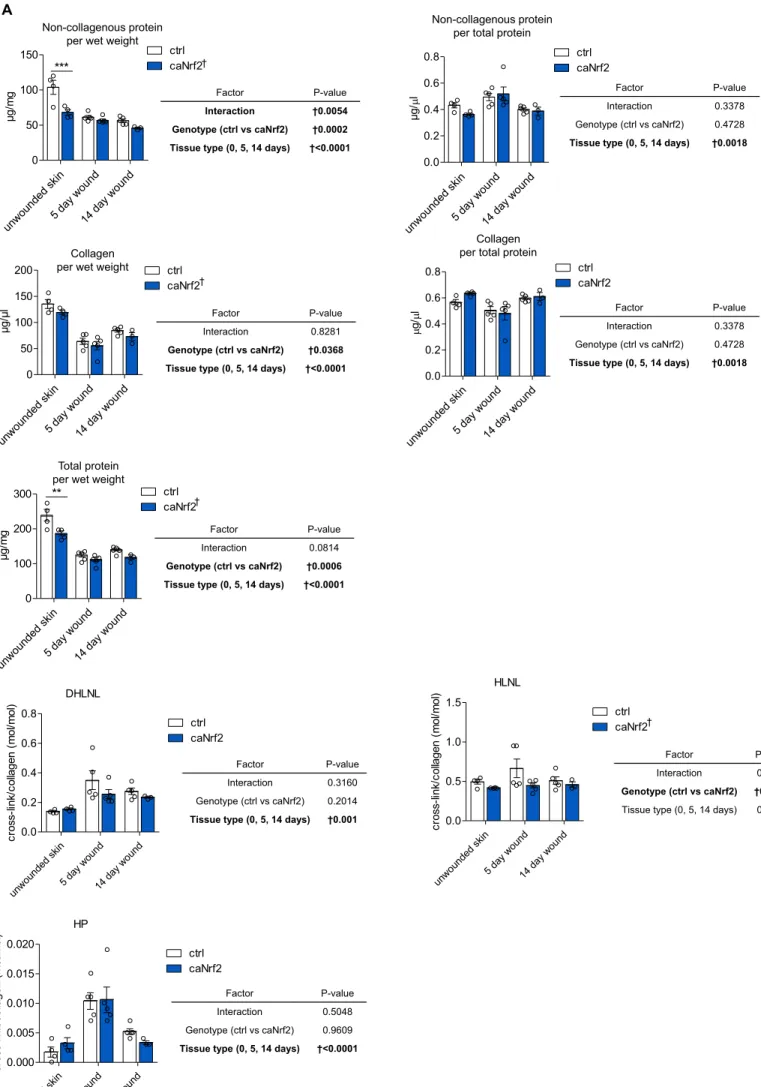
A unwounded skin 5 day wound 14 d ay wo und 0 50 100 150 ctrl caNrf2 *** μg /m g † Non-collagenous protein
per wet weight
Factor P-value
Interaction †0.0054
Genotype (ctrl vs caNrf2) †0.0002
Tissue type (0, 5, 14 days) †<0.0001
unwoun ded skin 5 day wound 14 da y woun d 0.0 0.2 0.4 0.6 0.8 ctrl caNrf2 μg /P l unwoun ded skin 5 day wound 14 da y woun d 0.0 0.2 0.4 0.6 0.8 ctrl caNrf2 P g/P l unwoun ded skin 5 day wound 14 da y woun d 0 50 100 150 200 ctrl caNrf2 μg /μ l unwoun ded skin 5 day wound 14 da y woun d 0 100 200 300 ctrl caNrf2 ** μg /m g Non-collagenous protein per total protein
Factor P-value Interaction 0.3378 Genotype (ctrl vs caNrf2) 0.4728
Tissue type (0, 5, 14 days) †0.0018
Collagen per total protein
Factor P-value Interaction 0.3378 Genotype (ctrl vs caNrf2) 0.4728
Tissue type (0, 5, 14 days) †0.0018
Total protein per wet weight
Factor P-value Interaction 0.0814
Genotype (ctrl vs caNrf2) †0.0006
Tissue type (0, 5, 14 days) †<0.0001
Collagen per wet weight
Factor P-value Interaction 0.8281
Genotype (ctrl vs caNrf2) †0.0368
Tissue type (0, 5, 14 days) †<0.0001
† † DHLNL unwou nded sk in 5 da y wo und 14 d ay w oun d 0.0 0.2 0.4 0.6 0.8 ctrl caNrf2 c ross-link/ c ol lagen ( m ol /m ol ) HLNL unwou nded sk in 5 da y wo und 14 d ay w oun d 0.0 0.5 1.0 1.5 ctrl caNrf2 c ross-link/ c ol lagen ( m ol /m ol ) HP unwou nded sk in 5 da y wo und 14 d ay w oun d 0.000 0.005 0.010 0.015 0.020 ctrl caNrf2 c ross-link/ c ol lagen ( m ol /m ol ) Factor P-value Interaction 0.5048 Genotype (ctrl vs caNrf2) 0.9609
Tissue type (0, 5, 14 days) †<0.0001
Factor P-value Interaction 0.3160 Genotype (ctrl vs caNrf2) 0.2014
Tissue type (0, 5, 14 days) †0.001
Factor P-value Interaction 0.3684
Genotype (ctrl vs caNrf2) †0.0451
Tissue type (0, 5, 14 days) 0.2841 †
B
Figure S5. Biochemical analysis of collagen content and cross-linking. Related to Figure 6. (A)
Collagen analysis and (B) analysis of collagen cross-linking in unwounded skin and in 5 and 14 day wounds from caNrf2 vs ctrl mice (N=4-5 mice; n=4-5 wounds, caNrf2 14d N=3; n=3). Bar graphs show mean and SEM. **P<0.01, *P<0.05; 2-way ANOVA with Bonferroni posttest.
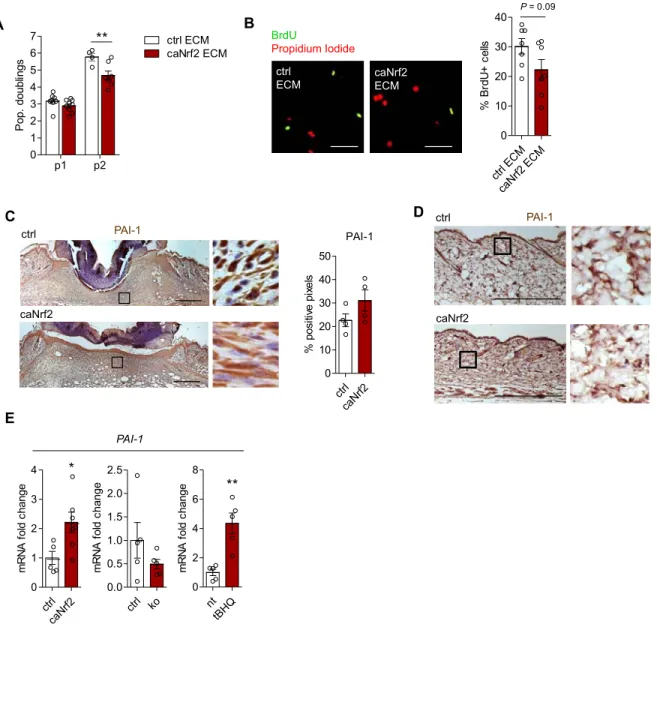
ctrl caNrf2 D PAI-1 caNrf2 ctrl ctrl caNrf2 0 10 20 30 40 50 PAI-1 % posi ti ve pi xe ls C A p1 p2 0 1 2 3 4 5 6 7 ctrl ECM caNrf2 ECM ** P op. doubl ings caNrf2 ECM ctrl ECM B ctrl ECM caNrf2 ECM 0 10 20 30 40 P = 0.09 % B rd U + c e lls BrdU Propidium Iodide PAI-1
Figure S6. Related to Figure 7.
ctrl caNrf2 0 1 2 3 4 * m R N A f o ld c hange ctrl ko 0.0 0.5 1.0 1.5 2.0 2.5 m R N A f o ld c hange nt tBHQ 0 2 4 6 8 ** m R N A f o ld c hange PAI-1 E
Figure S6. Nrf2 targets the extracellular matrix to promote fibroblast senescence. Related to Figure 7.
Skin fibroblasts were isolated from wild-type mice and directly plated onto dishes coated with ECM deposited by either ctrl or caNrf2 fibroblasts. Cells were plated onto new ECM-coated dishes during each passage. (A) Population doublings over 2 passages calculated by counting trypan blue excluding cells (N=4-7 ECM-coated dishes from fibroblasts isolated from different mice). (B) BrdU incorporation and staining of fibroblasts at passage 2 (N=7). (C) PAI-1 immunohistochemistry performed on 5-day wounds and quantification of positive pixels (N=4 mice). (D) PAI-1 immunohistochemistry performed on sections from unwounded skin of mice at 10 weeks of age. (E) qRT-PCR analysis of PAI-1 gene expression in ctrl, caNrf2, ko and wild-type fibroblasts treated with tBHQ (N=5-7 cultures per genotype from different mice). Bar graphs show mean and SEM. *P<0.05, **P<0.01; 2-way ANOVA with Bonferroni posttest (A) or Mann-Whitney U test (E). Scale bars = 50 µm (B) or 200 µm (C,D).
Col1α2Cre (hemizygous) C57Bl/6
♀
♂
X CMVcaNrf2 (hemizygous) FVB/N Col1α2Cre genotype CMVcaNrf2 genotype hemi hemi wild-type wild-type hemi hemi wild-type wild-type F1 generation (mixed background) 25% 25% 25% 25% (caNrf2) (ctrl) A B Col1α2Cre (hemizygous) C57Bl/6♀
♂
X Nrf2flox/flox C57Bl/6 Col1α2Cre genotype Nrf2flox/flox genotype hemi wild-type flox/wt flox/wt F1 generation (C57Bl/6) 50% 50% Col1α2Cre (hemizygous) Nrf2flox/wt♀
F1♂
X Nrf2flox/flox Col1α2Cre genotype Nrf2flox/flox genotype hemi wild-type flox/wt flox/wt F2 generation (C57Bl/6) 25% 25% hemi wild-type flox/flox flox/flox 25% 25% Col1α2Cre (hemizygous) Nrf2flox/flox♀
F2♂
X Nrf2flox/flox Col1α2Cre genotype Nrf2flox/flox genotype hemi wild-type flox/flox flox/flox F3 generation (C57Bl/6) 50% 50% (ko) (ctrl) Figure S7. Related to Star Methods.HF HF L R O C % Contraction = (5000 – C)/50 % Re-epithelialization = (L+R)/(L+O+R)*100 Neoepidermal thickness= (A1+A2)/(L1+L2) Granulation tissue area = G
G HF HF 5d wound A1 A2 L1 L2 Eschar C HF HF A L G % Contraction = (5000 – C)/50 Neoepidermal thickness = A/L Granulation/early scar tissue area = G
14d wound C
Figure S7. Related to Star Methods.
Generation of mice with Nrf2 gain- or loss-of-function in fibroblasts and schematic representation of the parameters determined in the histomorphometric analysis of wounds.
(A) Scheme depicting the breeding and control animals used in experiments with caNrf2 mice/fibroblasts (hemi = hemizygous). (B) Scheme depicting the breeding and control animals used in experiments with ko mice/fibroblasts (hemi = hemizygous). (C,D) Scheme depicting a 5 day (C) and a 14 day (D) wound and the parameters determined in the histomorphometric analysis of the wounds.
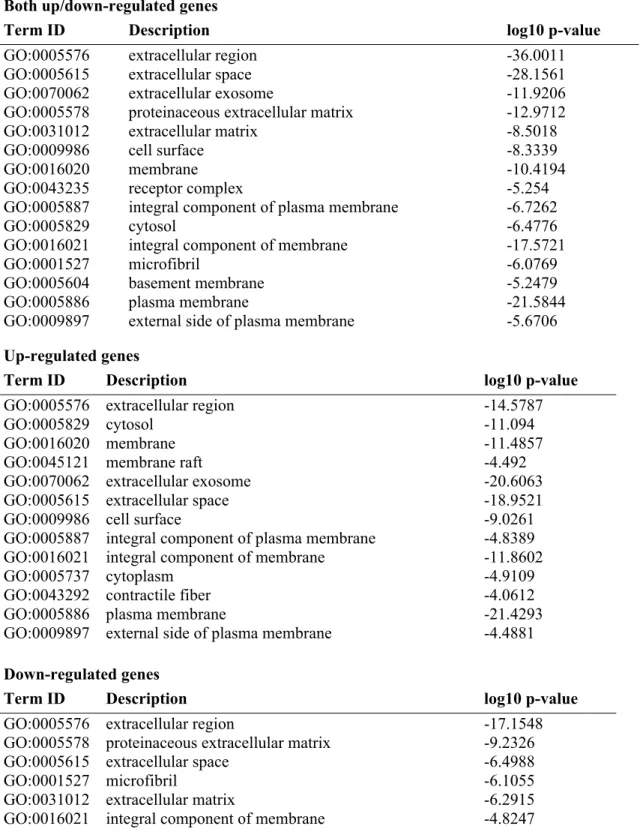
Table S3. Gene Ontology Enrichment Analysis (Cellular Component). Related to Figure 6.
Both up/down-regulated genes
Term ID Description log10 p-value
GO:0005576 extracellular region -36.0011
GO:0005615 extracellular space -28.1561
GO:0070062 extracellular exosome -11.9206
GO:0005578 proteinaceous extracellular matrix -12.9712
GO:0031012 extracellular matrix -8.5018
GO:0009986 cell surface -8.3339
GO:0016020 membrane -10.4194
GO:0043235 receptor complex -5.254
GO:0005887 integral component of plasma membrane -6.7262
GO:0005829 cytosol -6.4776
GO:0016021 integral component of membrane -17.5721
GO:0001527 microfibril -6.0769
GO:0005604 basement membrane -5.2479
GO:0005886 plasma membrane -21.5844
GO:0009897 external side of plasma membrane -5.6706
Up-regulated genes
Term ID Description log10 p-value
GO:0005576 extracellular region -14.5787
GO:0005829 cytosol -11.094
GO:0016020 membrane -11.4857
GO:0045121 membrane raft -4.492
GO:0070062 extracellular exosome -20.6063
GO:0005615 extracellular space -18.9521
GO:0009986 cell surface -9.0261
GO:0005887 integral component of plasma membrane -4.8389 GO:0016021 integral component of membrane -11.8602
GO:0005737 cytoplasm -4.9109
GO:0043292 contractile fiber -4.0612
GO:0005886 plasma membrane -21.4293
GO:0009897 external side of plasma membrane -4.4881
Down-regulated genes
Term ID Description log10 p-value
GO:0005576 extracellular region -17.1548
GO:0005578 proteinaceous extracellular matrix -9.2326
GO:0005615 extracellular space -6.4988
GO:0001527 microfibril -6.1055
GO:0031012 extracellular matrix -6.2915
Table S3. Gene Ontology Enrichment Analysis (Cellular Component). Related to Figure 6.
List of the most significant results obtained from gene ontology enrichment analysis performed by EdgeR software. Enriched gene ontology terms listed are those with log10 p-value < -4.