HAL Id: hal-02961506
https://hal.inria.fr/hal-02961506v2
Submitted on 20 Oct 2020
HAL is a multi-disciplinary open access
archive for the deposit and dissemination of
sci-entific research documents, whether they are
pub-lished or not. The documents may come from
teaching and research institutions in France or
abroad, or from public or private research centers.
L’archive ouverte pluridisciplinaire HAL, est
destinée au dépôt et à la diffusion de documents
scientifiques de niveau recherche, publiés ou non,
émanant des établissements d’enseignement et de
recherche français ou étrangers, des laboratoires
publics ou privés.
Estimation of imaging biomarker’s progression in
post-infarct patients using cross-sectional data
Marta Nuñez-Garcia, Nicolas Cedilnik, Shuman Jia, Hubert Cochet, Marco
Lorenzi, Maxime Sermesant
To cite this version:
Marta Nuñez-Garcia, Nicolas Cedilnik, Shuman Jia, Hubert Cochet, Marco Lorenzi, et al.. Estimation
of imaging biomarker’s progression in post-infarct patients using cross-sectional data. STACOM 2020
- 11th International Workshop on Statistical Atlases and Computational Models of the Heart, Oct
2020, Lima, Peru. p.108–116. �hal-02961506v2�
in post-infarct patients using cross-sectional data
Marta Nu˜nez-Garcia1,2, Nicolas Cedilnik3, Shuman Jia3, Hubert Cochet1,4,
Marco Lorenzi3, and Maxime Sermesant3
1 Electrophysiology and Heart Modeling Institute (IHU LIRYC), Pessac, France 2
Universit´e de Bordeaux, Bordeaux, France
3 Inria, Universit´e C’ˆote d’Azur, Sophia Antipolis, France 4
CHU Bordeaux, Department of Cardiovascular and Thoracic Imaging and Department of Cardiac Pacing and Electrophysiology, Pessac, France.
Abstract. Many uncertainties remain about the relation between post-infarct scars and ventricular arrhythmia. Most post-post-infarct patients suffer scar-related arrhythmia several years after the infarct event suggesting that scar remodeling is a process that might require years until the af-fected tissue becomes arrhythmogenic. In clinical practice, a simple time-based rule is often used to assess risk and stratify patients. In other cases, left ventricular ejection fraction (LVEF) impairment is also taken into account but it is known to be suboptimal. More information is needed to better stratify patients and prescribe appropriate individualized treat-ments. In this paper we propose to use probabilistic disease progression modeling to obtain an image-based data-driven description of the in-farct maturation process. Our approach includes monotonic constraints in order to impose a regular behaviour on the biomarkers’ trajectories. 49 post-MI patients underwent Computed Tomography (CT) and Late Gadolinium Enhanced Cardiac Magnetic Resonance (LGE-CMR) scans. Image-derived biomarkers were computed such as LVEF, LGE-CMR scar volume, fat volume, and size of areas with a different degree of left ven-tricular wall narrowing, from moderate to severe. We show that the model is able to estimate a plausible progression of post-infarct scar maturation. According to our results there is a progressive thinning process observable only with CT imaging; intramural fat appears in a late stage; LGE-CMR scar volume almost does not change and LVEF slightly changes during the scar maturation process.
Keywords: Disease progression modeling· Cross-sectional data · Ven-tricular arrhythmia· Post-infarct cardiac remodeling
1
Introduction
Scar-related substrate after myocardial infarction (MI) induces most life-threatening ventricular arrhythmias [8]. Common recommendations for primary prevention of ventricular arrhythmia and sudden cardiac death advise car-dioverter defibrillator (ICD) implantation in post-MI patients with left ventric-ular ejection fraction (LVEF) lower than 35% and symptoms of heart failure [1].
2 M. Nu˜nez-Garcia et al.
However, a risk stratification rule solely based on LVEF lacks sensitivity and specificity [4]. Additionally, several studies have reported long periods between MIs and arrhythmia [9] suggesting scar remodeling or maturation is a dynamic process, and it may take many years until the affected tissue becomes arrhyth-mogenic. Therefore, a deeper investigation of the nature of the arrhythmogenic substrate and its potential evolution over time is required. New biomarkers and more information about the right time point to evaluate them are needed.
Non-invasive imaging techniques have the potential to improve our knowl-edge about the nature of scar-related arrhythmogenic substrate and its dynamic remodeling process. Late Gadolinium Enhancement Cardiovascular Magnetic Resonance (LGE-CMR) imaging is the reference method to classify myocardial tissue. Many methods have been proposed to detect and quantify scar in the left ventricular (LV) wall using LGE-CMR images, most of them relying on a threshold-based rule. After segmenting the LV wall, tissue is typically divided into healthy tissue (darkest voxels), dense scar (brightest voxels) and border zone (image intensities between the other 2 thresholds). Scar remodeling using
longitudinal LGE-CMR data have been recently described by J´auregui et al.
[5]. After scanning post-MI patients at 7 days, 6 months and 4 years after the infarction, the authors showed that dense scar and border zone mass decreased over time suggesting the existence of a long-term scar healing process. bayesi
Due to the relatively low spatial resolution of LGE-CMR images and several contraindications (patients carrying ICDs, claustrophia, etc.) Computed Tomog-raphy (CT) imaging has been recently introduced to accurately characterize scar. Furthermore, several studies have shown the existence of a progressive thinning of the LV wall in scarred areas [2]. Wall thickness and intramural fat mapping from CT are promising imaging biomarkers that could be useful to improve risk stratification in patients considered for ICD implantation and to better person-alize ablation therapies.
Disease progression modeling (DPM) provides a data-driven description of the natural evolution of a given pathology and it aims at revealing long-term pathological trajectories from short-term clinical data [7]. Reformulating DPM within a probabilistic setting has the potential of predicting a plausible evolution of the different biomarkers considered.
In this paper, we used CT and LGE-CMR imaging biomarkers from cross-sectional (i.e. one single time point per patient) post-MI data, and a probabilistic DPM to characterize scar maturation. The model shows a plausible evolution of the different biomarkers taken into account and allows us to estimate a relative temporal timeline of disease progression.
2
Methods
Data processing
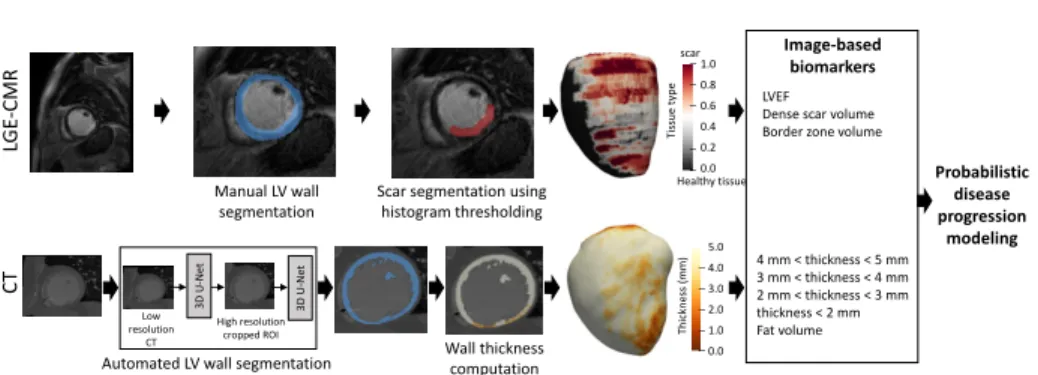
Forty-nine post-MI patients underwent CT and LGE-CMR imaging at the Cen-tre Hospitalier Universitaire (CHU) de Bordeaux (France). A schematic repre-sentation of the proposed method can be seen in Figure 1. The LV wall was
4 mm < thickness < 5 mm 3 mm < thickness < 4 mm 2 mm < thickness < 3 mm thickness < 2 mm Fat volume Manual LV wall segmentation C T LGE -CMR
Scar segmentation using histogram thresholding
High resolution cropped ROI
LVEF Dense scar volume Border zone volume
3D U -N et 3D U -N et Image-based biomarkers Tis su e ty p e 1.0 0.8 0.6 0.4 0.2 0.0 Th ickn es s (m m ) 5.0 4.0 3.0 2.0 1.0 0.0
Automated LV wall segmentation Low
resolution
CT Wall thickness
computation
scar
Healthy tissue Probabilistic
disease progression
modeling
Fig. 1: Data processing pipeline. LGE-CMR images are manually segmented and the LV wall tissue is classified using a threshold-based approach. CT images are automatically segmented using 2 successive U-nets, and wall thickness is com-puted afterwards. Then, 8 imaging biomarkers are calculated and used to esti-mate the probabilistic disease progression model. LGE-CMR = Late Gadolinium Enhanced Cardiac Magnetic Resonance; CT = Computed Tomography; LVEF = Left Ventricular Ejection Fraction.
manually segmented from the LGE-CMR images by experts. As typically done in clinical practice, a threshold-based approach was used to classify voxels into healthy tissue (image intensity below the 40% of the maximum intensity in the LV wall), border zone (between 40% and 60% of the maximum intensity) and dense scar (above 60% of the maximum intensity).
The LV wall was automatically segmented from CT images using a deep learning approach based on two successive U-net networks [3, 6, 11]. The high spatial resolution of CT images requires high memory resource while at the same time the ventricles take only a fraction of the entire CT volume. For that reason, we input to the first network a low-resolution version of the CT data and the output (coarse segmentation) was used to locate the ventricles. Only the region around them was kept and a cropped high-resolution version of the image was fed to the second 3D U-net. The output masks were post-processed (including up-sampling to the original CT image resolution) to obtain clean and non-overlapping masks. The model was trained using 450 CT scans with available expert segmentations of the LV endocardium and epicardium, and the right ventricular epicardium. 50 CT scans were used for validation with a loss function defined as the opposite of the Dice score.
To estimate the LV wall thickness a previously described method based on solving a partial differential equation using the endocardium and epicardium masks was used [12]. This method assigns a thickness value to each voxel of the LV wall. Wall thickness measurements were then projected onto a mid-wall 3D surface mesh obtained from the LV wall segmentation where areas of different thickness bins were computed. We considered 4 wall thickness bins representing different degrees of wall thinning, from moderate to severe: thickness between 5
4 M. Nu˜nez-Garcia et al.
Table 1: Population characteristics. Values are mean ± STD [Min, Max]. STD = Standard deviation. LAD = Left Anterior Descending; LCX = Left Circumflex; RCA = Right Coronary Artery.
Parameter Mean ± STD [Min, Max] Patient’s age (years) 65.53 ± 11.62 [38, 91]
Scar age (years) 7.39 ± 9.06 [0.3, 40] LV end-diastolic volume (mL) 137.47 ± 38.00 [90.61, 242.14]
LV end-diastolic area (cm2) 181.10 ± 32.33 [123.40, 250.69] LVEF (%) 44.04 ± 12.96 [23, 75] Dense scar volume (mL) 8.24 ± 8.44 [0.72, 50.07] Border zone volume (mL) 13.95 ± 8.68 [2.45, 34.69]
Fat volume (mL) 0.69 ± 1.66 [0, 9.13] Area of wall thickness between 5mm - 4mm (cm2) 17.81 ± 11.07 [1.62, 45.44] Area of wall thickness between 4mm - 3mm (cm2) 10.69 ± 7.44 [1.37, 27.99]
Area of wall thickness between 3mm - 2mm (cm2) 7.51 ± 6.37 [1.56, 25.44] Area of wall thickness below 2mm (cm2) 7.16 ± 4.07 [3.59, 23.43]
Gender 5 (10.20%) female patients LAD scar 20 (40.81%) patients LCX scar 17 (34.69%) patients RCA scar 23 (46.94%) patients
and 4 mm; thickness between 4 and 3 mm; thickness between 3 and 2 mm; and thickness below 2mm.
Eight biomarkers were included in the analysis. From LGE-CMR: LVEF; volume of dense scar; and volume of border zone. From CT: fat volume; and areas of wall thinning considering the 4 thickness bins mentioned before. Population characteristics are shown in Table 1 including scar age (i.e. lapse of time between MI and imaging studies).
Disease progression modeling
The statistical framework used in this study (detailed in [7]) formulates disease progression modeling based on Bayesian Gaussian Process (GP) regression [10] by modeling individual time transformations encoding the information of the as-sociated pathological stage, and introducing monotonicity constraints to impose a plausible behaviour on the biomarkers’ trajectories from normal to pathologi-cal stages. Briefly, biomarkers’ evolution are modeled as monotonic GPs, while individuals are assigned to their specific time point relative to the regression time axis, according to the severity of the associated biomarker measurements. The time axis corresponds to the patient’s scar age, i.e. delay between the infarc-tion event and the imaging study. Monotonic constraints were defined as follows: increasing for fat volume and all degrees of wall thinning [2], and decreasing for LVEF, dense scar volume, and border zone volume [5].
3
Results
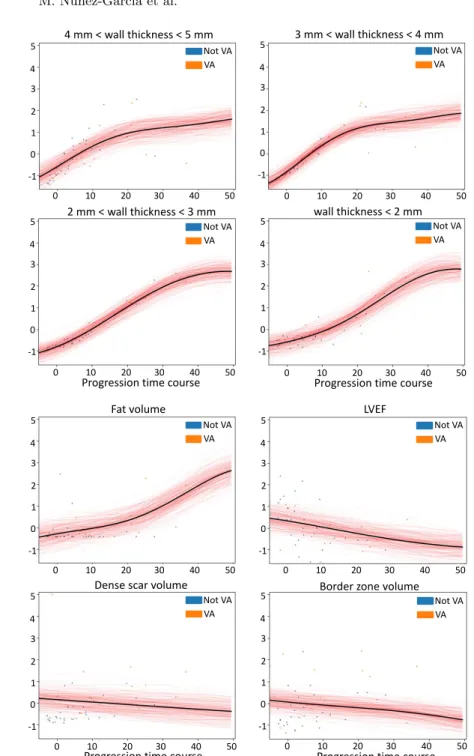
The predicted biomarkers temporal trajectories are shown in Figure 2. It can be observed that the model predicts a plausible progressive thinning of the LV wall and an increase of fat volume in a late stage. On the contrary, the trajectories corresponding to border zone volume, dense scar volume, and LVEF remain almost constant.
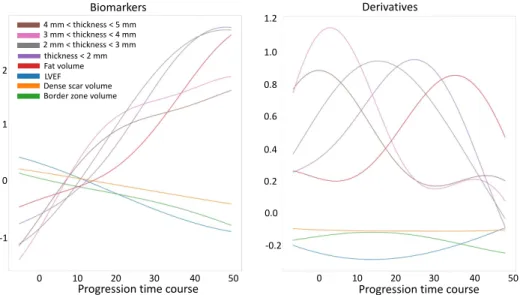
All biomarkers trajectories can be seen together in Figure 3 (left). Figure 4 and Table 2 show the estimated distributions of the maximum change time for all biomarkers suggesting when the biggest change for each biomarker occurs. These parameters allow us to estimate the timeline for remodeling changes by inferring which biomarkers may change before the others. The progressive wall thinning as seen by CT thickness seems clear showing, moreover, an initial fast thinning followed by a more softened, spaced in time, narrowing. According to the model, fat appears only in a late stage. The high variance of dense scar and border zone volumes indicates that no clear evolution pattern is seen for these features.
Importantly, due to the lack of longitudinal data (i.e. only one time point per patient was available), the time axis can only be interpreted as relative time and it does not represent real years. We believe however that this methodology can be useful to describe the dynamics across biomarkers, while distinguishing the most informative features to state the pathological stage of an individual during the course of the scar maturation process. Additionally, our method may enable to position a given patient among other patients at a similar state on the scar maturation process. It may be crucial to determine when the scarred tissue starts to become severely thin (thickness < 2mm) because the total area of severe thinning has been shown to be a good predictor for ventricular arrhythmia. In this cohort the area of severe thinning was significantly greater in patients with arrhythmia (17 patients), p = 0.0019 in a two-sample t-test. Other significant features (at the 5% level) were: the area of thickness between 3 and 2 mm (p = 0.0028); area of thickness between 4 and 3 mm (p = 0.037); dense scar volume (p = 0.010); LVEF (p = 0.028); and fat volume (p = 0.035).
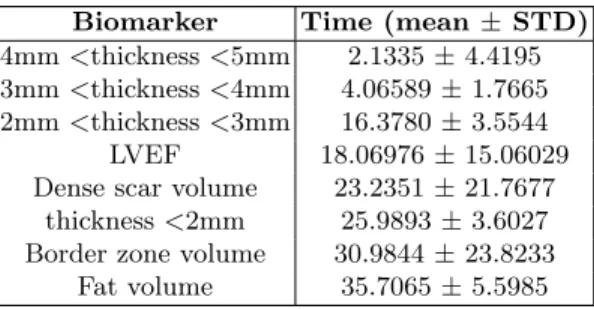
Table 2: Distributions of the maximum change time in ascending order. STD = Standard deviation.
Biomarker Time (mean ± STD) 4mm <thickness <5mm 2.1335 ± 4.4195 3mm <thickness <4mm 4.06589 ± 1.7665 2mm <thickness <3mm 16.3780 ± 3.5544 LVEF 18.06976 ± 15.06029 Dense scar volume 23.2351 ± 21.7677
thickness <2mm 25.9893 ± 3.6027 Border zone volume 30.9844 ± 23.8233
6 M. Nu˜nez-Garcia et al.
4 mm < wall thickness < 5 mm 3 mm < wall thickness < 4 mm
2 mm < wall thickness < 3 mm wall thickness < 2 mm
0 10 20 30 40 50 0 10 20 30 40 50
0 10 20 30 40 50 0 10 20 30 40 50
Progression time course
5 4 3 2 1 -1 0 5 4 3 2 1 -1 0 5 4 3 2 1 -1 0 5 4 3 2 1 -1 0 Not VA VA Not VA VA Not VA VA Not VA VA
Progression time course
Fat volume LVEF
Dense scar volume Border zone volume
Not VA VA Not VA VA Not VA VA Not VA VA 0 10 20 30 40 50 5 4 3 2 1 -1 0 0 10 20 30 40 50 5 4 3 2 1 -1 0 0 10 20 30 40 50 5 4 3 2 1 -1 0 0 10 20 30 40 50 5 4 3 2 1 -1 0
Progression time course Progression time course
Fig. 2: Modeled biomarker progressions. Each red line displays the estimated tra-jectory for a given patient and a given biomarker. Dots correspond to individual samples colored according to disease status: not VA (blue) and VA (orange). Note that since only one time point per patient was available the time axis can only be interpreted as relative time and it does not represent real years. LVEF = Left Ventricular Ejection Fraction; VA = Ventricular arrhythmia.
0 10 20 30 40 50 0 10 20 30 40 50 2 1 0 -1 1.2 1.0 0.8 0.6 0.4 0.2 0.0 -0.2 LVEF
Dense scar volume Border zone volume 4 mm < thickness < 5 mm 3 mm < thickness < 4 mm 2 mm < thickness < 3 mm thickness < 2 mm Fat volume Biomarkers Derivatives
Progression time course Progression time course
Fig. 3: On the left, all estimated biomarker trajectories; on the right, corre-sponding derivatives showing the temporal point of maximum change (i.e. point of maximum slope in the trajectories) and the relative magnitude of the change.
LVEF Dense scar volume Border zone volume
4 mm < thickness < 5 mm 3 mm < thickness < 4 mm 2 mm < thickness < 3 mm thickness < 2 mm Fat volume
Max change time
0 10 20 30 40 50
Progression time course
8 M. Nu˜nez-Garcia et al.
4
Conclusions
This work suggests that probabilistic disease progression modeling can be used to estimate the long-term progression of imaging biomarkers related to post-MI scar maturation using purely cross-sectional data. According to the model, it exists a progressive LV wall thinning process in post-MI patients that lasts for years. CT may outperform LGE-CMR imaging in characterizing post-infarct scar remodeling as well as in predicting disease stage. This prediction may be useful for example to assess individual cardiac risk to advise ICD insertion (currently determined by the time passed since the infarction, and suboptimal metrics such as LVEF). It can also be useful to adapt treatments (e.g. ablation therapy) to the patient’s stage according to the model.
Acknowledgements. Part of this work was funded by the ERC starting grant EC-STATIC (715093), the IHU LIRYC (ANR-10-IAHU-04), the Equipex MUSIC (ANR-11-EQPX-0030) and the ANR ERACoSysMed SysAFib projects.
This work was also supported by the French government, through the 3IA Cˆote
d’Azur Investments in the Future project managed by the National Research Agency (ANR) with the reference number ANR-19-P3IA-0002, and by the ANR JCJC project Fed-BioMed 19-CE45-0006-01. We would like to thank all patients who agreed to make available their clinical data for research.
References
1. Al-Khatib, S., M, S., Stevenson, W.G., Ackerman, M.J., Bryant, W.J., Callans, D.J., Curtis, A.B., Deal, B.J., Dickfeld, T., Field, M.E., et al.: AHA/ACC/HRS guideline for management of patients with ventricular arrhythmias and the pre-vention of sudden cardiac death: Executive summary: A report of the American College of Cardiology/American Heart Association Task Force on Clinical Practice Guidelines and the Heart Rhythm Society. Heart Rhythm 35 (2017)
2. Anversa, P., Olivetti, G., Capasso, J.M.: Cellular basis of ventricular remodel-ing after myocardial infarction. The American journal of cardiology 68(14), 7–16 (1991)
3. Cedilnik, N., Duchateau, J., Sacher, F., Ja¨ıs, P., Cochet, H., Sermesant, M.: Fully Automated Electrophysiological Model Personalisation Framework from CT Imag-ing. In: International Conference on Functional Imaging and Modeling of the Heart. pp. 325–333 (2019)
4. Goldberger, J.J., Cain, M.E., Hohnloser, S.H., et al.: American Heart Associa-tion/American College of Cardiology Foundation/Heart Rhythm Society scientific statement on noninvasive risk stratification techniques for identifying patients at risk for sudden cardiac death: a scientific statement from the American Heart As-sociation Council on Clinical Cardiology Committee on Electrocardiography and Arrhythmias and Council on Epidemiology and Prevention. Journal of the Amer-ican College of Cardiology 52(14), 1179–1199 (2008)
5. J´auregui, B., Soto-Iglesias, D., Penela, D., Acosta, J., et al.: Follow-up after my-ocardial infarction to explore the stability of arrhythmogenic substrate: the FOOT-PRINT study. JACC: Clinical Electrophysiology 6(2), 207–218 (2020)
6. Jia, S., Despinasse, A., Wang, Z., Delingette, H., Pennec, X., Ja¨ıs, P., Cochet, H., Sermesant, M.: Automatically segmenting the left atrium from cardiac images using successive 3D U-nets and a contour loss. In: International Workshop on Statistical Atlases and Computational Models of the Heart. pp. 221–229 (2018)
7. Lorenzi, M., Filippone, M., Frisoni, G.B., Alexander, D.C., et al.: Probabilistic disease progression modeling to characterize diagnostic uncertainty: application to staging and prediction in Alzheimer’s disease. NeuroImage 190, 56–68 (2019) 8. Martin, C.A., Gajendragadkar, P.R.: Scar Tissue: Never Too Old to Remodel.
JACC: Clinical Electrophysiology 6(2) (2020)
9. Martin, R., Maury, P., Bisceglia, C., Wong, T., Estner, H., Meyer, C., Dallet, C., Martin, C.A., Shi, R., Takigawa, M., et al.: Characteristics of scar-related ventricular tachycardia circuits using ultra-high-density mapping: a multi-center study. Circulation: Arrhythmia and Electrophysiology 11(10), e006569 (2018) 10. Rasmussen, C.E.: Gaussian processes in machine learning. In: Summer School on
Machine Learning. pp. 63–71 (2003)
11. Ronneberger, O., Fischer, P., Brox, T.: U-net: Convolutional networks for biomedi-cal image segmentation. In: International Conference on Medibiomedi-cal image computing and computer-assisted intervention. pp. 234–241 (2015)
12. Yezzi, A.J., Prince, J.L.: An Eulerian PDE approach for computing tissue thick-ness. IEEE transactions on medical imaging 22(10), 1332–1339 (2003)
![Table 1: Population characteristics. Values are mean ± STD [Min, Max]. STD = Standard deviation](https://thumb-eu.123doks.com/thumbv2/123doknet/13387460.405171/5.918.206.711.240.524/table-population-characteristics-values-mean-std-standard-deviation.webp)