STUDIES ON CONVECTIVE COOLING OF CRYOGENIC
FLUIDS TOWARDS SUPERCONDUCTING APPLICATIONS
KAMALAKANTA SATPATHY1, CHARLES DUBOIS2, ALEXIS DUCHESNE2,
JEAN-FRANÇOIS FAGNARD1, HERVÉ CAPS2, PHILIPPE VANDERBEMDEN1
& BENOÎT VANDERHEYDEN1
1Department of Electrical Engineering & Computer Science B28, University of Liege, Belgium 2GRASP, UR-CESAM Physics Department B5, University of Liege, Belgium
ABSTRACT
To understand the cooling aspect through natural convection in a cryogenic fluid interacting with a constant heat source, numerical simulations are carried out in a parallelepiped enclosure. The 3D form of N-S equations is solved to obtain the detailed flow features through path line profiles, isotherm contours and velocity vectors. The effect of heater aspect ratio (x/L) on the rate of heat transfer is studied in terms of the average Nusselt number (Nuave). The results indicate that effective heat transfer enhancement occurs for a small heater length, resulting in an efficient cooling. Increasing the heater length will favor heat transfer through conduction over convection. The maximum temperature difference across the fluid and the velocity magnitude are found to decrease with heater length. 3D and 2D results are in agreement for short heater lengths, but vary for higher heater lengths, presumably due to the essential effect of the heater width. Further analysis on different types of coolant reveals a constant correlation between Nuave and the Rayleigh number (Ra), with Nuave ~ Ra0.374. Benchmark validation for natural convection in a square enclosure is found to be satisfactory against the reported results.
Keywords: computational fluid dynamics (CFD), Rayleigh number, average Nusselt number, aspect ratio.
1 INTRODUCTION
To meet the increasing global energy demand with minimal green-house effect, electrical energy is a viable option. But, it requires an efficient electrical power system with optimal loss. Towards this, superconducting materials represent a promising way of improving the existing systems. However, the efficiency may be affected by a small temperature increase due to electromagnetic losses induced by time-varying magnetic fields [1]. To minimize this, two approaches can be considered: reduce the losses or improve the heat exchange with the cooling environment. Although experimental and theoretical studies of the superconducting losses have been extensively pursued, few attempts have been made to combine the ‘losses’ and the ‘cooling’ aspects in the current scenario. Such studies require a detailed characterization of magneto-thermal interaction of the superconductors, as well as fundamental aspects of heat draining by the cryogenic fluid. The main aim of the present study is to understand properly the cooling efficiency of the cryogenic fluid in the presence of a heat source before moving to a more complex magneto-thermal analysis.
Heat transfer through natural convection continues to be an active research area, due to its significance for both fundamental interests and engineering applications. From practical and industrial points of view, the interest is justified by its many applications which include energy drying processes, cooling of heat-generating components in the electrical, nuclear and electronic industries etc. An extensive bibliography on natural convection in cavities up to 1988 may be found in the review article by Ostrach [2]. The majority of the published studies can be classified into two groups: enclosures heated from below and cooled from above (Rayleigh-Bénard problem) and differentially heated enclosures. Other articles on the topic published after 1988 show a relatively big interest in the studies of convective
for a variable fluid property with those of a constant property showed that, although the fluid flow and temperature fields seem to be different, the overall heat transfer is unaffected. The effect of horizontal heated strips at the bottom wall of an industrial glass melting tank was numerically studied by Sarris et al. [7] in two and three dimensions. Increasing the average temperature of the glass-melt, especially in the region above the cold bottom wall is of great practical importance to the glass industry. To improve internal natural convection heat transfer, Ngo and Byon [8] studied the effects of heater location and heater size in a 2D square cavity using finite element approach. Numerical results indicated that Nuave increases as the heater size decreases.
Considerable attention has been given to natural convection from vertical/horizontal enclosures specified either with constant temperature or heat flux. There is, however, a very limited number of studies on natural convection heat transfer from a heater specified with constant volumetric heat source placed above the horizontal plate [9]. The resulting characteristics of fluid flow and heat transfer are quite interesting and deserve a detailed investigation. The lack of research on this subject has motivated the present work. Towards this, 3D numerical model has been investigated to compare the in-house experimental flow features [10]. The governing equations and the solution methodology are discussed in Section 2. 3D analysis of fluid flow and heat transfer features inside the domain is presented in Section 3. Discussion in that section is further reinforced through usage of different coolants towards efficient cooling mechanisms. Finally, a summary and conclusion are presented in Section 4.
2 GOVERNING EQUATIONS AND SOLUTION METHODOLOGY 2.1 Governing equations
Three-dimensional incompressible steady state forms of fluid flow and heat transfer equation in an enclosed cavity is expressed in terms of Navier-Stokes equations. The governing equations in cartesian coordinates system are as follows [11]:
𝜕𝜕𝜕𝜕 𝜕𝜕𝜕𝜕+ 𝜕𝜕𝜕𝜕 𝜕𝜕𝜕𝜕+ 𝜕𝜕𝜕𝜕 𝜕𝜕𝜕𝜕 = 0 (1) 𝜌𝜌 �𝑢𝑢∂𝜕𝜕∂𝜕𝜕+ 𝑣𝑣∂𝜕𝜕∂𝜕𝜕+ 𝑤𝑤∂𝜕𝜕∂𝜕𝜕� = −∂p∂𝜕𝜕+ 𝜇𝜇∇2𝑢𝑢 (2) 𝜌𝜌 �𝑢𝑢∂𝜕𝜕∂𝜕𝜕+ 𝑣𝑣∂𝜕𝜕∂𝜕𝜕+ 𝑤𝑤∂𝜕𝜕∂𝜕𝜕� = −∂p∂𝜕𝜕+ 𝜇𝜇∇2𝑣𝑣 + 𝜌𝜌𝜌𝜌𝜌𝜌(𝑇𝑇 ℎ− 𝑇𝑇𝑐𝑐) (3) 𝜌𝜌 �𝑢𝑢∂𝜕𝜕∂𝜕𝜕+ 𝑣𝑣∂𝜕𝜕∂𝜕𝜕+ 𝑤𝑤∂𝜕𝜕∂𝜕𝜕� = −∂p∂𝜕𝜕+ 𝜇𝜇∇2𝑤𝑤 (4) 𝜌𝜌 �𝑢𝑢∂𝑇𝑇∂𝜕𝜕+ 𝑣𝑣∂𝑇𝑇∂𝜕𝜕+ 𝑤𝑤∂𝑇𝑇∂𝜕𝜕� = 𝛼𝛼∇2𝑇𝑇 + 𝑠𝑠, (5)
where, u, v and w refer to velocities in the three mutual directions, s is the heat source and p refers to the pressure. Other symbols have their usual meanings and are described in the nomenclatures.
2.2 Boundary conditions
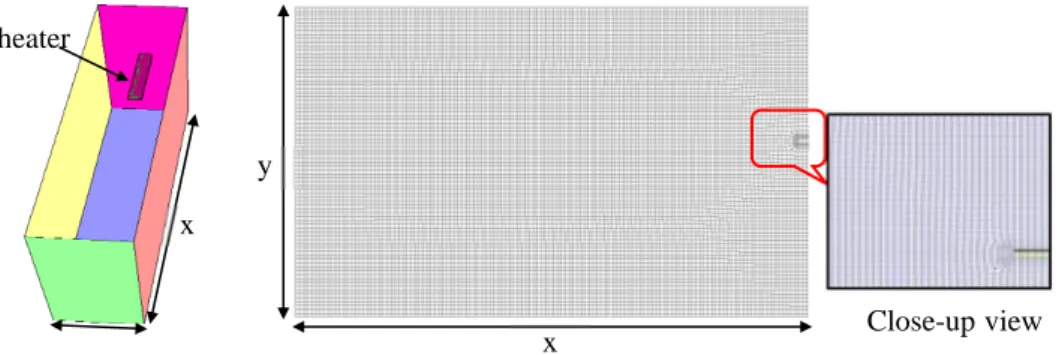
To get an insight about the actual flow features which occur in the experimental scenario [10], a complete 3D simulation has been investigated. The flow domain of interest with the global grid pattern is shown in Fig. 1. A close-up view of the mesh, reflects fine mesh closer to the heater surface.
Figure 1: Schematic of the numerical model with global grid patterns.
The length, width and height of the domain are 130 mm, 25 mm and 80 mm. A rectangular heater of dimension of 3˟4˟1 mm3 is placed at a distance of 45 mm from the bottom wall of
the computational domain. Taking computational cost into account, half domain symmetry is considered for the present analysis. Silicon oil is used as the coolant and copper (Cu) is used as the heated medium. Fluid properties are taken as constant except density which is modeled as Boussinesq approximation [12]. Constant material properties are considered for the heater. The boundary conditions used for the present analysis are as follows:
• symmetry is imposed on the wall attached to the heater
• adiabatic conditions with no-slip velocity condition are imposed on the bottom, left and the side walls of the domain
• top surface is maintained with a constant temperature boundary • constant volumetric heat source is specified for the heater 2.3 Numerical approach
The governing equations (1–5) are solved by a finite-volume method using general purpose CFD software [13]. Pressure-velocity coupling between the incompressible Navier-Stokes and continuity equations is solved using SIMPLE algorithm. First-order upwind scheme is chosen for momentum and energy discretization. To check the convergence, an error (ε) in the discretized momentum and energy equations are set using a tolerance criterion as, ε ≤ 10-5 and 10-10. Further details related to the flow solver and the discretization scheme are
available in detail in references [11]. For result analysis, contour and vector plots are drawn on the iso-surface passing through the middle of the numerical model as well as the heater surface (z = 0).
3 RESULTS AND DISCUSSION 3.1 Benchmark validation
Simulating the flow features is like an acid-test for a Navier-Stokes solver. Towards this, buoyancy driven flow in an enclosed cavity forms a good test case for the present validation [14]. 2D computational domain for the benchmark studies is schematically depicted in Fig. 2. heater x Close-upview x y
Figure 2: Computational domain of buoyancy driven cavity flow.
The problem refers to flow in a square cavity of length L. The dimension in the other direction is assumed infinite so that end effect can be disregarded. The vertical walls are maintained with different temperatures whereas, horizontal walls are maintained with adiabatic condition. No-slip velocity conditions are imposed on all the walls. Heat transfer through the walls causes density changes to the fluid inside the cavity and leads to buoyancy-driven circulation. The flow is assumed to be steady and laminar (Ra ≤ 106)
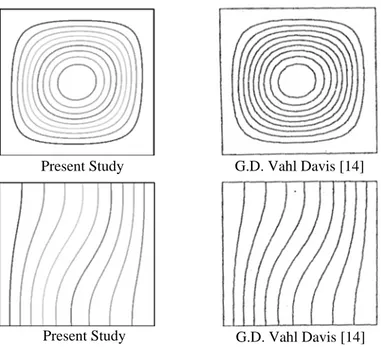
based on extensive studies [15]. Air is used as the simulant and the properties are taken at ambient temperature except density. Fig. 3 shows the stream function and isotherms for the present simulation against the reported result [14] at Ra = 10 . The comparison is further 3
reinforced through the Nuave (Fig. 4) along the hot wall for Ra = 103-105. Overall, an
excellent agreement is noticed between the present simulations against the reported results. 3.2 Mesh sensitivity analysis
In a CFD simulation, establishing mesh size towards independent nature of the solution is an essential first step. In this regard, an attempt is made to determine the optimum mesh for the present study. It is observed that the grid distribution from the heater surface is important for resolving the large temperature gradient across heater–fluid interfaces t. Towards this, appropriate number of mesh points with proper y+ value has been considered.
Different mesh sizes employed for the3D geometry are shown in Table 1.
It can be noticed that, the difference of the maximum velocity magnitude above the heater for mesh M2 and M3 are small. Although the change is small but the computational effort is significantly higher for M3 as compared to M2, hence mesh M2 will be used for further investigations. The percentage of deviation between the present study (M2) against experimental value is less than 10%. Fig. 5 shows close-up view of the contours of velocity magnitude above the heater for the optimized mesh M2. Maximum velocity occurs adjacent to the symmetry plane which is similarly observed in the experiment.
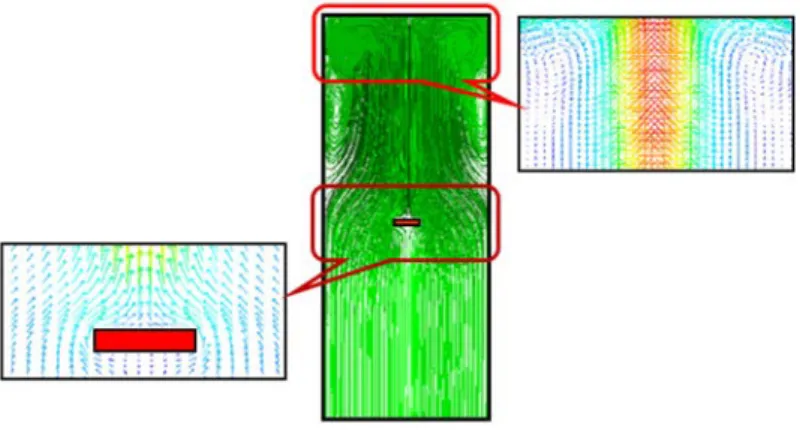
The flow just above the heated strip ascends towards the cold free surface, then moves horizontally towards the top corner of the tank, descends to the bottom of the cavity and finally returns to the heated strip region (Fig. 6). Here, the circulations appearing in the cavity are lifted up, and their centers are close to the top wall (cold wall) as evident from the figures. This is due to dominance of convection over conduction (high value of Nuave).
Below the heater, the flow is not much affected as that of top and remains stagnant due to the no-slip conditions
.
L
L
x Tc
Figure 3: Streamlines (top) and the isotherm (bottom) contours for Pr = 0.71, Ra = 103.
Figure 4: Comparison of Nuave as a function of Ra with Pr = 0.71.
Table 1: Mesh Sensitivity Study. Mesh Total number of
control volumes Max Velocity (mm/s) M1 679 720 5.38 M2 1 156 120 5.44 M3 1396 120 5.45
Present Study G.D. Vahl Davis [14]
Figure 5: Velocity magnitude (m/s); (left) present study and (right) PIV (Particle Image Velocimetry) measurement.
Figure 6: Path lines on the mid plane (z = 0) for 3 mm heater length.
Figure 7: (left) static temperature (K) and (right) pressure (Pa) distribution on the mid plane (z = 0); same scale is used as Fig. 6.
From Fig. 7, it is observed that, two separate regions, a cold uniform temperature region and a hot region exist across the system. The top, side and the bottom walls not covered by the heated strip have almost the same (low) temperature whereas the temperature gradients
are concentrated just above the heated strip, where a thermal plume is formed. The rising fluid in the thermal plume will have to return to the bottom to replace that already risen, resulting in a recirculation pattern. Gradual variation of maximum (bottom) to minimum (top) static pressure distribution is noticed as expected due to buoyancy induced flow. To analyze the effect of heater width on the flow structures, flow profile as viewed from the symmetry plane is presented in Fig. 8. Flow bypass occurs along both sides of the heater resulting two symmetric convective Bénardʼs cells.
3.3 Extended heater lengths
To study the effect of heater length on the heat transport, different heater lengths were analyzed in three-dimension, keeping width (z) and height (y) of the heater dimension intact. Equivalent heat source is adopted so as to keep the total heat generated (Watts) constant as shown in Table 2.
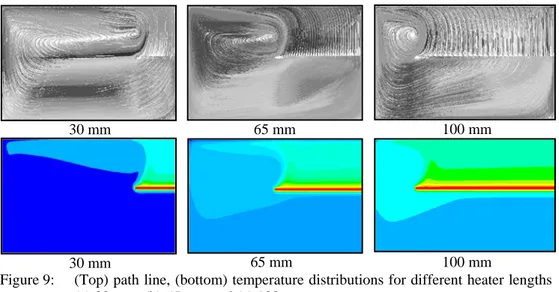
Fig. 9 depicts the path lines on the mid-plane for 30, 65 and 100 mm heater lengths. The flow patterns are not affected significantly with increase in heater length, but the maximum vertical velocity decreases. In this scenario, the flow is drawn inwards from the edge of the heater forming boundary layers along its surface which may meet somewhat far from the symmetry wall before they turn through a right angle and form a circulation. As the heater length increases, the flow tries to confine itself in the space between the heater and the sidewall, a behaviorwhich differs from that of 2D studies (not shown). Maximum velocity occurs at a distance far from symmetry plane which is against 2D simulation, where maxima occur along the symmetry axis for all the aspect ratio.
Figure 8: Numerical velocity profile, viewed from the symmetry plane (x = 0).
Table 2: Heat source supplied to the heated strip. Heater Length (x) in mm Heat Source (W/m3)
3 9.792E5
30 9.792E4
65 4.519E4
Figure 9:
(Top) path line, (bottom) temperature distributions for different heater lengths (a) 30 mm, (b) 65 mm and (c) 100 mm.
Table 3: Analysis on different heater lengths. Heater Lengths (mm) Maximum Velocity (m/s) Maximum Temp. difference (K) Nuave 3D 3 0.0054 1.520 57.6 30 0.0019 0.312 31.4 65 0.0013 0.191 23.9 100 0.0011 0.150 19.8
The temperature distribution is completely controlled by the thermal plume position. As the heater length increases, the heating rate increases together with the thickness of the thermal boundary layer. The maximum temperature difference across the fluid decreases with respect to the heater lengths, thereby reflecting an increasing importance of conduction with respect to convection (Nuave decreases). Table 3 presents the comparative analysis for
different heater lengths.
To account for the heat transport to the fluid medium, the average Nuave is estimated
on the heater surface and is depicted in Fig. 10. The evaluation is based on a suitable characteristic length “Lc”(distance from the heater to the top wall = 34 mm)
and is as follows;
𝑁𝑁𝑢𝑢𝑎𝑎𝜕𝜕𝑎𝑎=𝑞𝑞 ,𝐿𝐿𝑐𝑐
∆𝑇𝑇𝑇𝑇, (6)
where, q′ represents the average heat flux, ΔT is the maximum temperature difference across the fluid and K is thermal conductivity (W/m-K) of the fluid. It is seen that, the average heat flux emanating from the heater surface increases for short heater lengths and also the value of the average Nuave. This shows that for small heater lengths, the heat
transfer occurs with little thermal conduction in the system and yields efficient cooling. Further increases of the heater lengths will be counterproductive as it shows more mixing
30 mm 65 mm 100 mm
100 mm 65 mm
rather than cooling. By contrast, when the heated strip covers the entire tank width, the Nuave will attain the value 1, i.e., the heat transfer will be merely a conduction process.
Hence, usage of smaller heater will be an efficient way of heat transport. The maximal temperature difference gradually decreases w.r.t. increasing heater lengths, but the decrease is much higher than that of 2D cases. The heater strip width affects strongly the temperature distribution within the fluid.
3.4 Effect of coolant
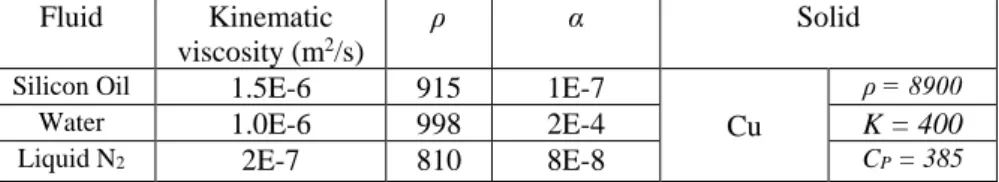
Analyses on different coolant mediums are further investigated to study the efficient cooling mechanisms for industrial applications. In this case three different coolants viz., silicon oil, water and liquid nitrogen (N2) are considered for the present studies. The
properties are taken at the ambient temperature (properties of liquid N2 is considered at
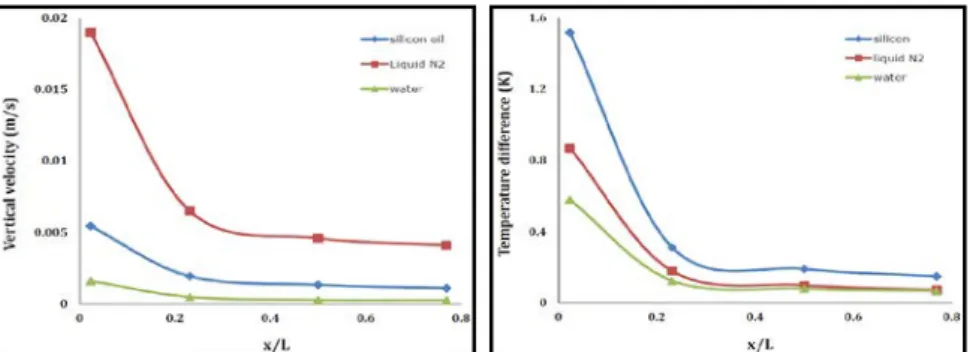
cryogenic temperature i.e. 77K). The maximum vertical velocity distribution above the heater surface for different fluids is plotted in Fig. 11.
It is observed that, the position of maxima occurs near to the top surface for liquid N2
and subsequently lowered for silicon oil and water due to the density differences. Also, the velocity magnitude is high for liquid N2 and gradually decreases with respect to the heater
lengths for all the cases (Fig. 12). Similar trends are also observed for the temperature.
Figure 10: (Left) Temperature and (right) average heat flux for different x/L (x=heater length, L = domain length); with silicon oil.
Figure 12: (Left) velocity and (right) temperature magnitudes for different (x/L); side lines are graphs for the eyes.
Figure 13: Variation of Nuave with Ra.
The influence of Ra on Nuave for different fluids has been drawn in logarithmic scale
(Fig. 13). A constant correlation is observed between Nuave and Ra, with Nuave ~ Ra0.374,
indicating that the heat transfer is an increasing function of Ra as reported in the literature [15].
4 SUMMARY AND CONCLUSIONS
Buoyancy induced flow and heat transfer in a rectangular enclosure in the presence of a constant heat source is numerically studied. The continuity, momentum and the energy equations are solved through finite-volume approach using commercial CFD software. Benchmark validation for natural convection in a square enclosure is found to be satisfactory. Detailed flow and thermal behaviors inside the domain are presented through isotherm contours, velocity vectors and path line profiles. Flow bypass occurs on lateral sides of the heater, resulting in symmetric convective cells. The effect of the heater aspect ratio on the rate of heat transfer is studied for both 2D and 3D computations. The results indicate that, an effective heat transfer enhancement occurs for small heater lengths, resulting in an efficient cooling. Increasing heater lengths will be counterproductive towards cooling, rather more on mixing. Temperature as well as velocity magnitudes decreases faster in 3D than 2D studies, presumably due to the essential effect of the heater width. Further analysis on different types of coolant reveals a constant correlation between Nuave and Ra, with Nuave ~ Ra0.374.
Table 4: Properties. Fluid Kinematic
viscosity (m2/s) ρ α Solid
Silicon Oil 1.5E-6 915 1E-7
Cu
ρ = 8900
Water 1.0E-6 998 2E-4 K = 400
Liquid N2 2E-7 810 8E-8 CP = 385
NOMENCLATURE Cp specific heat (j/kg-k)
g acceleration due to gravity (m/s2) Tc temperature of cold surface
Th temperature of hot surface
β coefficient of thermal expansion (1/K) α thermal diffusivity (m2/s) µ dynamic viscosity (kg/m-s) ρ density (kg/m3) s source term Ra Rayleigh number �𝜌𝜌𝜌𝜌𝜌𝜌∆𝑇𝑇𝐿𝐿𝑐𝑐3 𝛼𝛼𝛼𝛼 � ACKNOWLEDGEMENTS
The research was funded through the University of Liege and an ARC grant for Concerted Research Action, financed by the French Community of Belgium (Wallonia-Brussels Federation), under reference ARC 11/16-03.
REFERENCES
[1] Carr Jr., W.J., AC Loss and Macroscopic Theory of Superconductors, Taylor & Francis: New York, 2001.
[2] Ostrach, S., Natural convection in enclosures. J. Heat Transfer, 110, pp. 1175–1190,
1988.
[3] Torrance, K.E. & Rockett, J.A., Numerical study of natural convection in an enclosure with localized heating from below-creeping glow to the onset of laminar instability. J. Fluid Mech., 36, pp. 33–54, 1969.
[4] Pretot, S., Zeghmati, B. & Palec, G.L., Theoretical and experimental study of natural convection on a horizontal plate. Appl. Thermal Eng., 20, pp. 873–891, 2000.
[5] Sezai, I. & Mohamad, A.A., Natural convection from a discrete heat source on the bottom of a horizontal enclosure. J. Heat Mass Transfer, 43, pp. 2257–2266, 2000.
[6] Emery, A.F. & Lee, J.W., The effects of property variations on natural convection in a square enclosure. J. Heat Transfer, 121, pp. 57–61, 1999.
[7] Sarris, I.E., Lekakis, I. & Vlachos, N.S., Glass melt recirculation controlled by a heated strip in the tank bottom. Proc. of 1st Balkan Conf. on Glass, Volos, Greece,
pp. 379–388, 2000.
[8] Ngo, I. & Byon, C., Effects of heater location and heater size on the natural convection heat transfer in a square cavity using finite element method. J. of Mech. Science and Tech., 29(7), pp. 2995–3003, 2015.
[9] Ha, M.Y. & Jung, M.J., A numerical study on 3D conjugate heat transfer of natural convection and conduction in a differentially heated cubic enclosure with a
heat-[10] Dubois, C., Duchesne, A., Vanderheyden, B., Vanderbemden, P. & Caps, H., Locally induced laminar convection in liquid nitrogen and silicone oils. Eur. Phy. J. E, 39: in press, 2016
[11] Patankar, S.V., Numerical heat transfer and fluid flow, Hemisphere Publishing Corporation, Washington DC, 1980
[12] Boussinesq, J., Theorie analytique de la chaleur, Paris, 2, 1903. [13] ANSYS 15, User Guide, Ansys, Inc., Lebanon, US, 2012.
[14] Vahl Davis, G.D., Natural convection of air in a square cavity-a benchmark solution. Int. J. Numer. Meth. Fluids, 3, pp. 249–264, 1983.
[15] Markatos, N.C. & Pericleous, K., Laminar and turbulent natural convection in an enclosed cavity. Int. J. Heat Mass. Tran., 27(5), pp. 755–772, 1984.
[16] Fusegi, T., Hyun, J.M., Kuwahara, K. & Farouk, B., A numerical study of three-dimensional natural convection in a differentially heated cubical enclosure. Int. J. Heat Mass. Tran., 34(6), pp. 1543–1557, 1991.
[17] Khanafer, K., Vafai, K. & Lightstone, M., Buoyancy-driven heat transfer enhancement in 2D enclosure utilizing nanofluids. Int. J. Heat. Mass. Tran., 46(19), pp. 3639–3653, 2003.