HAL Id: hal-02328655
https://hal.archives-ouvertes.fr/hal-02328655v2
Submitted on 27 May 2021HAL is a multi-disciplinary open access archive for the deposit and dissemination of sci-entific research documents, whether they are pub-lished or not. The documents may come from teaching and research institutions in France or abroad, or from public or private research centers.
L’archive ouverte pluridisciplinaire HAL, est destinée au dépôt et à la diffusion de documents scientifiques de niveau recherche, publiés ou non, émanant des établissements d’enseignement et de recherche français ou étrangers, des laboratoires publics ou privés.
Convective drying of a porous medium with a paste
cover
N. Ben Abdelouahab, A. Gossard, Stéphane Rodts, B. Coasne, Philippe
Coussot
To cite this version:
N. Ben Abdelouahab, A. Gossard, Stéphane Rodts, B. Coasne, Philippe Coussot. Convective drying of a porous medium with a paste cover. European Physical Journal E: Soft matter and biological physics, EDP Sciences: EPJ, 2019, 42 (5), �10.1140/epje/i2019-11829-4�. �hal-02328655v2�
HAL Id: hal-02328655
https://hal.archives-ouvertes.fr/hal-02328655
Submitted on 6 Aug 2020HAL is a multi-disciplinary open access archive for the deposit and dissemination of sci-entific research documents, whether they are pub-lished or not. The documents may come from teaching and research institutions in France or abroad, or from public or private research centers.
L’archive ouverte pluridisciplinaire HAL, est destinée au dépôt et à la diffusion de documents scientifiques de niveau recherche, publiés ou non, émanant des établissements d’enseignement et de recherche français ou étrangers, des laboratoires publics ou privés.
Convective drying of a porous medium with a paste
cover
Nidal Ben Abdelouahab, Alban Gossard, Stéphane Rodts, Benoit Coasne,
Philippe Coussot
To cite this version:
Nidal Ben Abdelouahab, Alban Gossard, Stéphane Rodts, Benoit Coasne, Philippe Coussot. Convec-tive drying of a porous medium with a paste cover. European Physical Journal E: Soft matter and biological physics, EDP Sciences: EPJ, 2019, 42 (5), �10.1140/epje/i2019-11829-4�. �hal-02328655�
1
Convective drying of a porous medium with a paste cover
N. Ben Abdelouahab1,2, A. Gossard2, S. Rodts1, B. Coasne3, P. Coussot1
1 Univ. Paris-Est, Laboratoire Navier (ENPC-IFSTTAR-CNRS), 77420, Champs sur Marne, France 2 CEA, DEN, Univ Montpellier, DE2D, SEAD, Laboratoire des Procédés Supercritiques et de
Décontamination, Marcoule, 30207 Bagnols-sur-Cèze, France
3 Univ. Grenoble Alpes, CNRS, LIPhy, 38000 Grenoble, France
Abstract: The convective drying of a composite system made of a porous medium covered with a paste is a situation often encountered with soils, roads, building and cultural heritage materials. Here we discuss the basic mechanisms at work during the drying of model composite system made of a homogeneous paste covering a simple granular packing. We start by reviewing the rather well-known case of the convective drying of a simple granular packing (i.e. without paste cover), which serves as a reference for physical interpretations. We show that a simple model assuming homogeneous desaturation then progressive development of a dry front from the sample free surface is in agreement with observations of the internal liquid distribution variations in time. In particular, this model is able to reproduce the saturation vs time curves of various simple granular systems, which supports our understanding of physical mechanisms at work. Then we show the detailed characteristics of drying of initially saturated model composite systems (with kaolin or cellulose paste) with the help of MRI measurements providing the liquid distribution in the sample at different times during the process up to the very last stages of drying. It appears that the granular medium is unaffected (i.e. remains saturated) during an initial period during which the paste shrinks and finally forms a sufficiently rigid porous structure which will not any more shrink later on. Then the drying process is governed by capillary effects down to very low saturation. Over a wide range of saturations both media desaturate homogeneously (within each medium) at different rates which depend on the specific porous structure of the media, so as to maintain capillary equilibrium throughout the sample. During these different stages the drying rate of the whole system remains constant. For sufficiently low saturation in the paste a dry front can develop, both in the paste and the porous medium below, and the drying rate now decreases. These results show that in a drying composite system liquid extraction can occur more or less simultaneously in the different parts of the material up to the very last stages of drying. The corresponding evolution of the distributions of liquid in the different parts of the sample also provides key information for the prediction of ion or particle transport and accumulation in the different parts of a composite system.
1. INTRODUCTION
Drying plays a major role in various industrial and environmental processes involving materials initially containing liquid such as cosmetics, soils, plasters, paints, paper, textiles, food products, agricultural products, etc. Although understanding and controlling this process are critical for minimizing energy consumption and/or controlling the final material properties, its scientific description remains challenging as it involves a transient and spatially heterogeneous phase transition. Direct modelling approaches were developed, leading to a system of several partial differential equations in time and space involving a series of more or less adjustable parameters [1-3], so that the ability of such approaches to understand drying physics remains questionable. On the other side, basic phenomenological mechanisms of drying in simple solid porous systems initially filled with pure liquid and in the absence of gravity effects have been identified [4-10]. First, a more or less long constant (drying) rate period (CRP), with a homogeneous desaturation of the medium, occurs. In this regime
2 capillary equilibration processes allow for water redistribution throughout the medium so that the saturation (i.e. liquid to void volume ratio) decreases uniformly [4, 11-14]. This is generally followed by a falling-rate period (FRP) associated with the development of a heterogeneous profile of saturation [4, 11-14]. It is considered that the onset of this effect results from a demand of liquid, through the imposed evaporation rate at the free surface, larger than the liquid transport induced by a gradient of capillary pressure within the porous system [7, 9, 15].
The mechanism assumed to govern this second regime is the inward growth of a dry region from the sample free surface [4, 7, 9-10, 15], which is apparently confirmed by some external observations for large systems [16-17]. Under this assumption, after some transient stage, the drying rate would be controlled by vapor diffusion from the wet front to the free surface of the sample. This leads to a mass loss varying with the square root of time (see below), in agreement with some observations [13, 15, 18-20].
The description above corresponds to a homogeneous porous medium, but there are also various situations in which the porous medium is made of layers of different characteristics. This is for example the case with some soils, roads, or building structures coated with mortar or plaster layer. Such structures are submitted to imbibition-drying cycles which can lead to the transport and accumulation of particles or ions which can then affect the properties of the structure. One original application is the poultices used for removing salts from cultural heritage [21-22]. In that case a layer of wet paste (poultice) is coated to the wall, so that the water first penetrates it and, is then removed during drying; it is expected that it will transport salts towards the poultice during the latter stage.
Existing knowledge of the mechanisms of drying of such “composite” systems, made of a paste, i.e. a widely deformable material, over a solid porous medium, is limited. We can certainly expect that a major role will be played by capillary effects which will tend to impose some specific distribution of liquid according to the different pore sizes in the different parts of the system [23]. This effect was for example observed during drying of systems made of two or three layers of bead packings with different bead sizes [11] and submitted to an air flux along the top surface: the water is removed from the layer made of the largest beads, whatever its position with regards to the sample free surface. Direct observations by MRI (Magnetic Resonance Imaging) [24] of the liquid distributions were also carried out with systems closer to real ones, i.e. with a poultice made of a clay-water matrix mixed with sand (upper layer), above a simple granular medium (lower layer). During drying the liquid appeared to be extracted first either from the upper or from the lower layer, but no clear explanation was found. In fact the paste in the upper layer, containing both a colloidal suspension and a high concentration of grains, is a complex material the drying characteristics of which depend on the relative concentrations of the different elements and the type of interactions between the particles of the paste [13]. Finally, various experiments showed indirectly the existence of liquid transport between two porous media in contact, through the salt redistribution [25]. On another side, the drying of a composite system is a situation to which the drying of a layer of material made of deformable particles (latex, droplets) may naturally lead [26-27]: the extraction of liquid from the regions close to the free surface induces a compression of the material and thus a decrease of the liquid content, while the lower regions may remain at the initial concentration. However, in that case the system possibly made of two regions of different liquid content is the result of a coupling between capillary effects and the mechanical properties of the materials in each region, and the boundary between these two regions can continuously evolve during the test, which adds a degree of complexity.
Here we intend to get some clear observations of the main effects occurring during the drying of composite systems (paste over granular packing) with a fixed boundary between the two domains. In that aim we will observe the detailed characteristics of drying of model composite systems with the help of MRI measurements providing the liquid distribution in the sample at different times during the process up to the very last stages of drying. We start by presenting the materials and procedures. Then, to facilitate the physical interpretation of data we first review our knowledge of the mechanisms of
3 drying of simple (homogeneous) porous media, through an analysis of MRI and macroscopic data. Finally we present and discuss detailed observations of the drying of two composite systems.
2. MATERIALS AND METHODS
2.1 Materials
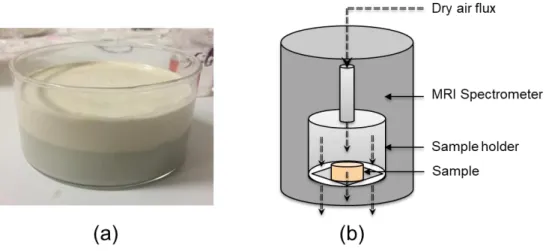
The clay paste is made of kaolinite platelet particles about 1 m long (supplied by Sigma-Aldrich) dispersed in water at a weight solid fraction of 50%. The typical pore size of the dried paste is around 0.5 µm (see Appendix A). The cellulose paste is made of cellulose fibers (Arbocel® BC 1000 fiber length 700 µm and thickness 20µm, supplied by Kremer-Pigmente) mixed with water at a mass fraction of 7% (cellulose to water mass ratio) (see Appendix B). The initial porosity is about 85%. The mean pore size of the dried system is 30 µm, which gives the typical pore size of this material at the end of shrinkage. For the MRI experiment we used glass bead packings, with a solid volume fraction of ∅ = 60%, made of beads of diameter ranging from 45 µm to 90 µm.We cleaned the beads by dispersing them in a solvent (isopropanol) under mechanical stirring at room temperature for 2h, then the solvent was removed. The same cleaning procedure was repeated with another solvent (acetone). The glass beads were then rinsed with distilled water to remove remaining solvent and dried in oven at 70°C for 12h. The beads were then packed in a cylindrical glass dish (𝐷 = 9𝑐𝑚, 𝐻 = 5𝑐𝑚) up to a height of 2.3 cm. This substrate was imbibed by distilled water under vacuum until saturation. Then the paste was coated over the substrate surface (see Fig.1a) so as to form a layer of approximately uniform thickness of 1.7 cm. Under these conditions, only the top surface of the paste is in contact with air. We then induce a constant dry air flux (relative humidity below 0.5%) vertically against the sample free surface and we follow the water amount distribution in time with NMR (see Fig.1b). Such a set-up is in fact a model system of the poultices applied to walls of cultural heritage to clean them [21-22].
Figure 1: (a) Kaolin paste (upper region) coated on substrate surface (lower region) in the container. (b) Scheme of the drying set-up used inside the MRI spectrometer.
We also carried out some drying tests with simple bead packing samples directly submitted to an air flux along their top surface, and following (by continuous weighing) the mass evolution during the process. The drying rate in the initial stage could be varied by varying the air flux, but the relationship between the two variables is not straightforward, the drying rate depending on the details of the interaction between the air flux and the specific shape of the sample and the details of its surface
4 roughness. As a consequence, in the following, for each test presented, we do not indicate the value of the air flux velocity, which is not really meaningful, but rather the value of the resulting, initial drying rate, which constitutes a straightforward physical characteristics of the test.
2.2 Physical analysis of the drying process
First we define the drying rate (or drying velocity), i.e. V, as the liquid volume crossing the sample (top) free surface cross-section (of area
S
) per unit time and unit surface. Since the liquid can only be extracted from the sample volume by moving, in the form of vapor, through this free surface, the mass conservation implies that V = 1−( )
S d dt, in which
is the current liquid volume inside thesample. Note that in this approach we neglected the mass of vapor compared to the mass of liquid in the porous medium, which is justified by their very large density difference. Besides we can express the liquid volume with the help of the (mean) saturation (
) in the sample, defined as the liquid to pore volume ratio: =HS, where
is the sample porosity andH
the sample height (or thickness), which gives the following expression for the drying rate:t H
V =− d d (1)
It is worth noting that in this expression the value of the area of the sample cross-section does not play any role. This results from our implicit assumption that at any time the physical processes at any point in a given cross-section are identical. Thus, as far as possible, it is important to check that no significant heterogeneity develops, which could preclude a relevant interpretation of data. Note also that our description of the processes with variables (see above and below) also implicitly relies on a continuum assumption, which in particular requires that the characteristic length of the sample in any direction be much larger than the pore size.
The impact of gravity effects may be appreciated by comparing the typical capillary stress in the partially saturated sample, i.e. r, with the surface tension and r, a typical radius of curvature of the liquid-air interfaces (for example we can consider that at the beginning of the desaturation r R 3
with
R
the average bead radius, and then smaller values for r are obtained for lower saturation), to the characteristic stress due to gravity, i.e. gH , with
the liquid density andg
the gravity. In our tests the ratio between the capillary stress and the gravity stress is much larger than 1, indicating that gravity effects are negligible in all our tests (in the typical case of 62 m beads with a sample thickness of 2 cm this ratio is 35).2.3 MRI Measurements
We look at the evolution of the water distribution in time with the help of MRI (Magnetic Resonance Imaging) measurements, either from qualitative 2D images of a sample cross section along the vertical axis, or from quantitative 1D projections of the liquid content on the vertical axis, hereunder referred to as 1D profiles, where each data point represents the integrated NMR signal (proportional to the water mass) in a 1 mm thick layer.
All measurements are performed at a 24/80 DBX 0.5-T 1H MRI spectrometer by Bruker (20 cm open
diameter in the sample area), operating at 20MHz. During the whole drying process, which usually took 2 weeks, the sample was simply left at the magnetic center of the MRI system under a descending vertical dry air flux.
5 Profile measurements
The distribution of apparent water along the sample vertical axis (z) were measured by means of the Single Point Imaging (SPI) sequence [28-29]. Among some other purposes such as removing susceptibility and chemical shift artifacts, this sequence is also usually dedicated for studying materials with very short spin-spin T2 relaxation times. , i.e. shorter than typically 1ms. It was chosen here instead
of the more classical spin-echo sequences because small relaxation times were likely to occur in our samples at the very end of the drying process, when the water amount becomes very small.
Our implementation follows that of [30], which allows the recording of a series of NMR profiles as a function of
over some time interval. The signal is further extrapolated based on an exponential model to provide a profile s0 compensated for the effect of spin-spin relaxation and possibly fieldinhomogeneities:
s
(
=
)
s
0exp
( )
T
2* . Although the monoexponential relaxation can only be anapproximate hypothesis, this type of extrapolation can however be shown to provide a reliable estimate of the amount of water present even in slight multiexponential cases. We then yield the distribution of water in small cross-section layers (1mm thickness) along the sample axis at different positions and time.
The sequence tuning used a field of view of 6 𝑐𝑚 and 60 pixels that is a space resolution of 1 mm. The duration of the hard Radio Frequency pulse was 10 µs, yielding a tilt angle for the spins of
= 8. 30 values of
were recorded between 𝜏𝑚𝑖𝑛= 300 µ𝑠 and 𝜏𝑚𝑎𝑥= 590 µ𝑠. The recycling time TR wasset to 500 ms, essentially due to hardware limitation, and prevented any saturation of the NMR signal owing to slow spin-lattice relaxation at the early stage of the drying process, where the T1 values in the
paste and the beads were measured at 100 ms and 220 ms respectively. The whole profiling process was repeated 16 times on purpose of phase cycling and signal accumulation, and lasted about 8 min. Note that measured profiles do not simply indicate the water amount, but are also sensitive to the geometry of the sample and its container. In particular, at the end of their preparation, due to the meniscus effect and the container shape, the sample top and bottom are slightly curved, which induces the appearance of ramps on the profiles, i.e., a progressive decrease of the NMR signal over the millimeter order even if the saturation in the sample is homogeneous.
Imaging
2D Images were obtained in a vertical (radial) cross section of the sample by means of a spin-echo sequence with a slice selection [31]. The measurements are qualitative, and weighted by spin-spin relaxation so as to well observe the various parts of the sample. The signal intensity on the MRI picture is therefore not directly proportional to the local water amount, but reads instead
) / TE exp( 2 0 T s
s= − . Since T2 in a desaturating porous medium is a growing function of the water
amount, the image intensity however remains a growing function of the water amount for interpretation.
The sequence tuning used a vertical and horizontal (read out) field of views of 6.5cm and 20cm respectively, with a space resolution of 1mm in both directions. The slice thickness was 1cm. The whole imaging process was repeated 8 times on purpose of phase cycling and signal accumulation, with TR=1s and TE=4.2ms, and lasted about 9 minutes.
3. RESULTS AND DISCUSSION
3.1 Drying of a homogeneous bead packing
Let us start by reviewing typical observations for the drying of a bead packing directly submitted to an air flux along its top surface. In that aim we may refer to the detailed liquid distributions in time provided by [18] for a series of bead packings with bead size ranging from a few nanometers to a few
6 tens of microns. For bead size larger than 80 nm the set of liquid profiles in times have similar qualitative characteristics [18]. During a first period the saturation profiles remain parallel to each other and almost horizontal, which means that the saturation decreases while remaining uniform throughout the sample. Then, the edge (towards the sample top) of the saturation profile curves and tends to zero at some finite distance from the sample top, so that some (apparently) dry region appears above this distance, while the saturation in the rest of the sample remains approximately uniform; the thickness of this dry region increases in time (see inset of Fig.2). It is worth noting that in this regime, in the region of uniform saturation there is still some slow decrease of the saturation level in time. In Figure 2 we plot the liquid mass, represented through the saturation as a function of time for this experiment. Note that here the liquid mass at different times was deduced from its initial value (found by sample weighing) and the integration of the NMR signal, a priori proportional to the water content, over the successive profiles. Two main regimes clearly appear. In a first period (Constant Rate Period, or CRP) the saturation decreases linearly, then, below a critical saturation (0), it starts to decrease
much more slowly; this second stage corresponds to the Falling Rate Period (FRP). It is remarkable that the CRP corresponds exactly to the period during which the saturation profiles remain uniform, while the FRP is associated with the development of a dry front and thus the end of the homogeneous desaturation of the sample. This correspondence is illustrated by the location of the transition seen in MRI profiles placed in the saturation vs time curve (see Fig.2). Another approach for discussing the transition consists to follow the rate of drying, determined from the derivative of the saturation vs time curve. This approach appears to be fully consistent with the above observations: the location of the transition determined from MRI data correspond exactly to the location of the change in slope of the drying rate curve, i.e. the regime change (see Fig.2).
0 500 1000 0,0 0,5 1,0 0,0 0,5 1,0 10-4 10-3
1 (min ) − -10 -8 -6 -4 -2 10-2 10-1 100 NMR s ignal (a.u.) Position (mm)
(min)
t
Figure 2: Drying of a (1 m) bead packing submitted to an air flux: saturation vs time as deduced from the integration of the NMR profiles shown in the top right inset (data from [18]). Here the critical saturation for the transition between the CRP and the FRP regimes is 0 =0.17 (indicated by a grey disk). The continuous line corresponds to the saturation
evolution deduced from the model given by equation (4). The bottom left inset shows the drying rate as a function the saturation, computed from the data of the main graph.
7 Let us now attempt to explain these observations. Drying relies on the evaporation from liquid-air interfaces. As soon as the porous medium is partially saturated, liquid water and vapor coexist inside the sample. In general drying is sufficiently slow for the dynamical effects to be relevantly considered as quasi-static, which here means that the liquid and vapor transports at a given time can be estimated by assuming that the main (other) characteristics of the system remain constant. Thus, we can discuss the evaporation process from the sample during the CRP: since the sample is partially saturated over all its height, there are liquid-air interfaces at any point in the sample so that evaporation can a priori take place everywhere; however, since during some elementary drying process the liquid-air interface can be considered as fixed, a vapor transport towards the sample top (exit) can only occur as a result of a vapor gradient. Since air volumes sufficiently far from the sample top are surrounded by liquid-air interface, the maximum vapor pressure is likely reached in these regions, so that there is no vapor density gradient able to induce a diffusive vapor transport towards the sample exit. As a consequence, the liquid-air interfaces surrounded by static vapor at the maximum pressure do not evaporate, and only liquid-air interfaces situated close to the sample free surface significantly evaporates. A demonstration of this effect by numerical simulation was provided in [32]: in a thin tube initially filled with water and closed at one side, and open on the other side, the vapor pressure is uniform all along the tube as long as the sides of this tube are covered with a liquid film as a result of homogeneous desaturation, and decreases only at a short distance from the channel exit, where most of the evaporation takes place.
Another way to think about these results is to consider the liquid phase. Since the saturation is uniform and the sample is homogeneous, the capillary pressure is uniform through the sample. Moreover, as time goes on, the saturation decreases but remains uniform. This means that as soon as some liquid is withdrawn somewhere, immediately the liquid distribution adjusts throughout the sample in order to maintain the uniformity of the capillary pressure. Since the liquid can exit from sample only at its top, this implies that the liquid is extracted in this way, by evaporation from the sample top.
To sum up, during the CRP, in such a system, the evaporation occurs essentially from the liquid-air interfaces situated around the sample top, and the liquid is progressively transported towards the region of evaporation, through capillary re-equilibration processes. Such a conclusion is not new (see e.g. [4, 7, 33]), but reviewing how it can be demonstrated from our observations provide useful arguments for the analysis of the drying of a composite system.
Let us now see how the constant rate of drying in this regime can be explained. For a planar liquid-air interface (along which the relative humidity (RH) is n=1) situated at a distance
from a region where the relative humidity is fixed at n0, the second Fick’s law (2 2 x n D t n =
, with
D
the diffusioncoefficient) tells us that in steady state (n t=0) the gradient of relative humidity is uniform and
constant. Under these conditions, from the first Fick’s law, the flux of vapor, expressed as a liquid velocity, i.e. the drying rate, writes
D n V = 0 0 0 (2) with here n=1−n0, -1 2 5 0 2.7 10 m .s − =
D the water vapor diffusion coefficient in air,
-3 0=23.4g.m
the maximum vapor density in air (at 25°C), and
the liquid density. The evaporation from the more complex liquid-air interfaces around the free surface of a wet porous medium submitted to an air flux (in which the relative humidity is n0) is obviously more complex.However, the general mechanism is the same as for a simple planar interface: the air flux forms a region of exchange through which the vapor is transported, the size of this region depends on the
8 boundary conditions for this air flux, including the detailed shape (roughness) of the free surface of the sample; the liquid evaporates from the different liquid-air interfaces depending on the exact distribution of relative humidity in the surrounding air, then the vapor is transported towards the air flux region where n =n0. Finally we can consider that the same type of law as above (2) will be valid
with now
being a “hydraulic resistance » of the medium [34], which here encompasses both the air flux characteristics and the structure of the porous medium. For models materials, made of dispersed similar liquid patches over a planar surface, this hydraulic resistance has been quantified in details through numerical simulations [35-36]. Here we will not discuss further that point, we will simply consider
as given by the characteristics of the system (including the air flux). A fundamental point is then to remark that, in order to get a constant drying rate in the first regime, it is necessary to assume that these structure characteristics do not vary significantly [33], so that
can be considered as constant. Note that in fact, in some cases, a slight decrease of the drying rate is observed in this regime, but we will neglect this aspect for modelling. Finally, under these conditions, we can express
as a function of the initial drying rate, which, for n0 =0 (dry air flux above the sample), gives(
0 )
D0 V0 = .
According to this analysis it is natural to consider that the second regime of drying, associated with a significant change of the drying rate, corresponds to a significant change of the distribution of liquid-air interfaces around the sample free surface. Actually, it is observed that this corresponds to the development of a dry front, which means that capillary effects are no more able to supply sufficiently rapidly some liquid in order to replace the evaporated liquid at the sample top. There exist some attempts to quantify this effect, either through a comparison of characteristic velocities [7] or characteristic lengths [33], taking into account the permeability of the medium under partially saturated conditions. Note that such further developments might provide some elements to predict the critical saturation associated with the transition from the CRP to the FRP, which appears to vary around 0.1 (see below) in our different tests, and very slowly increases with the bead size [18]. However, this is out of the scope of our study which focuses on the basic mechanisms of drying of composite samples, and we will simply consider 0 as an observed parameter.
According to our observations of a dry front development and following the same reasoning as above for the evaporation from the free surface of a porous medium, we can now consider that most of the evaporation now takes place essentially around the region of the front of the profile situated at a distance h from the free surface (where n=1). Thus we assume that the vapor diffuses to the free surface over a distance h, i.e. the thickness of the dry region, before reaching the external boundary layer. Again, from the Fick’s law, we deduce that the vapor will diffuse through the porous medium, thanks to a constant gradient leading to a relative humidity at the sample free surface now equal to
1
n . Applying the above result for the evaporation from the top surface region of the porous medium,
we then expect a drying velocity V=n10D0 =n1V0. Besides, the RH gradient along the dry region
inside the sample induces a vapor flux which can be expressed in steady state as V =0Dv(1−n1) h
, where Dv is the vapor diffusion coefficient through the (dry) porous medium. We can write Dv as
D0 , where is the tortuosity of the medium [37]. Note that in this description Dv appears independent of the bead size, which translates into the assumption of the kinetics of vapor diffusion not being affected by pore size. From the two above expressions for the vapor flux we deduce
, and the drying rate can be written
* 0 1 + = h D V v (3) ) 1 ( 1 0 1 Dh Dv
n = +9
with .
In order to determine the evolution of the saturation in time we can assume that in the FRP the dry region develops without saturation change in the rest of the medium. In that case the mean saturation in the sample writes =
(
1−h H)
0. From MRI measurements we know that this does not exactlycorrespond to reality, as during the CRP the saturation keeps on slowly decreasing in the wet region (see inset of Figure 2), but it seems interesting to test this hypothesis which has the advantage to simplify the description and the calculations. The drying rate (1) now writes V =0
(
dh dt)
. Equatingthis rate with that associated with vapor diffusion, and using the above expression for
as a function of V0, we find after integration:0 2 0 2 0 1 1 2 V V t h
+ − = (4)where = 0Dv and t=t−t0 with t0 the time at which the transition from the CRP to the FRP
occurs. At short times, i.e.
t
0
V
02, the thickness of the dry region varies as a function of theimposed evaporation rate (V0). At longer times, i.e.
2 0 0
V
t
, the second term in the square root of (3) becomes negligible and we haveh
2 t
0
. According to this model, there may existsome situations for which the FRP regime is not apparent, because it lasts a short time as compared to the rest of the process. For the FRP to clearly appear in the saturation vs time curve, the time associated with the end of drying under the conditions of the FRP, i.e. tc, must be much smaller than the duration of the second regime, i.e. td . Since the drying rate is V0 in the CRP we have
0
0 V
H tc
. On the other side, from (4) we have in general (except for thin sample layer)
02
t
dH
. We deduce that the FRP will clearly appear during the drying process only ifH D V020 v . 101 102 103 10-2 10-1 100
(min)
t
Figure 3: Saturation (
) vs time during drying of bead packings for different sample thicknesses (H
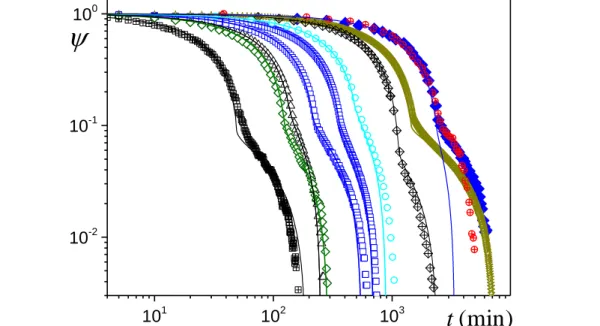
), initial drying rate (V0), and critical saturation (0) (fitted): (data fromweighing) for 62 m mean bead size, (black triangles) 0.6 cm, 0.22 m.s-1, 0.13; (green
4 0
*
10 open diamonds) 0.9 cm, 0.38 m.s-1, 0.1; (blue squares) 1.2 cm, 0.17 m.s-1, 0.12, and 0.38
m.s-1, 0.11; (stars) 5.6 cm, 0.2 m.s-1; covered bead packing 2 cm with kaolin (blue filled
diamonds) or cellulose (red cross-circles) paste 2 cm, 0.047 m.s-1 (MRI). Data from [18]
(MRI): (light blue circles) 1.5 m mean bead size, 1.1 cm, 0.11 m.s-1, 0.17; (black crossed
diamonds) 62 m, 2.6 cm, 0.018 m.s-1. Drying of bead packing initially filled with ethanol
(cross-squares): (weighing) 116 m, 1.5 cm, 1.6 m.s-. The continuous line corresponds to
the model (4).
Let us now compare the predictions of this model with experimental results in terms of mean saturation evolution in time. In that aim we consider tests carried out, either specifically within the frame of this study or taken from literature. This provides a set of data obtained under different conditions for air flux, bead size, liquid type, sample thickness. The results are represented in terms of mean saturation vs time (see Fig.3). The timing of each curve depends on these different characteristics, it is in particular faster for ethanol than for water, faster for stronger air flux, and longer for larger sample thickness. We then fit the model given by equation (4) by determining the initial drying rate (i.e. V0) from the slope of the saturation vs time curve at the beginning of drying. Note
that due to a possible slight decrease of the (experimental) drying rate along the CRP a slight increasing discrepancy between experiments and theory (linear variation in the CRP) may be observed in this regime as the saturation decreases. Then we fit the critical saturation (i.e. 0) associated with the
transition from the CRP to the FRP: the critical saturation is taken at the beginning of the fast slope change in the saturation vs time curve. We finally see that without any other adjustment of parameters the model predicts rather well data obtained under various conditions (see Fig.3). These results show that the above simple model well captures the main physical effects observed at a macroscopic scale, i.e. homogeneous desaturation then development of a dry front, even if in reality there is still some decrease of the saturation in the wet region in the FRP (see Fig.3) likely due to further capillary re-equilibration effects in the wet region during the FRP (see [18]). In fact, this phenomenon is quite consistent with the assumption that the dry front develops when the liquid is unable to reach the sample top due to capillary effects in the timing allowed by evaporation from the free surface: in order to have a front progression inside the sample, which induces a decrease of the drying rate, the characteristic time for liquid draining towards the sample top must increase correspondingly, an effect which can be obtained if the liquid films in the wet region become thinner. As a consequence the above model cannot be considered as a perfect description of the process at a local scale, but rather as a good macroscopic description relying on main physical effects. Also note that in this context the critical saturation is found to vary between 0.09 and 0.17 depending on the experimental conditions, but we have no clear explanation for that.
3.2 Drying of composite systems
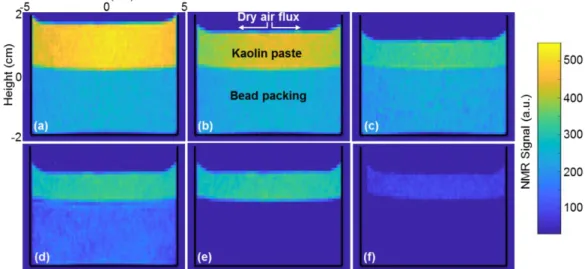
We now study the drying of a bead packing covered with a paste. Let us first consider the case of a clay-water paste. The bead packing is initially filled with water and the clay paste is saturated (i.e. solid fraction: 50% wt). From basic Magnetic Resonance Imaging it appears that during a first stage the paste shrinks vertically while drying (see Figs.4a,b,c): the free surface level progressively decreases, and the water amount decreases in this region, while the granular packing below remains unaffected. After this period the paste does not shrink any more during the rest of the experiment: the sample keeps a constant height whatever the internal changes (see Fig.4c,d,e,f). The second period then starts, during which the water amount in the paste apparently remains constant while the saturation in the grain
11 packing decreases until it reaches a too low value to be visible with such MRI technique (see Fig.4c,d,e). Finally, in a last stage, the paste starts again to loose water (see Fig.4f). At any time, the wet paste covers the porous medium placed in the container, which nevertheless desaturates. Thus, remarkably, we have here a system allowing to extract liquid from a confined porous medium sample without direct contact of this sample with dry air.
Figure 4: Qualitative (T2-weighted) 2D MRI Images of the kaolin paste (top) - bead packing (bottom) system at different times during drying: (a) 0, (b) 16 h, (c) 34 h, (d) 52 h, (e) 75 h, (f) 100 h. The NMR signal on the color scale is for each phase an increasing, but non-linear, function of the local water amount (see Section II).
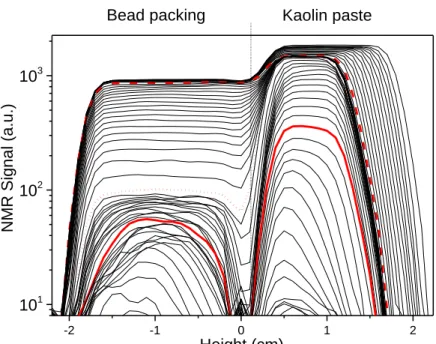
In order to have a detailed, quantitative, and more sensitive view of the porous medium behavior in such confined conditions, we now look at the 1D profile of the water amount down to lower values (see Fig.5). Since, as appears from 2D imaging (see Fig.4), there is no significant radial heterogeneity in the sample at any time, these profiles provide a relevant description of the process which is now regarded as purely mono directional, as far as water can be observed by NMR. We can see that during a first stage, the paste effectively shrinks homogeneously along the sample axis: its thickness decreases while its diameter remains constant (as observed from 2D imaging), the water amount decreases due to compaction but remains uniform.
At the end of this process the paste is still saturated. Indeed, the paste has reached its final thickness (see Fig.4c) associated with a total height loss of 0.55cm, which theoretically corresponds to a sample’s volume loss of about 35𝑐𝑚3. Besides, from NMR measurements, we find that the water volume loss evaporated during this first stage is about 35 cm3 (see Figure 6). We conclude that air entrance inside the paste is negligible, i.e. the paste remains saturated until the end of this regime. This simple shrinkage, which contrasts with fracturing or 3D homogeneous shrinkage observed in other colloidal systems [38-43], likely results from the fact that kaolin particles do not develop significant colloidal interactions, so that inside the paste the particles are essentially piled in disorder with various orientations. Then, under the action of capillary forces resulting from evaporation and slight air-liquid interface withdrawal inside the medium around the free surface, they can rearrange in a more compact way along the sample axis
12 -2 -1 0 1 2 101 102 103 Height (cm) NM R S ign a l ( a .u .)
Bead packing Kaolin paste
Figure 5: Successive NMR water amount profiles (from top to bottom) along sample axis at different times (time interval 2 h) during drying of a kaolin paste/bead packing system. Transition to regime A at 34 h (red dash line). Second transition (to regime B) at 75 h (red dotted line). Third transition (to regime C) at 104 h (continuous thick line). The dry air flux is imposed along the sample top (height=2.2 cm).
During a second period (regime A), the paste keeps a constant uniform water amount, but the water amount in the grain packing decreases homogeneously (see Fig.5). Such an extraction of water, and its replacement with air, from below the saturated paste, has already been observed in layered porous media (small pore over large pore regions) [11, 44-46]. The same effect occurs here as soon as the shrunk paste has become able to resist capillary forces. Indeed, as water evaporates from the paste (with pores much smaller than those of the grain packing), some provisional thin air paths form through the sample. As soon as these air paths reach the grain packing, they instantaneously close back in the paste as the air invades regions with larger pores inside this packing (thus minimizing capillary forces) [47-49]. Such a process repeats a lot of time, leading to a progressive invasion of the grain packing with air whereas on average the paste remains almost free of air.
The most spectacular effect occurs in the next stage (see Fig. 5). Now the water amount decreases in the paste, first homogeneously (Regime B). During that period the water amount in the grain packing goes on significantly decreasing, now with a curved saturation profile, but no clear dry region forms. Then, some apparently dry region starts to form in the paste (Regime C), and simultaneously, some dry region clearly appears in the upper part of the bead packing. The thickness of each of these dry regions then increases in time.
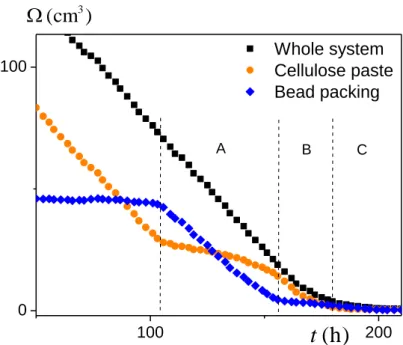
These different stages are directly associated with different regimes of variation of the water content in each part of the system. During the initial shrinkage of the paste resulting from its drying, the drying rate remains constant (see Fig.6), as usually observed with such systems (see [18]). Then, in Regime A, the bead packing dries at the same constant rate (see Fig.6). This results from the fact that the drying rate is still imposed by the evaporation from the sample top made of the same, saturated, clay paste. In the next stage (i.e. Regime B), the paste starts to desaturate but its drying rate is again constant, although slightly lower than in the previous stages (see Fig.6). At the same time the bead packing goes on drying at a much lower drying rate, and finally the total drying rate of the system is the same as in the previous stages. Finally in regime C the drying rate of the paste decreases to zero while its water amount also tends to zero. We will discuss this regime in more details below.
13 0 50 100 0 20 40 60 80 100 120 C Whole system Paste Bead packing
(h)
t
)
(cm
3
A BFigure 6: Water volume evolution as a function of time in the different parts of the bead packing/kaolin paste system during drying, estimated by integrating the NMR signal over the current height of each part.
For the cellulose paste/bead packing system we also have a first stage of homogeneous vertical shrinkage of the paste without liquid extraction from the bead packing (see Fig.7a,b). After this period the paste somewhat desaturates homogeneously while the bead packing is still unaffected (see Fig.7b,c). Then both the paste and the bead packing desaturate (see Fig.7c,d,e,f).
Figure 7: Qualitative (T2-weighted) 2D MRI Images of the cellulose paste (top) - bead packing (bottom) system at different times during drying: (a) : 3h - (b) : 64h - (c) : 101h - (d) : 120h - (e) : 146h - (f) : 160h. The NMR signal on the color scale is for each phase an increasing, but non-linear, function of the local water amount (see Section II).
14 These different stages are more precisely identified from the NMR signal profiles in time (see Fig.8). We have a first period during which the paste shrinks while the bead packing remains intact, this corresponds to NMR profiles situated before the dashed line in Figure 8. At the end of this first period the paste is still saturated. In the next period only the paste desaturates (up to the dash-dotted line in Figure 8). Then (Regime A) both the paste and the bead packing desaturate (up to the dotted line in Figure 8) and finally reach a saturation about 10%: in each medium the NMR signal is about 1/10 times the initial one, i.e. when the medium is saturated. Here the paste starts to desaturate earlier than for the kaolin/bead packing system, due to the fact that for the cellulose/bead packing system the pore sizes of the two materials are in the same order (with slightly larger pores in the paste). Thus the paste desaturates first to reach a saturation for which capillary effects will be similar to those in the bead packing at the beginning of its desaturation. Thus, in Regime A, capillary effects remain dominant. In the next period (profiles after the dotted line in Figure 8), both the paste and the bead packing desaturate heterogeneously down to a very low saturation value, with an apparent dry front developing approximately at the same time in the paste and in the bead packing. However we can remark that during a first stage (Regime B, up to the thick continuous line) the paste has no dry front and such a front develops only in a second stage (after the continuous line) (Regime C).
Consistently with these observations we see that the drying rate is constant during the paste shrinkage period (see Fig.9). In Regime A, when both media desaturate, the drying rate is much larger in the bead packing than in the paste, but the total drying rate remains constant, with the same value as in the first period (see Fig.9). This results from the fact that it is now still imposed by the wetting conditions around the sample top, which do not vary significantly during this stage of desaturation of the paste. The drying rate in each medium then strictly results from capillary equilibrium which controls the removal of liquid from each sample part. In Regime B the drying rate keeps the same value because the paste is sufficiently wet around its free surface. In the last regime the total drying rate starts to decrease while a dry front tends to develop in the paste (Regime C) (see discussion below).
-2 -1 0 1 2 101 102 NM R S ign a l ( a .u .) Height (cm)
Bead packing Cellulose paste
Figure 8: Successive NMR water amount profiles (from top to bottom) along sample axis at different times (time interval alternatively 2 h and 3 h) during drying of a cellulose paste/bead packing system. The red dash line is situated at 69 h of drying. Transition to Regime A at 103 h (red dash-dotted line). Transition to Regime B at 156 h. Transition to Regime C at 180 h. The dry air flux is imposed along the sample top (height=2.2 cm). Note
15 that the minimum NMR signal shown here is just above the noise level, which means that lower values are not reliable.
100 200 0 100 C B A Whole system Cellulose paste Bead packing
(h)
t
)
(cm
3
Figure 9: Water volume evolution as a function of time in the different parts of the bead packing/cellulose paste system during drying, estimated by integrating the NMR signal over the current height of each part.
3.3 Mechanisms of drying in Regime C
An original trend of our data is that for both composite systems, in the very last stage of drying (i.e. Regime C), we have drying characteristics, in terms of saturation profiles, apparently similar to those prevailing in the FRP for a bead packing directly submitted to an air flux, namely with the development of a dry front from the top of each material. Such a result is expected for the paste, as it is situated along the dry air flux, but unexpected for the bead packing covered by a wet material. Indeed, if the RH in the partially saturated paste is 100%, there cannot be any vapor diffusion from the liquid-air interfaces in the bead packing (where the RH is also 100%) to the paste, since the RH gradient is zero. In order to further examine the problem let us now assume that the bead packing dries as if it was directed submitted to an external air flux. In that case, using the drying rate observed for this bead packing in Regime A we can fit the model (equation (3)) to our data for the bead packing alone (cf. Figure 6) and thus get the theoretical prediction associated with desaturation then dry front development under standard conditions. We see in Figure 3 that there is a strong discrepancy between the model and the data, the theory predicts a much faster drying than observed, which confirms that we cannot consider that in Regime C the dry front development is associated with a RH gradient similar to that observed for drying under direct air flux along the free surface. It remains that the development of a dry front suggests a qualitatively similar mechanism, resulting from a RH gradient inside the composite system.
It may be suggested that the radius of curvature of the air-liquid interfaces in the partially saturated paste being rather small, the Kelvin effect [18], which induces a lower (equilibrium) vapor pressure than the expected saturation vapor pressure under standard conditions, could play a role. Let us check the impact of this phenomenon. Since from Figure 4 it appears that in Regime C the volume loss in 50
16 h is about 2.6 cm3, the average drying velocity is 9 -1
m.s 10
2 − . In order to get a velocity of the same order from vapor diffusion over a distance of the order of h=2mm inside the bead packing, as described by the equation V =0Dvn h, we need to have n=0.03. The Kelvin effect finds its origin
in the equality of the thermodynamic potential of the liquid, proportional to the pressure here equal to r where is the surface tension and r is the radius of curvature of the interface, with that of the gas, proportional to lnnr, where nr is the relative humidity along the liquid-air interface. Under
our experimental conditions this leads to r
r T nr exp 0.54 1 R exp − −
= , with
the water molarvolume,
R
the gas constant,T
the temperature in Kelvins, and r expressed in nanometers. Wededuce that to get a similar velocity as that observed we need to have r of the order of 20 nm, which seems possible considering that the maximum saturation level of this profile is about 20% and the particle are platelets with a length of the order of 1 micron, and a thickness of the order of 50 nm. Then, as the saturation will further decrease in the paste, the RH will decrease, thus increasing n while h increases, so that finally the drying rate may not vary too much in this regime.
For the cellulose/bead system similar calculations show that a radius of curvature of the order of 50 nm is needed to get, through vapor diffusion, a drying velocity of the same order as that observed. So we conclude that there is likely some slight gradient of vapor density inside the system due to the Kelvin effect which explains the observed trends in Regime C, i.e. both the aspect of the saturation profiles and the drying rate.
4. CONCLUSION
Through these tests we get a detailed view of the phenomena occurring during the transfer of liquid from a paste to a porous medium during drying. As expected, for slow drying conditions, most of the process is governed by capillary equilibrium, so that the paste first shrinks until forming a sufficiently rigid porous structure, then the medium with the largest pores can desaturate first. When capillary effects are similar in both media they desaturate simultaneously. During all these periods the drying rate of the whole system remains constant. For sufficiently low saturation in the paste a dry front can develop, both in the paste and the porous medium below, and the drying rate decreases.
These results provide useful information in particular useful for the prediction of ion or particle transport. Indeed, we deduce that, if the two media have been saturated with liquid via an appropriate technique, most of the liquid contained in the system will be transported towards the free surface of the sample before evaporation. As a consequence, if advection is dominant (i.e. negligible diffusion effects), the elements possibly suspended in the liquid will be transported and stored in the paste. A small fraction, proportional to the critical saturation for which dry front starts to develop will remain in the substrate.
Author contribution statement
N.A. and S.R. carried out the experiments and, with P.C. and A.G., took part in the results analysis and paper writing.
Appendix A: Kaolin paste characteristics
Kaolinite is a soft, earthy, usually white, clay mineral, produced by the chemical weathering of aluminium silicate minerals. The kaolinite particles are platelets typically a few µm long (see Fig.A1 b). Preparation of kaolin paste was performed as follow: natural kaolinite particles, supplied by
Sigma-17
Aldrich, were mixed (at a weight solid fraction of 50%) with distilled water at room temperature for 20
min until obtaining a homogeneous kaolin paste. A mercury porosimetry test on a dried kaolin paste (thus forming a solid porous material), provides a view of the apparent pore size distribution (see Fig.A1 a). It mainly exhibits a peak around 0.5 µ𝑚 with most pore sizes below this value.
Figure A1: (a) Pore size distribution in a dried kaolin paste investigated by porosimetry: logarithmic variation of the injected specific volume as a function of the pore diameter (blue) and fraction of filled volume (b) SEM Image of kaolin paste microstructure.
Appendix B: Cellulose paste characteristics
The cellulose paste was prepared as follows: natural cellulose fibers (Arbocel BC1000), supplied by
Kremer Pigmente, were mixed (at a weight solid fraction of 7%) with distilled water at room
temperature for 20 min until obtaining a homogeneous paste. Arbocel BC1000 is composed of pure cellulose fibers, of hydrophilic nature, which is only partly swollen by water without dissolving and is insoluble in most solvents. Arbocel BC1000 is used as inert filler for the preparation of cleaning mixtures and poultices to be applied on stone surfaces and frescoes, to which it gives supporting and absorptive properties. The average fiber thickness and length is respectively about 20 µm and 700 µm (see Fig.A2 b). A mercury porosimetry test on a dried cellulose paste (thus forming a soft solid porous medium), provides a view of the apparent pore size distribution (see Fig.A2 a). It mainly exhibits a peak around 30 µ𝑚.
Figure B1: (a) Pore size distribution in a dried cellulose paste investigated by porosimetry: logarithmic variation of the injected specific volume as a function of the pore diameter (blue) and fraction of filled volume (b) SEM Image of cellulose paste microstructure.
18 References
[1] J.P. Nadeau, J.R. Puiggali, Drying: from physical phenomena to industrial processes, (Tec & Doc Lavoisier, Paris, 1995) (in French)
[2] A.V. Luikov, Heat and mass transfer in capillary porous media (Pergamon Press, London, 1966) [3] S. Whitaker, Advances in Heat Transfer, 13, 1 (1998)
[4] J. Van Brakel,Adv. Drying, 1, 217-267 (1980)
[5] J.B. Laurindo, M. Prat, Chem. Eng. Sci., 53, 2257-2269 (1998)
[6] I. N. Tsimpanogiannis, Y. C. Yortsos, S. Poulou, et al., Physical Review E, vol. 59, 4353-4365 (1999) [7] P. Coussot, European Physical Journal B 15, 557-566 (2000)
[8] F. Chauvet, P. Duru, S. Geoffroy and M. Prat, Physical Review Letters, vol. 103, 1-4, 2009. [9] Or, D., P. Lehmann, E. Shahraeeni, and N. Shokri, Vadose Zone J. 12 (2013)
[10] N. Prime, Z. Housni, L. Fraikin, A. Leonard, R. Charlier, S. Levasseur, Transport in Porous Media, 106, 47 (2015)
[11] P. Coussot, C. Gauthier, D. Nadji, J.C. Borgotti, P. Vié, F. Bertrand, C.R. Acad. Sci. , Paris, 327, 1101-1106 (1999)
[12] L. Pel, H. Brocken, K. Kopinga, Int. J. Heat Mass Transfer, 39, 1273 (1996) [13] P. Faure and P. Coussot, Physical Review E, 82, 036303 (2010)
[14] GHA van der Heijden, L. Pel, H.P. Huinink, K. Kopinga, Chem. Eng. Sci., 66, 4241 (2011) [15] N. Shokri, D. Or, Water Resources Research, 47, W09513 (2011)
[16] N. Shokri, P. Lehmann, D. Or, Water Resources Research, 45, W10433 (2009) [17] A.G. Yiotis, D. Salin, E.S. Tajer, Y.C. Yortsos, Phys. Rev. E, 86, 026310 (2012) [18] J. Thiery, S. Rodts, D.A. Weitz, P. Coussot, Phys. Rev. Fluids, 2, 074201 (2017)
[19] N. Shahidzadeh-Bonn, A. Azouni, P. Coussot, Journal of Physics: Condensed Matter, 19, 112101 (2007)
[20] E. Keita, T. E. Kodger, P. Faure, S. Rodts, D.A. Weitz, P. Coussot, Phys. Rev. E , 94, 033104 (2016) [21] A. Bourges, V. Verges-Belmin, Materials and Structures, 44, 1233 (2011)
[22] B. Lubelli, R.P.J. van Hees, J. Cultural Heritage, 11, 10 (2010)
[23] H.J.P. Brocken, M.E. Spiekman, L. Pel, K. Kopinga, J.A. Larbi, Materials and Structures, 31, 49 (1998) [24] E. Bourguignon, Desalination of model porous media with the help of the poultice technique, PhD thesis, Univ. Paris-Est (2009) (in French)
[25] T.D. Gonçalvez, L. Pel, J.D. Rodrigues, Construction and Building Materials, 23, 1751-1759 (2009) [26] H. M. van der Kooij, J. Sprakel, Soft Matter, 2015, 11, 6353‑6359
[27] M. Goavec, S. Rodts, V. Gaudefroy, M. Coquil, E. Keita, J. Goyon, X. Chateau, P. Coussot, Soft Matter, 2018, 14, 8612-8626
[28] Emid, S., & Creyghton, J. H. N. (1985). Physica B, 128, 81-83.
[29] Bogdan, M., Balcom, B. J., Bremner, T. W., & Armstrong, R. L. (1995). Journal of Magnetic Resonance A, 116, 266-269.
[30] Prado, P. J., Balcom, B. J., Beyea, S. D., Armstrong, R. L., & Bremner, T. W. (1997). Solid State Nuclear Magnetic Resonance, 10, 1-8.
[31] Callaghan, P. T. (1993). Principles of Nuclear Magnetic Resonance Microscopy. Oxford: Clarendon. [32] E. Keita, S.A. Koehler, P. Faure, D.A. Weitz, P. Coussot, Eur. Phys. J. E, 39, 23 (2016)
[33] P. Lehmann, S. Assouline, D. Or, Phys. Rev. E, 77, 056309 (2008)
[34] P. Lehmann, O. Merlin, P. Gentine, D. Or, Geophysical Research Letters, 45, 10,398-10,405 (2018)
19 [35] E. Shahraeeni, P. Lehmann, D. Or, Water Resources Research, 48, W09525 (2012)
[36] P. Lehmann, D. Or, Water Resources Research, 49, 8250 (2013)
[37] J.F. Daian, Equilibrium and Transfer in Porous Media 1: Equilibrium States, Wiley, 2014 [38] H. Colina, P. Acker, Materials and Structures, 33, 101 (2000)
[39] R.C. Chiu, M.J. Cima, J. Am. Ceram. Soc., 76, 2769 (1993) [40] R. Weinberger, J. Structural Geology, 21, 379 (1999) [41] H. Colina, S. Roux, Eur. Phys. J. E, 1, 189 (2000)
[42] J.A. Nairn, S. R. Kim, Eng. Fract. Mech., 42, 195 (1992)
[43] J. Thiery, E. Keita, S. Rodts, D. Courtier Murias, T. Kodger, A. Pegoraro, and P. Coussot, Eur. Phys. J. E , 39, 117 (2016)
[44] C. Nunes, L. Pel, J. Kunecky, Z. Slizkova, Construction and Building Materials, 142, 395 (2017) [45] L. Pel, A. Sawdy, V. Voronina, J. Cultural Heritage, 11, 59 (2010)
[46] J. Petkovic, H.P. Huinink, L. Pel, K. Kopinga, R.P.J. van Hees, Materials and Structures, 40, 475 (2007)
[47] A.G. Yiotis, A.G. Boudouvis, A.K. Stubos, I.N. Tsimpanogiannis, Y.C. Yortsos, AIChE J., 50, 2721 (2004)
[48] L. Xu, S. Davies, A.B. Schofield and D.A. Weitz, Phys. Rev. Lett., 101, 094502 (2008) [49] A.A. Moghaddam, A. Kharaghani, E. Tsotas, M. Prat, Phys. Fluids, 29, 022102 (2017)
![Figure 2: Drying of a (1 m) bead packing submitted to an air flux: saturation vs time as deduced from the integration of the NMR profiles shown in the top right inset (data from [18])](https://thumb-eu.123doks.com/thumbv2/123doknet/13265824.397092/8.892.225.692.640.956/figure-drying-packing-submitted-saturation-deduced-integration-profiles.webp)