HAL Id: cea-02380884
https://hal-cea.archives-ouvertes.fr/cea-02380884
Submitted on 26 Nov 2019HAL is a multi-disciplinary open access archive for the deposit and dissemination of sci-entific research documents, whether they are pub-lished or not. The documents may come from teaching and research institutions in France or abroad, or from public or private research centers.
L’archive ouverte pluridisciplinaire HAL, est destinée au dépôt et à la diffusion de documents scientifiques de niveau recherche, publiés ou non, émanant des établissements d’enseignement et de recherche français ou étrangers, des laboratoires publics ou privés.
Solidification of ion exchange resins saturated with Na
+ions: Comparison of matrices based on Portland and
blast furnace slag cement
E. Lafond, C. Cau Dit Coumes, S. Gauffinet, D. Chartier, L. Stefan, P. Le
Bescop
To cite this version:
E. Lafond, C. Cau Dit Coumes, S. Gauffinet, D. Chartier, L. Stefan, et al.. Solidification of ion exchange resins saturated with Na+ ions: Comparison of matrices based on Portland
and blast furnace slag cement. Journal of Nuclear Materials, Elsevier, 2017, 483, pp.121-131. �10.1016/j.jnucmat.2016.11.003�. �cea-02380884�
Solidification of ion exchange resins saturated with Na
+ions: comparison of
matrices based on Portland and blast furnace slag cement
E. LAFOND1, C. CAU DIT COUMES1, S. GAUFFINET2*, D. CHARTIER1, L. STEFAN4, P. LE BESCOP3
1
CEA, DEN, DTCD, SPDE, F-30207 Bagnols-sur-Cèze cedex, France 2
Laboratoire Interdisciplinaire Carnot de Bourgogne UMR 6303 CNRS-Université de Bourgogne, Dijon, France, 9 Av Alain Savary, BP 47870, 21078 Dijon cedex, France
3
CEA, DEN, DPC, SECR, F-91192 Gif-sur-Yvette, France 4
AREVA, Back End Business Group, Dismantling & Services, 1 place Jean Millier 92084 Paris La Défense, France
Abstract
Ion exchange resins (IERs) are widely used by the nuclear industry to decontaminate radioactive effluents. After use, they are usually stabilized and solidified by encapsulation in cementitious materials. However, for certain combinations of cement and resins, the solidified waste forms can exhibit strong expansion, possibly leading to cracking of the matrix.
In this work, the behaviour of cationic resins in the Na+ form is investigated in Portland cement (CEM I) or blast furnace slag cement (CEM III/C) pastes at early age in order to have a better understanding of the swelling process. The results show that during the hydration of the CEM I paste, the resins exhibit a transient expansion of small magnitude due to the decrease in the osmotic pressure of the pore solution. This expansion, also observed with C3S pastes containing similar IERs, occurs just after setting and is sufficient to damage the material which is poorly consolidated. In the CEM III/C paste, expansion of the resins occurs before the end of setting and only induces limited stress in the matrix which is still plastic.
1. Introduction 1
Ion exchange resins (IERs) are commonly used by the nuclear industry in the decontamination 2
process of radioactive effluents. The spent resins become a low-level or intermediate-level radioactive 3
waste and have to be stabilized and solidified, i.e. placed under a solid, stable, monolithic and 4
confining form, before being sent to disposal. Calcium silicate cements offer many advantages for 5
resins encapsulation: easy supply, simple process, good mechanical strength, compatibility with 6
aqueous wastes, good self-shielding, and high alkalinity which allows many radionuclides to be 7
precipitated and thus confined. However, for certain combinations of cement and resins, the solidified 8
waste forms can exhibit strong dimensional variation, possibly leading to cracking of the matrix. 9
Several specificities of IERs have to be taken into account to design a robust cement-based matrix, 10
such as low intrinsic mechanical strength and possible ionic exchanges with the pore solution [1, 2]. It 11
is also well known that in aqueous medium, the volume of IERs beads strongly depends on the 12
composition of the solution. Expansion or shrinkage can be caused by ionic exchanges and/or 13
variations in osmotic pressure. These volume changes can also occur in a cementitious matrix, the 14
pore solution chemistry of which evolves with ongoing hydration and, under severe conditions, they 15
can induce cracking of the matrix [3-5]. Knowledge about the chemical evolution of IERs in a 16
cementitious environment is limited. For example, it is often mentioned in the literature that the 17
encapsulation of IERs with Portland cement (CEM I) leads to strong expansion during the early stages 18
of cement hydration, whereas no swelling is observed when Portland cement is blended with high 19
amounts of blast furnace slag [6,7]. However, the reasons for these different behaviours are not 20
understood. 21
To simplify the system under investigation, Portland cement was replaced in a previous study by its 22
main component, tricalcium silicate [8]. The C3S-waste form also exhibited a strong expansion and 23
two main stages were observed during hydration at early age. In the first one, due to ionic exchange 24
(fixation of calcium, release of sodium), the resins shrank. Then, in a second stage, as hydration 25
accelerated, the sodium concentration in the pore solution rapidly decreased due to the precipitation of 26
sodium-bearing C-S-H, whereas the resins continued to fix calcium ions. Swelling of the resins 27
occurred during the second stage, and resulted from the decrease in the osmotic pressure of the pore 28
solution due to the consumption of sodium ions. Despite its small magnitude, swelling seemed to be 29
enough to deteriorate the hardened matrix during the second stage, just after setting, while the degree 30
of hydration was still low and the matrix poorly consolidated. 31
To provide deeper understanding of real systems, this work aims at comparing the hydration of 32
Portland cement and blast furnace slag cement (CEM III/C) pastes with cationic resins initially in the 33
Na+ form. The objective is to explain why cements containing high amounts of blast furnace slag are 34
more appropriate than Portland cement to solidify and stabilize this waste. 35 36 2. Experimental 37 38 2.1 Materials 39 40
The two cements used in this study were referred as CEM III/C (32.5 N from Calcia Rombas) and 41
CEM I (52.5 N from Calcia Couvrot). According to European standard EN 197-1:2000, CEM I 42
comprises 95-100% Portland Cement clinker whereas CEM III/C corresponds to a Blast Furnace 43
Cement consisting of 5-19% Portland cement clinker and 81-95% blast furnace slag. The 44
compositions of the cements and clinker are reported in Tables 1 and 2. The two cements comprised 45
the same Portland clinker, but in different amounts. 46
IERs were supplied by Rohm&Haas under the trade name Amberlite IR120H in the physical form of 47
spherical beads or ground grains. The IER beads had a diameter comprised between 620 and 830 µm, 48
and the ground IERs had a particle size ranging from 0.4 µm to 300 µm (d10 = 15 µm, d50 = 65 µm, d90 49
= 155 µm). The exchange sites of the resins, shipped in the H+ form, were saturated with Na+ ions by 50
percolating a solution of sodium hydroxide. The pH of the eluted solution was continuously 51
monitored, and the percolation was stopped as soon as the pH exceeded 7. The resins were then rinsed 52
with water to eliminate the excess of base and to recover a neutral pH. Finally, the suspension of 53
water and resins was filtered under humid atmosphere and slight vacuum on a Buchner funnel to 54
remove the free intergranular water (water between the resin grains). The dry extract of the wet resins 55
was measured by gentle heating at 55°C (to avoid any damage of the functional groups) until constant 56
weight. Values of 54.3 ± 0.2 % and 45.3 ± 0.2 %. were achieved for beads and ground grains 57
respectively. This difference was explained by the fact that ground resins developed a larger surface 58
area than bead resins. The volume of water adsorbed onto the surface of resin was thus more 59
important. The wet resins were kept in tightly closed containers. The resins were used in their ground 60
form, except for SEM observations where beads were preferred. 61
62
2.2 Preparation of samples 63
64
Experiments were conducted on pure cement pastes, consisting of CEM III/C or CEM I cement and 65
water, as well as on cement pastes mixed with IERs. 66
To prepare pure cement pastes, CEM III/C or CEM I cements were introduced in a standardized 67
laboratory mixer (European Standard EN 196-1) with water, mixed at low speed for 30 s and at high 68
speed for 3 min. The water-to-cement ratio was fixed to 0.55, which corresponded to the effective 69
water-to-cement ratio of the pastes with IERs, calculated by correcting the total amount of water from 70
that retained in the IERs to solvate the ionic groups. This latter was assessed by measuring their dry 71
extract after the saturation step with Na+ ions, as previously explained in section 2.1. The pure cement 72
pastes exhibited transient bleeding which disappeared after setting. 73
Mixing of cement/IERs systems was performed in two steps: IERs and water were first stirred during 74
30 s at low speed in a standardized laboratory mixer. Then, cement (CEM I or CEM III/C) was 75
introduced in the mixer, mixed at low speed for 30 s and at high speed for 3 min. Samples contained 76
11 wt. % of dry resins, and a total water-to-cement ratio of 0.8. The high water content enabled to get 77
workable grouts and ensured that the system remained saturated, at least at early age. 78
The fresh grout samples were cast into hermetically sealed 50 mL-polypropylene containers and 79
stored in a climatic chamber at 20°C with 95% relative humidity until characterization. 80
81
2.3 Characterization of hydration 82
The Vicat setting time was measured using an automatic Vicat needle apparatus according to EN 196-84
3 standard. In addition, to point out the different stages of hydration, calorimetric measurements were 85
carried out using isothermal microcalorimetry at 25°C (SETARAM, C80 type). Hydration was also 86
stopped after fixed periods of time (from 1 hour to 10 days) by successively immersing the crushed 87
pastes into isopropanol and drying them in a controlled humidity chamber (with 20% relative 88
humidity at 22 ± 2°C). After grinding to a particle size below 80 µm, the mineralogy of the cement 89
pastes was characterized by X-ray diffraction (Siemens D8, copper anode, λKα1=1.54056 Ǻ,). A semi-90
quantitative analysis was performed to assess the evolution of the amounts of reactants and products 91
with time using EVA analysis software (© 2005 Bruker AXS). The method consisted in introducing an 92
internal standard (10 wt% silicon, correction made to take into account the increasing amount of 93
bound water with ongoing hydration) into the sample to be analysed by XRD, and then in calculating 94
the ratio between the area of the most intense diffraction peak of the phase to quantify and that of 95
silicon. The microstructure evolution was observed by Scanning Electron Microscopy (FEI Inspect 96
S50, high vacuum mode, acceleration voltage of 15 kV, current intensity of 50 nA) on sample 97
fractures and polished section at different ages. The Na/S, Ca/S, Na/Si and Ca/Si ratios in the hydrates 98
and IER grains were determined by X-ray microanalysis on polished cross sections (high vacuum 99
mode, Bruker SDD detector calibrated on jadeite, FeS2 and wollastonite). 100
The pore solutions of cement pastes were extracted using pressure (34 MPa) from 1 hour to 10 days. 101
The Na+, K+, Ca2+, and SO4
concentrations were determined using ionic chromatography (Dionex 102
DX500 equipped with IonPac CS12A analytical column and IonPac CG12A guard column). The 103
analytical error was ± 5%. 104
105
2.4 Characterisation of volumetric change 106
107
The shrinkage cone method was used to follow the apparent volumetric change of cement-waste 108
forms with ongoing hydration. It was initially developed by the German Cement Works Association 109
for measuring the autogenous shrinkage of concrete [9]. The setup (from Schleibinger Geräte) 110
consisted of a laser vertically pointed at the surface of a cone-shaped sample in a cylindrical jar 111
connected to a thermostatic bath at 25°C. The sample was poured into the jar and slightly vibrated. 112
The surface of the sample was covered with a plastic sheet equipped with a reflector to avoid 113
desiccation. The jar was then placed underneath the laser, and the distance variation between the 114
reflector and the laser was recorded every 10 minutes. The measurement range was 5 mm, with a 115
resolution of 0.1 µm. The cone geometry ensured that the change in height corresponded to the linear 116
length change of the material as long as it was fluid and also after solidification since deformation was 117
considered as uniform. 118
Based on the work of Matsuda [4], an oedometric cell was developed to measure the swelling pressure 119
induced by cemented resins under constrained environment. 20 g of paste samples were introduced in 120
a cylindrical cell containing a metallic fritted disc at the bottom (Figure 1). A second fritted disc was 121
placed on the upper surface sample and the cell was tightly closed with a piston connected to force 122
sensor. An initial pressure of 0.1 MPa was applied. Measuring the increase in the axial stress enabled 123
to follow the swelling pressure of samples with time. 124
125
3. Results 126
127
3.1 Volumetric change with ongoing hydration 128
129
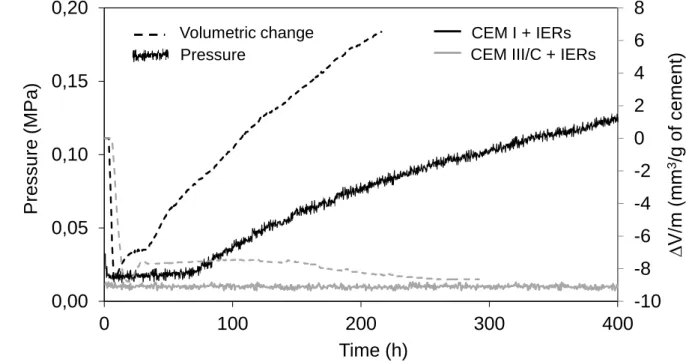
Figure 2 shows the evolution of the swelling pressure of cement-IERs forms under constant strain. As 130
expected, the pressure increased only for the CEM I sample. Tests with the shrinkage cone showed 131
that, under unconfined conditions, this sample also exhibited a strong apparent volume increase which 132
began 8 h after mixing and exceeded 7% after 220 h. 133
134
3.2 Characterization of hydration 135
136
The Vicat setting time of the CEM I and CEM III/C cement pastes was measured with or without 137
IERs in Na+ form. The results are presented in Table 3. The presence of IERs tended to accelerate the 138
setting of both cements. Setting started 30 min earlier, and ended from 1 h (CEM III/C) to 2.75 h 139
(CEM I) earlier than in the corresponding pure cement pastes. These results were consistent with the 140
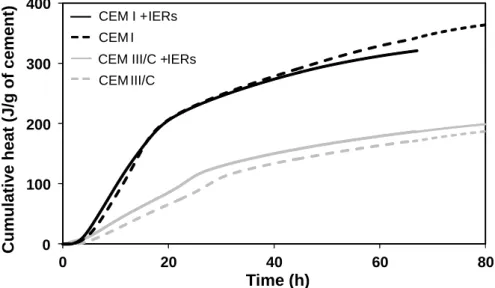
heat flow measurements (Figure 3), showing a slight acceleration of the heat production in the 141
samples containing resins. The setting of the CEM III/C samples remained however much slower than 142
that of the CEM I samples because of the low reactivity of blast furnace slag as indicated by the 143
reduced heat production (Figure 3). 144
145
3.3 Pore solution evolution 146
147
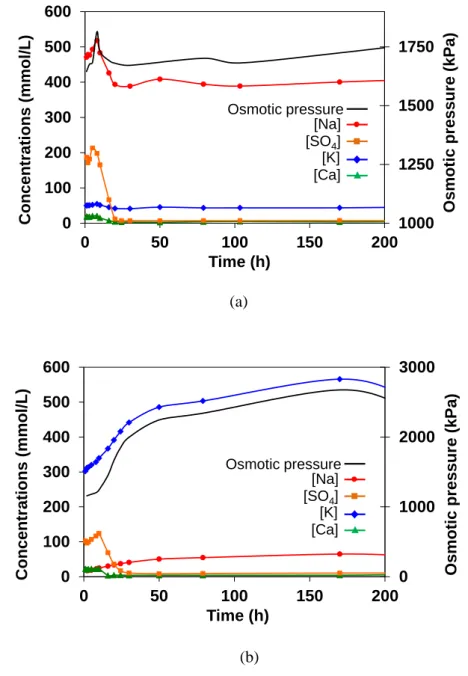
Figures 4 and 5 show the evolution of the pore solution composition and corresponding osmotic 148
pressure (from 1 h to 10 d) for CEM I and CEM III/C paste samples with and without resins. 149
The osmotic pressure of the pore solution was calculated using Van’t Hoff equation (1). 150
i i c RT
(1) 151where is the osmotic pressure of the solution (Pa), the osmotic coefficient, R the constant of ideal 152
gases (8.314 J.mol-1.K-1), T the temperature (K) and ci the concentration of ion i in solution (mol.L -1
). 153
The osmotic coefficient is a corrective factor taking into account the non-ideal behavior of the 154
solution. It was calculated using PhreeQC [10] and Pitzer’s thermodynamic database [11]. 155
In both materials, the sodium concentration rapidly increased during the first 8 h and reached a 156
maximum which corresponded to about 1/3 of the sodium initially fixed by the resins (35% for CEM I 157
sample, 30% for CEM III/C sample). The potassium concentration was much lower than in the pure 158
cement pastes. It was also the case for the calcium concentration, but to a lesser extent. 159
These results showed a partial exchange of Na+ ions from the resins with Ca2+ and K+ ions released by 160
the dissolution of the cement anhydrous phases. In the same time, the sulphate concentration 161
increased due to the dissolution of gypsum. As a result, the osmotic pressure of the pore solution also 162
increased. From previous studies devoted to the volume change of IERs depending on their chemical 163
environment [8, 12], it could be concluded that the 2Na+ ↔ Ca2+ and Na+ ↔ K+ exchanges as well as 164
the increase in the osmotic pressure should cause a shrinkage of the IERs during this period. K+ ions 165
have indeed a smaller solvated ionic radius (~3.2 Å) than Na+ ions (~4.0 Å) [13]. As for calcium, its 166
solvation ionic radius is close to that of Na+, but since it is a divalent cation, its concentration in the 167
resins is divided by a factor 2. Besides, when the osmotic pressure of the solution external to the 168
resins increases, water tends to get out of the resins to reduce the external concentration and 169
equilibrate the chemical potentials between the external and internal solutions. 170
171
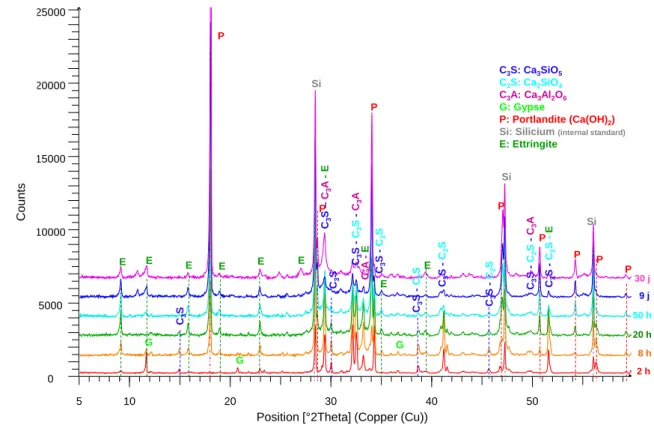
Then, a second stage occurred. Sulphate ions were depleted from the interstitial solution due to the 172
precipitation of ettringite (the exhaustion of gypsum was also observed by XRD at the same time, 173
Figures 6 and 7). The sodium concentration in solution also decreased. As a consequence, the osmotic 174
pressure of the external solution diminished, which produced a swelling of the IERs [8, 12]. Its 175
magnitude was assessed using previously established calibration curves plotting the volume of Na+-, 176
K+-, and Ca2+-IER beads versus the osmotic pressure of the external solution [8, 12, 14]. It was close 177
to 0.1 % for the IERs-CEM I sample, and 0.19 % for IERs-CEM III/C sample. 178
179
3.4 IERs analysis 180
181
X-ray microanalyses were performed on polished cross-sections of pastes with IER beads after 2 and 182
24 hours of hydration. For each hydration time, 10 IER grains were selected and more than 10 183
analyses were performed on each grain. The average Na/S, Ca/S and K/S ratios measured on samples 184
aged of 2 h and 24 h are given in Table 4. The results confirmed the fixation of Ca2+ and K+ ions by 185
the resins during the early stages of hydration. The Na/S ratio continuously diminished with time. 186
Thus, the decrease in the sodium concentration observed in the pore solution after 8 h (CEM I) or 3 h 187
(CEM III/C) was not due to re-fixation of Na+ ions on the resins, with simultaneous release of K+ or 188 Ca2+ ions in solution. 189 190 3.5 Mineralogy evolution 191 192
The mineralogy of the different investigated systems was characterized by XRD and SEM. The CEM 193
I-based materials comprised C-S-H, portlandite, ettringite as well as residual anhydrous cement 194
phases (Figure 6). In the CEM III/C-based materials, the same hydrates were detected with the 195
exception of portlandite (Figure 7). For a given type of cement, the resins did not change the nature of 196
the precipitated hydrates, but only influenced their rate of formation (Figure 8). 197
In both cement-IERs systems, X-ray microanalysis performed on polished cross-sections of 24h-old 198
samples showed that C-S-H sometimes comprised significant amounts of sodium. This sodium-199
bearing C-S-H was very heterogeneously distributed in the matrix, with an average Na/Si ratio close 200
to 0.2 after 24 h. Its precipitation could explain the second decrease in the sodium concentration of the 201
pore solution. The formation of both C-S-H and C-N-S-H has also been reported when resins in the 202
Na+ form are encapsulated in a C3S paste [8], or during the hydration of blast-furnace slag activated 203
by a concentrated NaOH solution [15]. 204
SEM observations of fractures also confirmed the precipitation of portlandite in the IERs-CEM I 205
sample, as big crystals of a few 100 µm (Figure 9-a) at the interface between IER grains and paste. 206
This localized precipitation seemed consistent with the results presented in sections 3.3 and 3.4. The 207
shrinkage of the resins in the first stage of hydration would create voids at the resin/paste interface 208
where portlandite could precipitate. Besides, the strong affinity of the resins for calcium ions would 209
induce a calcium flux from the paste to the resins, possibly leading to a local supersaturation with 210
respect to portlandite near the resin beads. By contrast, in the IERs-CEM III/C samples, no portlandite 211
precipitation was observed (Figure 9-b). 212
213
4. On the swelling of IERs-CEM I samples 214
215
The CEM I- and CEM III/C-based materials differed by their consolidation rate. When resins were 216
encapsulated in the CEM III/C matrix, expansion occurred between the beginning and the end of Vicat 217
setting, when the material was still plastic. The CEM I cement exhibited a higher rate of hydration, 218
and swelling of the IERs occurred just a few hours after the Vicat end of setting, in a hardened matrix, 219
but with: 220
- (i) low mechanical strength. As a fact, when calcium ions are progressively replaced by
221
monovalent cations such as sodium ions, the cohesion decreases, and repulsion between C-S-H 222
particles can even be observed if the negative surface charge density is balanced by monovalent 223
cations only [16, 17]. Precipitation of C-N-S-H in the pastes with Na+-IERs could thus contribute 224
to reduce the strength of the matrix. 225
- (ii) heterogeneous microstructure. Highly porous transition zones were observed between IER
226
grains and the cement paste with precipitation of large crystals of portlandite. 227
Despite its small magnitude, the swelling of IERs due to the decrease in the osmotic pressure of the 228
pore solution could be sufficient to induce cracking of the poorly consolidated matrix. 229
To check this assumption, complementary experiments were carried out on IERs-CEM I samples by 230
retarding the setting without notable change in the chemical evolution. To this end, the fresh grout was 231
divided in two samples which were cured at two different temperatures, 5 and 20 °C. The damage of 232
the cement-resin forms was assessed qualitatively by visual observation (Table 5, Figure 10). 233
Extractions of solutions were performed at 1 h, 5 h, 7 h, 24 h, 48 h and 7 d. The Vicat setting time was 234
also measured at both temperatures. Results are reported in Figure 11. 235
The ionic concentrations showed very similar evolutions with time at both temperatures; the decrease 236
in temperature thus did not affect significantly the chemical evolution of the systems at early age, 237
showing that ionic exchanges on the resin grains, which are very fast, played a key role during this 238
period. Decreasing the temperature however delayed the beginning and end of setting by 8.5 h. As 239
observed before, at 20 °C, the end of setting occurred when the sodium concentration was at its 240
maximum, corresponding to resins under their most contracted form. The slight expansion of the 241
resins caused by the decrease in the osmotic pressure of the interstitial solution (exhibiting the same 242
trend as the sodium concentration) took place just after setting, leading to cracking and disintegration 243
of the sample. At 5°C, setting occurred once the resins had started to swell, and the damages were 244
much less important. The consolidation rate thus seemed to be a key parameter to explain expansion 245
and damage of IERs-CEM I materials. 246
247
5. Conclusions 248
The results show that during the hydration of CEM I and CEM III/C cement pastes, the resins exhibit 250
a transient expansion of small magnitude due to the decrease in the osmotic pressure of the interstitial 251
solution. This expansion occurs just after setting for IERs-CEM I forms. It is sufficient to damage the 252
material which is poorly consolidated with heterogeneous microstructure. Expansion of the IERs-253
CEM III/C forms is not observed because CEM III/C cement exhibits a slower rate of hydration than 254
CEM I cement. Transient expansion of the resins takes place before the end of setting and only 255
induces limited stress in the material which is still plastic. 256
257
REFERENCES 258
[1] V. Morin, S. Garrault, F. Begarin, I. Dubois-Brugger, The influence of an ion-exchange resin 259
on the kinetics of hydration of tricalcium silicate, Cem. Concr. Res. 40 (2010) 1459-1464. 260
[2] Q. Sun, J. Li, J. Wang, Solidification of borate radioactive resins using sulfoaluminate cement 261
blended with zeolite, Nucl. Eng. Design 241 (2011) 5308-5315. 262
[3] P. Soo, L.W. Milian, The impact of LWR decontamination on solidification, waste disposal and 263
associated occupational exposure. Effect of composition on the strength, swelling and water-264
immersion properties of cement-solidified ion-exchange resin wastes, Brookhaven National 265
Laboratory, NUREG/CR-3444 (1991). 266
[4] M. Matsuda, M. Kikuchi, T. Takashi, Conditioning of spent ion exchange resin using high 267
performance cement, Proc. Waste Management, Tucson, Arizona (1993). 268
[5] G.W. Veazey, R.L. Ames, Cement waste-form development for ion exchange resins at the 269
Rocky Flats plant, Los Alamos National Laboratory, LA-13226-MS UC-721 (1997). 270
[6] M. Matsuda, T. Nishi, K. Chino, M. Kikuchi, Solidification of Spent Ion-Exchange Resin Using 271
New Cementitious Material .1. Swelling Pressure of Ion-Exchange Resin, J. Nucl. Sci. 272
Techn.(1992) 883-889. 273
[7] V.N Epimakhov, M.S Oleinik, Inclusion of radioactive ion-exchange resins in inorganic 274
binders, Atomic Energy, 99 (2005) 607-611. 275
[8] E. Lafond, C. Cau Dit Coumes, S. Gauffinet, D. Chartier, P. Le Bescop, L. Stefan, A. Nonat, 276
Investigation of the swelling behaviour of cationic exchange resins saturated with Na+ ions in 277
C3S paste, Cem. Conc. Res. 69 (2015) 61-71. 278
[9] S. Eppers, C. Müller, The shrinkage cone method for measuring the autogenous shrinkage: an 279
alternative to the corrugated tube method, Proc. International RILEM conference on the use of 280
superabsorbent polymers and other new additives in concrete, Lyngby, Denmark (2010) 67-76. 281
[10] D.L. Parkurst, D.C. Thorstenson, L.N. Plummer, PHREEQC, A Computer Program for 282
Geochemical Calculations: U.S. Geological Survey Water-Resources Investigations, Report 80– 283
96, 195 (1980) (revised and reprinted August 1990). 284
[11] L.N. Plummer, D.L. Parkhurst, G.W. Flemming, S.A. Dunkle, A computer program 285
incorporating Pitzer’s equations for calculation of geochemical reactions in brines, US 286
Geological Survey, Water-Resources Investigation Report 88 4153 (1988). 287
[12] E. Lafond, Etude chimique et dimensionnelle de résines échangeuses d’ions cationiques en 288
milieu cimentaire, PhD thesis, Université de Bourgogne, France (2013). 289
[13] W. Rieman, H.F. Walton, Ion exchange in analytical chemistry, Pergamon Press, Oxford, Great 290
Britain, (1970) 24-27. 291
[14] C. Cau Dit Coumes, E. Lafond, S. Gauffinet, D. Chartier, P. Le Bescop, L. Stefan, A. Nonat, On 292
the swelling behavior of cationic exchange resins saturated with Na+ ions in a C3S or Portland 293
cement paste, Proc. NUWCEM 2014, 3-6 juin, Avignon, France (2014). 294
[15] M. Ben Haha, G. Le Saout, F. Winnefeld, B. Lothenbach, Influence of activator type on 295
hydration kinetics, hydrate assemblage and microstructural development of alkali activated 296
blast furnace slags, Cem. Concr. Res. 41 (2011) 301-310. 297
[16] S. Lesko, Mesure des forces interparticulaires par microscopie à force atomique. Application à 298
la cohésion des ciments, PhD thesis, Université de Bourgogne, France (2005). 299
[17] C. Labbez, B. Jonsson, I. Pochard, A. Nonat, B. Cabane, Surface charge density and 300
electrokinetic potential of highly charged minerals: experimental and Monte Carlo simulations 301
on calcium silicate hydrate, J. Chem. Phys. B. 110 (2006) 9219-9230. 302
Table 1: Composition of CEM I cement (oxide composition determined by X-ray fluorescence, phase 304
composition determined by Rietveld analysis). 305
CaO SiO2 Al2O3 Fe2O3 SO3 K2O Na2O MgO MnO Chemical composition of cement (wt.%) 64.44 20.42 5.21 2.33 3.68 1.14 0.89 1.07 0.04 Phase composition of clinker (wt.%) C3S: 66 C2S: 13 C3A: 11 C4AF: 7 Cement composition (wt.%) Clinker: 94% Gypsum: 6% 306 307
Table 2: Composition of CEM III/C cement (oxide composition determined by X ray fluorescence,
308
phase composition determined by Rietveld analysis). 309
CaO SiO2 Al2O3 Fe2O3 SO3 K2O Na2O MgO MnO TiO2 P2O5 Chemical composition of cement (wt. %) 45.1 32.0 10.3 0.8 2.9 0.55 0.18 6.1 0.4 0.5 0.1 Phase composition of clinker (wt.%) C3S: 66 C2S: 13 C3A: 11 C4AF: 7 Cement composition (wt.%)
Blast furnace slag: 80.5 Clinker: 14.2 Anhydrite: 5.2
310 311
Table 3: Vicat setting times of CEM I and CEM III/C cement pastes with and without IERs (± 0.3 h). 312
Sample Beginning of setting (h) End of setting (h)
CEM I 4.0 11.3
CEM I + IERs 3.5 8.5
CEM III/C 6.5 31.0
CEM III/C + IERs 6.0 30.0
313 314
Table 4: Na/S, Ca/S and K/S molar ratios of resin beads encapsulated in a CEM I or CEM III/C 315 cement paste. 316 Type of cement Age of sample (h) Na/S Ca/S K/S Average Standard deviation Average Standard deviation Average Standard deviation CEM I 2 0.86 0.06 0.03 0.03 0.14 0.02 24 0.78 0.05 0.07 0.02 0.19 0.01 CEM III/C 2 0.85 0.07 0.08 0.06 0.03 0.01 24 0.79 0.07 0.10 0.06 0.04 0.01 317 318
Table 5: Visual observations of IERs-CEM I and IERs-CEM III/C samples cured at 25°C and 5°C. 319
Hydration time 25°C 5°C
3 days
Apparition of the first cracks
No cracks
6 days
Destruction of the container
Slight cracks on the container
10 days
Destruction of the sample
Slight cracks on the container 320
Figure 1: Experimental device to measure swelling pressure under constrained environment. 322 323 324 Piston Force sensor Sample Fritted disk Fritted disk
Figure 2: Evolution with time of the pressure induced by IERs-CEM I and IERs-CEM III/C samples 325
under confined environment; comparison with their volumetric change under unconfined 326 environment. 327 328 329 330
-10
-8
-6
-4
-2
0
2
4
6
8
0,00
0,05
0,10
0,15
0,20
0
100
200
300
400
∆V
/m
(mm
3/g
of
cement)
Pres
su
re
(MPa)
Time (h)
Volumetric changePressure CEM III/C + IERs
331
Figure 3: Cumulative heat flow versus time for CEM I and CEM III/C cement pastes with and without 332 IERs. 333 334 335 0 100 200 300 400 0 20 40 60 80 C umulat iv e heat (J/g of ce ment ) Time (h)
CEM III/C + IERs CEM I + IERs CEM I
Figure 4: Evolution of the composition (Na+, K+, Ca2+, SO4
2-) and osmotic pressure of the interstitial 336
solution of CEM I cement paste samples with (a) and without resins (b). 337 338 (a) 339 340 (b) 341 342 1000 1250 1500 1750 0 100 200 300 400 500 600 0 50 100 150 200 Osmot ic p ressu re ( kP a) Con cen tr ations ( mmol /L) Time (h) [Na] [SO4] [K] [Ca] Osmotic pressure 0 1000 2000 3000 0 100 200 300 400 500 600 0 50 100 150 200 Osm oti c pressure (kPa) Con cen tr ations ( mmol /L) Time (h) [Na] [SO4] [K] [Ca] Osmotic pressure
Figure 5: Evolution of the composition (Na+, K+, Ca2+, SO4
2-) and osmotic pressure of the interstitial 343
solution of CEM III/C cement pastes with (a) or without IERs (b). 344 345 (a) 346 347 (b) 348 349 350 900 1000 1100 1200 1300 1400 1500 0 100 200 300 400 500 0 50 100 150 200 Osmot ic p ressu re ( kP a) Co nc en trati on s (mm ol/L) Time (h) [Na] [SO4] [K] [Ca] Osmotic pressure 0 250 500 750 1000 1250 1500 0 100 200 300 400 500 600 0 50 100 150 200 Osmot ic p ressu re ( kP a) Conc entr ati ons ( mmol /L) Time (h) [Na] [SO4] [K] [Ca] Osmotic pressure
Figure 6: X-ray diffraction patterns of IERs-CEM I samples. 351 352 353 C3 S -C2 S -C3 A 0 5000 10000 15000 20000 25000 5 10 20 30 40 50 C3S: Ca3SiO5 C2S: Ca2SiO4 C3A: Ca3Al2O6 G: Gypse P: Portlandite (Ca(OH)2)
Si: Silicium (internal standard)
E: Ettringite C3 S C3 S – C3 A -E E 2 h 8 h 20 h 50 h 9 j E E E G P G E P Si C3 S C3 S -C2 S -C3 A C3 A -E P C3 S -C2 S E G C3 S -C2 SE P P Si P P C3 S -C2 S -E Si P C3 S -C2 S C3 S -C2 S C ounts
Position [°2Theta] (Copper (Cu))
E
Figure 7: X-ray diffraction patterns of IERs-CEM III/C samples. 354 355 356 0 1000 2000 3000 4000 5000 6000 7000 8000 9000 10000 11000 12000 6 10 20 30 40 50 60 } C3 S -C2 S -C3 A -E C3S: Ca3SiO5 C2S: Ca2SiO4 C3A: Ca3Al2O6 A: Anhydrite (CaSO4)
Si: Silicium (internal standard)
E: Ettringite (Ca6(Al(OH)6)2(SO4)3(H2O)26
M: Merwinite (Ca3Mg(SiO4)2) D: Dolomite (CaMg(CO3)2) C3 S 75 h Si C3 S -C2 S -C3 A E 10 j C ounts
Position [°2Theta] (Copper (Cu))
30 h 17 h 7 h 3 h 1 h Si Si E E E E E -M E -D D E A – M -E E -M E C3 S A D } C3 S -C2 S -C3 A -E C3 S -C3 A – M -D E D A -C3 S } E -M C3 S -C2 S E A A -C3 S A E C3 S D D A
Figure 8: Influence of the resins on the phase content of CEM I (a) and CEM III/C (b) cement pastes 357 during hydration. 358 359 360 361 0 1 2 3 4 5 6 0 50 100 150 Ratio of peak area s Time (h) C3S 0 1 2 3 4 0 50 100 150 Ratio of peak area s Time (h) Gypsum 0 2 4 6 8 10 0 50 100 150 Ratio of peak area s Time (h) Portlandite CEM I + IERs CEM I 0 1 2 3 4 0 10 20 30 40 50 Ra tio of peak areas Time (h) 0 2 4 6 8 0 5 10 Rat io of pea k ar ea s Time (h) 2 h 3 h 0.0 0.2 0.4 0.6 0.8 1.0 0 50 100 150 Ratio of peak area s Time (h) Ettringite a 0.00 0.05 0.10 0 50 100 150 Ratio of peak area s Time (h) Anhydrite 20 h 30 h 0.0 0.2 0.4 0 50 100 150 Ratio of peak area s Time (h) Ettringite
CEM III/C + IERs CEM III/C b
Figure 9: SEM observation of IERs-cement forms aged of 2 months: cavity previously occupied by a 362
resin bead. (a) CEM I sample; (b) CEM III/C sample. 363
(a)
(b)
364 365 1 mm - - mm
Figure 10: IERs-CEM I samples cured for 6 days at 25°C (left) or 5°C (right). 366
367 368 369
Figure 11 : Evolution of the interstitial solution composition (Na+, K+, Ca2+, SO4
2-) and Vicat needle 370
penetration versus time for IERs-CEM I samples cured at 5 and 20 °C.. 371 372