HAL Id: insu-03210089
https://hal-insu.archives-ouvertes.fr/insu-03210089
Submitted on 27 Apr 2021
HAL is a multi-disciplinary open access
archive for the deposit and dissemination of
sci-entific research documents, whether they are
pub-lished or not. The documents may come from
teaching and research institutions in France or
abroad, or from public or private research centers.
L’archive ouverte pluridisciplinaire HAL, est
destinée au dépôt et à la diffusion de documents
scientifiques de niveau recherche, publiés ou non,
émanant des établissements d’enseignement et de
recherche français ou étrangers, des laboratoires
publics ou privés.
The wave distribution function in a hot magnetospheric
plasma’ The direct problem
O Santol, Michel Parrot
To cite this version:
O Santol, Michel Parrot. The wave distribution function in a hot magnetospheric plasma’ The direct
problem. Journal of Geophysical Research Space Physics, American Geophysical Union/Wiley, 1996,
�10.1029/95JA03510�. �insu-03210089�
JOURNAL OF GEOPHYSICAL RESEARCH, VOL. 101, NO. A5, PAGES 10,639-10,651, MAY 1, 1996
The
wave
distribution
function
in a hot
magnetospheric plasma' The direct problem
O. Santol•k I and M. Parrot
Laboratoire de Physique et Chimie de l'Environnement, Centre National de la Recherche Scientifique, Orl6ans, France
Abstract. Studying electromagnetic
waves in a magnetospheric
plasma, it is often
important to find their directions of propagation. When the assumption
of a plane
wave is not valid, the determination
of the wave distribution
function (WDF) is
required. The WDF specifies
the distribution of wave-energy
density with respect
to the frequency and the wave-normal direction. An alternative approach to theestimation of the experimentally
accessible
data for a given WDF is suggested
with
the hot-plasma and/or Doppler effects taken into account. The method is based
on an explicit frequency
dependence
of the WDF. Examples
of solutions,
including
the determination
of the wave-refractive
index, the wave-growth
rate, the group
velocity, and theoretical predictions
of experimental data at predefined
frequencies,
are given in different cases. First, whistler-mode waves in a hot plasma near the
geostationary
orbit were studied. Second, the low-frequency
waves observed
by the
low-altitude satellite Freja in the auroral zone were subjected
to theoretical analysis.
A complex, multimodal structure of the wave characteristics
was found, mainly
around the resonance
angle. In the case of extremely short-wavelength
waves, the
influence of the Doppler effect produced qualitative changes
of the wave-normal
dependence of wave parameters.1. Introduction
The in situ measurement of fluctuating fields is an im- portant tool for investigating wave phenomena in space
plasmas. Usually, several components of the electric
and magnetic fields are simultaneously measured, pro- viding information about the wave propagation. The following two general approaches can be chosen: (1) the presence of a single plane wave is supposed or (2) a set
of waves with a continuous distribution of wave-normal directions is studied.
The first alternative has been extensively developed
by many authors [e.g., Means, 1972; McPherron et al., 1972; Arthur et al., 1976]. The normal direction of a
plane wave is determined by various procedures based
on the assumption of the perpendicularity of the wave magnetic field to the wave normal. Methods to verify the initial assumption of the single plane wave were also worked out [e.g., McPherron et al., 1972; Samson and Olson, 1980]. Their application to the measured data has shown that, in some cases, the wave field is more complicated. Especially, the data on hiss events are not consistent with the idea of a single plane wave [Par- •Now at Faculty of Mathematics and Physics, Charles
University, Prague, Czech Republic.
Copyright 1996 by the American Geophysical Union.
Paper number 95JA03510.
0148-0227/96/95 JA-03510509.00
rot and Lefeuvre, 1986]. At a given frequency, several propagation directions can simultaneously be observed and several wave modes may also be involved. In such a case, the subject of analysis must be a general wave
continuum.
In order to describe this continuum, the concept of
the wave distribution
function (WDF) was proposed
by Storey and Lefeuvre [1974]. Using an analogy withthe particle distribution function from the kinetic the-
ory of gases, the WDF was introduced as a distribu- tion Fn•(x, k, t) of the wave-energy density in the wave-
vector space:
w•
(x,
k,
t)
- /a F•(x,k,t)
kd3]•, (1)
where wm is the energy density of a wave mode rn ob- served at a position x and at a time t, and contained in a region f•t of wave vectors k. Estimation of the experimental signals using a known shape of the WDF constitutes the WDF direct problem. The resolution
of this problem
is given
by Storey
and Lefeuvre
[1979,
1980],
who
first solved
the problem
for waves
propagat-
ing in a cold plasma without considering the Doppler effect. They have also proposed the use of an explicit
frequency
dependence
of the WDF ((1) contains
this de-
pendence in an implicit form, via the plasma dispersion relation which gives the connection between the wavevector and the wave
frequency).
Using these results, the inverse problem of the WDF
(i.e., the estimation
of an approximate
shape
of the
10,640 SANTOLIK AND PARROT: WAVE DISTRIBUTION FUNCTION IN A HOT PLASMA WDF based on the knowledge of experimental signals)
has been resolved [Lefeuvre, 1977; Lefeuvre and Delan- noy, 1979; Delannoy and Lefeuvre, 1986] and applied to the experimental data [e.g., Parrot and Lefeuvre, 1986, Lefeuvre et al., 1992]. More recently, Oscarsson
and ti•b'nnmark
[1989,
1990]
and Oscarsson
[1989,
1994]
studied the WDF problem in a hot plasma with the Doppler effect, but using the implicit frequency depen-dence of the WDF.
The aim of this paper is to develop a method for solving the WDF direct problem in a hot plasma with the Doppler effect, using an approach similar to Storey
and Lefeuvre
[1979, 1980]. Section
2 will present
the di-
rect problem and the two different approaches, section 3 contains a brief description of our method, whereas applications to real events are given in section 4. Con- clusions are summarized in section 5. (The SI systemof units is used
throughout
the paper.)
2. The Direct Problem of the WDF
2.1. The Different Forms of the WDF
The original form of the WDF in (1) depends on the
wave vector k, which is not easily obtained from expe-
rimental measurements. Therefore Storey and Lefeuvre [1979] proposed to replace the wave vector k by two
quantities'
the wave-normal
direction
•: - k/k (k is
the modulus of the wave vector), and the observed fre-
quency coo. The wave-normal direction k is determined
by two angles 0 and ½ (Figure 1). For a given wave vector k the corresponding frequency coo is obtained by taking into account the Doppler effect and the response of the medium to wave propagation.
The Doppler effect coo -Ico -k.vo I, (ll means the absolute value, co is the wave frequency in the medium, and vo is the velocity of the receiver in the medium) was neglected in the work of Storey and Lefeuvre [1979], where coo - co. This approximation is well justified if the influence of the Doppler effect is negligible in comparison with the experimental frequency resolution. In the following, the velocity vo is supposed to be much smaller than the velocity of light and nonrelativis- tic transformations between the receptor and medium
frames will be used.
_•
xs(•
)
vø ...
"l k
• Bø
(•)
x • (p) ,..
Figure 1. Physical coordinate system p linked with B0 and vo, the latter being the relative velocity between
the medium and the satellite.
The response of the medium to the wave propaga- tion is described by the dispersion relation D(co, k) - 0.
Using
this last substitution,
Storey
and Lefeuvre
[1979],
supposing a given position x and a given time t, wrote (1) in a form equivalent to(2)
where d2/c represents
a two-dimensional
integration
(over a solid angle)
for the wave-normal
directions
con-
tained in the region
f2•. In (1), f2k is now defined
by
the shape
of f2• and the frequency
interval
(co•,
co2).
For a given shape of the WDF, i.e., in the case of a pure direct problem, the G form (see (2)) and the F
form (see (1)) are equivalent.
The WDF can be trans-
formed from one form to the other through the equation(k)
- (vg.
- vo).
(3)
where vg,• is the group velocity of wave mode m. The physical dimension of F,• is similar to the energy unit, whereas for G,• it is the spectral density of the energy
density.
However, the solution of the WDF direct problem is often used as a part of a WDF reconstruction method. The WDF is here defined by experimental data, and the direct problem must be defined more precisely; the
task is to calculate an estimation of the data which can
be compared with the data really measured. In this case, the two WDF representations are not equivalent. The main advantage of the G form representation (see (2)) is that the k dependence is replaced by the coo dependence. The wave data are usually obtained as a function of time, and their coo dependence is obtained by spectral analysis. With the G form, a wave phe-
nomenon found around a certain frequency coo may be
directly compared with a theoretical estimate using the corresponding WDF. Oppositely, the F form requires al- ways a complex 2-D surface in the k space to be found, according to the given coo. In this case, the only signi-
ficant WDF values are those obtained on this surface.
The same problem arises with the F form in the case of instruments providing spectral information for a prede- fined set of frequencies [e.g., Cornilleau-Wehrlin et al., 1•].
The G form representation can be therefore assigned to the experimental data in a more straightforward way. As will be shown, a multiplicity of wave modes, often observed in a hot plasma, can be also introduced. The G form has been used by Storey and Lefeuvre [1979], œefeuvre and Delannoy [1979], and Delannoy and œefeu- vre [1986] to study the reconstruction of the WDF of electromagnetic waves in a cold plasma, without con- sidering the Doppler effect. Storey and Lefeuvre [1979]
demonstrated that different wave modes are better se-
parated with this representation.
The Fform ofthe WDF (see (1)) was used by Oscars- son and Rb'nnmark [1989, 1990] and Oscarsson [1994]
SANTOLIK AND PARROT: WAVE DISTRIBUTION FUNCTION IN A HOT PLASMA 10,641
WHAMP (Waves in Homogenous, Anisotropic, Multi- component Plasmas) program [Rb'nnmark, 1982]. With this last representation, the Doppler effect can be sim- ply introduced.
As discussed by Storey and Lcfcuvrc [1979], the reso- lution in frequency wo depends always on the temporal resolution of the G form of the WDF. An analogous re- lation between the wave vector and spatial resolutions
must be taken into account for the F form. RSnnmark
and Larsson [1988] directly included this relation for
their definition of the WDF.
We will use the G form defined in (2), because the fi- nal purpose is to reconstruct the WDF from frequency- dependent experimental data. In this definition, fre- quency and time are supposed to be independent vari- ables. The respective resolutions of these variables will be considered as independent experimental errors caused by the spectral analysis of the data.
2.2. The Relationship Between the WDF and
Measurable Wave Parameters
In the case of electromagnetic waves in plasma, of experimental signals ½i can be defined as
a set
cqe
]
e -- E•,..., ENe, cB•,..., cBNb, ne • (4)•o•o
where Exo.. ENe are the signals obtained by Ne elec-
tric antennae, Bx... BNb are obtained by Nb magnetic antennae, ne is the electronic density, c is the velocity
of light, q• is the electron charge, and z0 is the vacu- um permittivity. The scale factors for Bi and n• arc
used in order to obtain the same physical unit for all ei
components.
For a given frequency coo the corresponding spectral
matrix
is ,•ij(coo)- {ei(coO)ej(coO)),
where
{x)is the
ensemble average of a random variable x and asterisk means the complex conjugate. The ei are the complex spectrum amplitudes of the experimental signals el. In practice, the spectral analysis roughly corresponds to the filtering of the signal by a passband filter with a cen-
tral frequency coo and a nonzero frequency bandwidth
Aco. As discussed by Lefeuvre [1977] and Storey and Lefeuvre [1979], who suppose a continuous distribution
of elementary plane waves with no mutual coherence and a narrow bandwidth Aco, the relationship between
the spectral matrix and the G form of the WDF is given
by
: Z / amij(coo,
O,
qS)
Gin(coo,
0,
(3)
d2•c
, (5)
where m represents the different wave modes. The path integration is carried over the full solid angle of wave- normal directions, and for a given mode m the integra- tion kernels amij are calculated froma•,j(wo,
O,
•) - a• d•,(wo,
O,
•) d•j(wo,
O,
•) (6)
The quantities di and 6 correspond to an elementary plane wave with a normal direction defined by the an- gles 0 and •b; coo represents the Doppler-shifted fre- quency of the elementary wave; • is its energy density; di is the complex amplitude of the ith elementary sig- nal. This amplitude would be equal to the amplitude of the ith experimental signal in the ideal case, where only an elementary plane wave was measured without experimental noise. The complex amplitude di can be calculated by considering the physical properties of the medium, using solutions of the dispersion relation as well as characteristics of the experiment.
3. Description of the Method
The resolution of the direct problem of the WDF in a hot plasma is based on (5). The principal task is the
calculation
of the integration
kernels
amij with (6). In
a hot plasma and/or introducing the Doppler effect, a numerical procedure must be employed. This requires a discretization of the integration in (5), and a set of porcupines of distinct wave-normal directions must be introduced. The integration of the WDF direct problem (5) is then transformed into a discrete form for a givenfrequency coo,
N,•
=ZZamij(Omt
m, Or.) Gr.(Or., Or.) (7) where œ is the index specifying one of the Nr• predefined directions for a given porcupine rn, and rrr•g is the ele- mentary space angle. The quality of reproduction of (5) by the discrete approximation (7) is strongly influenced by the choice of a distribution of directions in a porcu- pine. We use an igloo distribution (for illustration, see Figure 2) which provides the best coverage of a region of directions (a space angle).
Equation (7) allows a straightforward introduction of different distinct wave modes appearing in a hot plasma
I • xs(P)
x • (p)
g 0
10,642 SANTOLIK AND PARROT: WAVE DISTRIBUTION FUNCTION IN A HOT PLASMA
at a given frequency. The index m defines a separate porcupine of directions for each wave mode. The pro- cedure of computing the integration kernels must be
therefore
able to get all the values
of arnij(Ornl,
q•rnl)
in
the corresponding mode within a porcupine rn.To calculate these integration kernels, the dispersion relation of the hot anisotropic medium must be first resolved. Using the G form of the WDF, the Doppler
effect will be introduced at this moment, because the
frequency wo is considered as an independent variable. This requires a simultaneous resolution of the dispersion relation and the equation of the Doppler effect.
3.1. The Doppler-Shifted Dispersion Relation The wave modes are defined by distinct roots of the dispersion relation, which is defined by
O(w, k): det D(w, k, 0, 05): 0 , (8) where the dispersion tensor D is calculated using the dielectric tensor, E = I+ •l El; I is the unit tensor, and El represents the contribution of a plasma component. The plasma component is defined by the type of parti- cles (electrons or different ion species) or by the shape of their distribution function. The following three dif- ferent approximations of E1 have been included in our method: cold plasma, algebraic expressions for a hot and weakly relativistic plasma [Sazhin, 1987, 1988], and
a numeric procedure for a hot nonrelativistic plasma
[RSnnmark, 1983]. Following $azhin [1987], the non- relativistic approximation does not allow the analysis of plasma waves near the cutoff frequencies, where the
value of the refractive index is small.
The equation of the Doppler effect •w - wo q- k.vo must be used with (8) to find k and .•w for a given value of wo and a given wave-normal direction. The
nonlinear system of equations can have several solutions
corresponding to different wave modes.
Several cases must be considered to obtain the solu-
tion of the dispersion relation, depending on the stabi-
lity of the wave mode. If the wave is stable, .•w is null
and F is a Hermitian tensor [Stix, 1962]. Therefore D
also is a Hermitian tensor and its determinant is real.
The solution is given by the real roots k as soon as the wave-normal direction and the frequency are fixed. If the wave modes are quasi-stable; that is, •w is low, ap- proximations can be used (for example, [Sazhin, 1993]). For a more general solution, a combination of k and •w that makes the complex value det D(w, k, 0, •b) to vanish for given 0, •b, and wo must be found. As the resolution of the dispersion relation is a numerical problem, it is necessary to make a preliminary estimate of the solution
for wave mode m in an initial wave-normal direction.
Generally, the dispersion relation is symmetrical in the space of wave-normal directions and the solution can only be sought in a part of this space. However, the symmetry is disturbed by the Doppler effect, and several cases must be envisaged, depending on the value of the vo components.
3.2. The Integration Kernels
Using the solution of the dispersion relation, the in- tegration kernels are calculated. In (6) the ratio for a given mode m can be written as (supposing given wo, 0, and
•i ½j ,n
t• = ei ej '
,,•
*
(9a)
where
• = v/_
• .
(9b)
In the definition (9b) of the normalized vector •, the vector • of analytic signals must correspond to the vec- tor of experimental signals given by (4). To obtain •, the parameters of the elementary plane wave (electric and magnetic fields, electronic density variation) will be found first. In the second step the influence of experi- mental devices (electric or magnetic antennae) will be
considered.
For a given wave mode m the solution of the dis-
persion
relation
can be used
to calculate
the dispeps.
ion
tensor D,•. The polarization of the electric field E of the elementary plane wave, which is necessary to calcu-
late the kernels
amij, can
be found
from
Dm l• - 0.
With the polarization and the following expression of the energy density of the analytic plane wave which can be derived from Stix [1962],
1 ]•. OD,•
]•,
(10)
a direct procedure to calculate the normalized electric
field
]•n _ ]•/X/• has
been
found.
The normalized
wave
magnetic field is then given by
c
1•1
• - cl•l
/ x• - • k x
(11)
and the normalized
electronic
density
perturbation
n,
is linked
to the normalized
electric
field l• • through
Coulomb's law:
,•
C
•!•
n, = k. (12)
•o
The normalized signals • can now be calculated, us-
ing the results
of the last paragraphs.
As for the signals
of the electric and magnetic components, we must cal- culate the projection of the field vector in the direction of the corresponding antenna. The electric signals may need a supplementary correction to account for the fi- nite length of the antenna and the coupling impedance to the plasma. As the next step, all signals are mul- tiplied by the complex transfer function of the corre- sponding eiectronic chain. Finally, with the signals •and (9a), we can calculate
the kernels
a•ij.
3.3. The Group Velocity
When the dispersion relation is known for a given wave mode m, the group velocity of an elementary plane
SANTOLIK AND PARROT: WAVE DISTRIBUTION FUNCTION IN A HOT PLASMA 10,643 Vg • •
x • (p)
: ....
•c •xz(•)
•(•) ,Figure 3. Coordinate system k linked to the wave
vector.
(0k
det
D.•
)
vg,•
- -R 0• der
D,•
(13)
The calculation of this velocity is necessary for the transformation from one representation of the WDF to the other with (3). It could also be useful for interpret- ing the results of the WDF analysis.
Using the derivatives of D,•, we have
(0s
det
D,•
)
vg•(k)
= -• kO•
det
D,• '
va2(k
) -
vo•(p)
sin• ,
(0k
der
D.•
)
vga(k)
- -• 0•odetD,•
'
(14)
where the derivative 0 o det D,• is found from the fact that der D,• depends only on the angle ½5 through the
Doppler
effect. The quantity vo•(p) is the component
of the velocity
vo in the direction
of the axis x•(p) (see
Figure 1).The components of the group velocity are calculated in the coordinate system linked to the wave vector (Fi- gure 3). To express the group velocity in the physical coordinate system of Figure 1, a transformation has to
be performed.
4. Examples of Solutions
4.1. Whistler Mode Waves in a Plasma Near the
Geostationary Orbit
The first tests of this method used typical plasma
parameters near the equator at L - 6.6. Two main reasons lead to this choice. (1) In this region a two- peaked WDF of whistler-mode waves (i.e., violations of the assumption of a single plane wave) has been ob- served on board Geos 1 [Parrot and Lefeuvre, 1986].
(2) The work of Horne and $azhin [1990] and $azhin
and Horne [1990] contains a numerical solution of the dispersion relation for the whistler-mode waves at fixed frequencies. Their plasma model corresponds to Geos i observations in this region. To compare their resultswith the output of our method, the same plasma and
wave parameters have been chosen.
The plasma model is composed of the following three Maxwellian components: (1) cold electrons with a num-
ber density
of 106 m -a and temperature
T = i eV; (2)
hot electrons with a density of 1.81x10⁵ m -a and T = 200 eV; and (3) ions as a neutralizing background. The electron gyrofrequency is Qe/27r = 3000 Hz.Three whistler-wave frequencies have been examined as follows: wo/2•r = 1200, 1800, and 2400 Hz. No Doppler effect has been introduced (wo = •w). Figure 4 contains an example of results in the case of wo/27r = 1800 Hz. The dependencies of obtained parameters on the polar angle 0 are presented. Without the Doppler
effect the dependencies on the azimuthal angle •5 are
either constant functions or can be determined as sim-
ple algebraic expressions. The value •5 = 0 ø has been
therefore used.
Figure 4 (left) contains (from the top) the wave- refractive index, N = kc/•w (c is the velocity of light); the ratio .•w/•w expressing wave damping; the group- velocity modulus normalized to the velocity of light va/c; and the group-velocity direction represented by the deviation of the group-velocity vector from the vec- tor of the ambient magnetic field. The solid line corre- sponds to the solutions obtained when using the nu- meric procedure for the hot-plasma dielectric tensor [Rb'nnmark, 1983], the dotted line corresponds to al- gebraic expressions of this tensor [Sazhin, 1987, 1988], and the dashed line represents the cold-plasma approx- imation of the dielectric tensor [Stix, 1962]. We have calculated the cold-plasma solution taking into account the total plasma density obtained as the sum of the
densities of both cold and hot electrons. For 0 well be-
low the resonance angle 0R, the three procedures give
similar results
(in the presented
case
0R = 51.8ø), the
observed differences between the hot and cold plasma results being less than 2ø76. However, if a simplified cold plasma solution is used, the bias of the obtained re- fractive index can reach about 10o76 [Sazhin and Horne, 1990]. In the cold-plasma approximation the waves do not propagate for 0 greater thanConsidering the results of the hot-plasma procedure, we observe a complex behavior of the wave propagation near the resonance angle and a heavy damping for large 0 values, 0 > 57 ø. The plots of the hot-plasma refrac- tive index obtained by a numerical procedure of Horne
and $azhin [1990] and $azhin and Horne [1990] have
been well reproduced by our procedure when using thenumerical approximation of the dielectric tensor. The
same holds true for the other two frequencies, 1200 and 2400 Hz (not shown). Additionally, new branches of the
dispersion curves have been found near the resonance
angle. All presented curves are composed of four dis- tinct parts and were created by independent runs of the procedure for solving the dispersion relation. For each run the initial refractive index N was found analyzing all solutions of the dispersion relation for N < 1000. For
10,644
SANTOLIK AND PAPu•OT:
WAVE DISTRIBUTION FUNCTION IN A HOT PLASMA
1000 lOO lO Numeric ... Algebraic Cold ..' 5O t• -lOO o -150 -200 0.12 0.10 co 0.08 • 0.06 > 0.04 0.02 0.00 lO o -lo -20 -30 -40 -50 0 10 20 30 40 50 60 0 ø • 20 • 5 • 0 2.5 l.o ao5 ' o.o 0 10 20 30 40 50 60 oFigure 4. Solution to the wave distribution function (WDF) direct problem for equatorial hiss outside the plasmasphere. The frequency is 1800 Hz and corresponds to 0.6 f2,/2•r. A plasma model containing 18.1% of Maxwellian electrons with a temperature of 200 eV is assumed. The results obtained with three different procedures for the plasma dielectric tensor are compared. (left) Dependence of the solution of the dispersion relation on 0, refractive index, wave damping, and the group velocity vector of an elementary whistler wave. (right) Dependence of some integration kernels aij calculated for the same elementary wave on 0.
cal and algebraic procedures are presented in Figure 4. The wave growth obtained by the algebraic procedure is unrealistic, because the validity of the algebraic approx- imation fails for 0 > 52.8 ø, according to the conditions stated by Sazhin [1987, 1988].
As has been shown, the calculation of the spectra esti-
mates for a given WDF is straightforward once the val- ues of the integration kernels are known (see (7)). For example, a WDF shape modeled by several plane waves can be introduced by the summation of only the terms corresponding to the respective wave-normal directions. If the WDF shape is given as an analytic function, the spectra estimation represents a simple summation of a large number of known terms. The knowledge of inte- gration kernels is therefore crucial to solve the WDF di- rect problem. In Figure 4 (right), examples of the 0 de- pendencies of some integration kernels aij are presented. Three magnetic and three electric antennae were used, with their directions along the axes of the coordinate
system
of Figure 1. The electric
field (Ex, Ey, and
and magnetic field components, rescaled by the velocityof light (cBx, cBy, and cBz), have been used in place of the experimental signals ii in (6). The SI units have
been used to calculate absolute values of the kernels;
that is, their physical
dimension
is [V •' m J-1 Hz]. Four
representative examples of the kernels are drawn. The dependencies calculated with the cold-plasma approxi- mation of the dielectric tensor are equal to the results of the algebraic expressions derived by Storey and Lefeu- vre [1980]. They are also approximately equal to the hot-plasma solutions. For 0 values well below the reso- nance angle, the difference is less than 2%. Comparing the results of the two hot-plasma procedures (numeric and algebraic), an excellent conformity is obtained, ex-cept for 0 values above 50 ø, where a complex behavior of the numerical hot-plasma dependencies is observed.
The simpler algebraic approximation cannot be used so
near the resonance cone. However, this restriction is not very important, because it applies only in the case of heavily damped waves.
The results indicate that the hot-plasma approach
SANTOLIK AND PARROT: WAVE DISTRIBUTION FUNCTION IN A HOT PLASMA 10,645
plasmasphere. Hot electrons convected from the plasma sheet can influence the relative amplitudes and phases of
observed waves over a range of several degrees near the resonance cone. Therefore the shape of the integration kernels aij is biased against the cold-plasma case and
the reconstruction of the WDF should take this effect into account, especially if the waves are found near the
resonance angle.
The existence of several whistler-mode branches in
a narrow 0 interval near the resonance angle may be a problem arising from the hot-plasma approach; for a given wave-normal direction there are several values of the integration kernels and the WDF reconstruction be- comes more complex. In the particular case of Figure 4
the rejection of the heavily damped branches is a natu-
ral way to solve the problem. The characteristic length of wave damping of these branches can be estimated by using the presented results; the satellite must be at
a distance of less than several tens of kilometers from
the region of generation to observe the damped whistler
branches. However, if several branches with a compa-
rable damping rate are present (as was observed for wo/2•r = 2400 Hz), this straightforward solution can- not be applied and a more complex multimodal WDF
reconstruction is necessary.
4.2. Ion-Cyclotron Waves in the Auroral Magnetosphere'
Another example is taken from a different region of the Earth's magnetosphere. On the auroral field lines, wave propagation and stability can be affected by beams of energetic electrons. Alfv•n electromagnetic ion cyclotron (EMIC) waves are often observed simul- taneously with electron precipitation [e.g., Ternerin and Lysak, 1984]. Oscarsson and RSnnmark [1990] studied an EMIC wave emission observed on board the Viking satellite at an altitude of 4300 km. The study is based
on the data of two electric antennae and follows the
procedure of Oscarsson and RSnnmark [1989]. The main part of the observed wave energy was concen- trated around half of the local proton gyrofrequency. The observed auroral electrons are modeled by a drift- ing MaxwellJan distribution, with a drift energy of 4 keV and the relative density 0 1% of cold proton-electron
plasma.
The published solutions of the WDF direct problem correspond to the wave-vector-dependent representa- tion. A limited range of wave-vector components near
the resonance of EMIC waves is taken into account.
This solution has been compared with the output of our method. A range of frequencies from 19 Hz to the pro- ton gyrofrequency •H+/2•r: 190 Hz and a range of 0 values from 800 to 89.90 have been examined. The prin- cipal results in a selected part of this range are shown
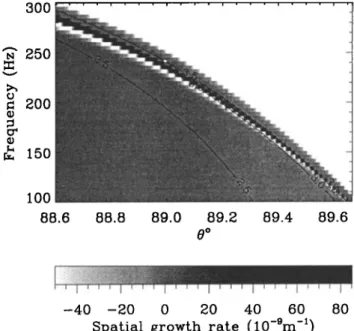
in Figure 5. The spatial growth
• = ..•w/2zrvg
is pre-
sented as a 3-D image in the gray scale. White corre- sponds to strongly damped waves out of the resonance cone, and the gray-to-black scale represents stable and growing waves. Three isolines provide rough informa- tion about values of the refractive index N. They are14 0
'""
:'.'"•'•:::•
...
87.0 87.5 88.0 88.5 89.0 89.5
0 ø
0 1 2 3 4
Spatial growth rate (10 -9 m -1)
Figure 5. Solution of the hot-plasma dispersion rela- tion in the auroral region for an altitude of 4300 km.
The hot-plasma model as in the work of Oscarsson and
RSnnmark [1990] has been used. The gray scale corre- sponds to the spatial-growth coefficient •w/2•rvg, plot- ted versus wave frequency coo, and the angle 0 between the wave-normal and the ambient magnetic field. The labeled isolines represent the common logarithm of the
refractive index.
labeled by the common logarithm of N; that is, they correspond to N: 316, 1000, and 3160. In the region
shown the minimum value is N: 150 for 0: 870 and
coo/2•r = 20 Hz. A fiat maximum of the spatial growth is found at 0 • 88.60 and at frequency coo/2•r • 100 Hz, which agrees with the observed maximum of wave ac- tivity. The corresponding refractive index is N • 470. To compare these results with the original solution of Oscarsson and RSnnmark [1990], a transformation was made to the space of wave vectors. The published re- sults are well reproduced, including the absolute values of the wave-growth coefficient.
Note that the obtained maximum wave growth of 4.3 x10 -9 m -1 is too small to explain the observations. The amplification of the wave amplitude by a factor of 7 is needed to get the observed signal-to-noise ra- tio. With a spatial growth rate of 4.3 x 10 -9 m -• the waves must propagate across a distance of 7.2 x 10⁷ m,
which corresponds to an unrealistic distance of about
11 Earth radii. A wrong assumption may have been
made about the form of the distribution function of the
electron beam in the generation region. Gustafsson et al. [1990] noted that the wave growth may be increased by a higher density and smaller thermal spread of the model beam. The approximative calculation of Ternerin and Lysak [1984] provides a higher spatial growth for a smaller drift energy of the beam. As will be confirmed
by our numeric results, an increased beam density and
10,646 SANTOLIK AND PARROT: WAVE DISTRIBUTION FUNCTION IN A HOT PLASMA
growths, but the propagation characteristics of EMIC
waves become more complex.
Erlandson et al. [1994] recently studied the auro- ral region at lower altitudes (about 1800 km) using the
data of the Freja satellite. EMIC waves were observed
in the region of electron precipitation at an invariant latitude of 69 ø. An estimation provides a low plasma electron density of 40 cm -a. Wave emissions were con- fined to the following two frequency bands: (1) low- frequency waves below the local oxygen gyrofrequency (f2o+/2•r .• 25 Hz), with a maximum activity at 8 Hz, and (2) higher-frequency waves, between the local he- lium (f214e+/2•r • 100 Hz) and hydrogen gyrofrequen-
cies, peaked at about 130 Hz.
No analysis of wave propagation and stability was made for this event, and we have applied the developed method to this case for the following reasons. (1) Using the solution to the dispersion relation of EMIC waves, we can deduce the main properties of wave propagation and we can attempt to explain the observed spectrum. (2) The possibility and usefulness of the WDF recon-
struction for similar events can be verified.
The propagation characteristics of EMIC waves are strongly influenced by the relative abundance of ion species. We thus need this information as input data for the resolution of the WDF direct problem. As di- rect measurement of the thermal plasma composition
2 4 6 8
% He +
0 1 2 3 4
Refractive index
Figure 6. The refractive index of electromagnetic ion cyclotron (EMIC) waves in the higher-frequency band of the event described by Erlandson et al. [1994] versus the relative abundance of helium and oxygen ions. The scale corresponds to 0: 0 ø The following three regions with different qualitative properties of wave propaga-
tion are shown
(from top right to bottom left): evanes-
cent waves, unducted waves without plasma resonance,and ducted waves with a resonance near 0 = 90 ø. The
plasma was assumed to be cold.
has not been published by Erlandson et al. [1994], we
will use the wave observations as an estimator of these
data. The ion composition mainly affects the higher-
frequency band of observed EMIC waves. We will first
suppose a plasma composed of cold hydrogen, helium, and oxygen ions and cold electrons. Figure 6 shows a view of the propagation of left-polarized EMIC waves at 130 Hz for various ion compositions. The scale of
gray shades represents the value of the refractive index
N for 0 : 0 ø. In the region above the diagonal the mode is evanescent and the waves do not propagate in a plasma with higher oxygen and helium fractions. The dotted line represents the cutoff (N = 0). From the cut-
off to the bottom left corner
(where 100% of H + is as-
sumed), the refractive index increases up to N = 4. The oblique, light-colored boundary line corresponds to the ion composition where the crossover frequency is equal to 130 Hz. On this line, two cold-plasma modes are ex- changed. The crossover line bounds a region where the waves have a plasma resonance (N --• oo) near 0: 90 ø. Outside of this region, there is no resonance of EMICwaves. The waves with resonance have the direction of
group velocity nearly always aligned with the ambient magnetic field. The waves without resonance have the group velocity roughly aligned with the phase velocity; that is, the group velocity has the direction of the DC magnetic field only for 0 m 0 ø.
The stopband in the measured spectra [Erlandson et al., 1994] between the local He + and O + gyrofrequen-
cies is an important feature of the event. A more de-
tailed analysis of the wave propagation shows that the observed spectrum implies a negligible fraction of He + ions. If only 1% of helium were supposed, the wave propagation below fli•+ would be possible in a band- width of •fli•+ , and a new stopband above f214•+ would be induced. Nevertheless, the presence of O + and H +
fractions is required to explain the observed stopband.
Its lower boundary is then defined by the local oxygen gyrofrequency. If the higher frequency band contains
left-polarized EMIC waves, the boundary at 100 Hz can be explained in two different ways.
1. The first is the cutoff of EMIC waves. The cor-
responding ion-composition estimate is 20% of O + and 80% of H + The EMIC waves above 100 Hz propagate in a mode without plasma resonance. The frequency
interval where the theory predicts the impossibility of propagation of EMIC waves corresponds to the observed stopband.
2. The second is the crossover of EMIC waves. This
corresponds to a composition with 5% of O + and 95% of H + The EMIC waves above 100 Hz have a plasma resonance, and their group velocity is directed along the
field lines.
Figure 7 presents the solution to the WDF direct
problem for a higher band of observed EMIC waves (a representation similar to that in Figure 4 has been
1
used)'
a frequency
of 130 Hz ( m •fli•+) and a plasma
with 95% of cold H + and 5% of cold O + have been sup- posed. The model plasma composition follows case 2 of the analysis presented above. However, the majoritySANTOLIK AND PARROT: WAVE DISTRIBUTION FUNCTION IN A HOT PLASMA 10,647 100 0.260 0.250 0.240 0 230 - 0.220 0.210 0.200
•.• 16
• 8 ' i , , , i , , , i , , , i , •6 • 4 • •2 e 0 , o ' i i i i i i i • I i .... •-6 [• -8• 60
...
• 50 o • 30 ... • 20 ... 0 20 40 60 80 0 20 40 60 80 0 ø 0 ø[igure 7. Example of [he solution of [he WDE direc[ problem for ducted EMIC waves in the
auroral
region.
The observed
frequency
of 130 Hz (• •.+/2•)is
assumed.
The dashed
line
represents the cold-plasma approxima[ion of [he dielee[rio •ensor, and •he solid line corresponds [o numeric resul[s involvins auroral elec[ron beams. (leR) Dependence of •he solu[ion of dispersion rela[ion on 0, refrac[ive index, group-veloci[y modulus normalized [o [he velocity of lisht, and devia[ion of [he group veloci[y from [he ambien[ masne[ic field. (fish[) Several in[esration kernels aii in SI units versus 0.
4
0 -2
of H + is unusual at low altitudes where the observa-
tions have been made [e.g., see Lefeuvre et al., 1992]. In
Figure 7 the cold-plasma approximation of the electron
distribution (dashed line) is compared with the hot- plasma numeric results (solid line) in the whole range of 0 values. The hot-plasma model was chosen in ac- cordance with the electron-energy spectra published by Erlandson et al. [1994]. A low temperature of i eV
was assumed for the main Maxwellian component of
electron distribution. Maxwellian electrons with higher
temperature are not apparent in the spectra. Two drift-
ing Maxwellian beams with drift energies of i keV and 100 eV have been added. They propagate earthward in the direction parallel to the ambient magnetic field. The energy corresponding to the thermal spread of the beams has been fixed at 0.1 of the respective drift ener- gy. The published spectra are not calibrated to the
absolute values of electron flux. The relative number of electrons in the beams must therefore be treated as a
free parameter. A relatively high fraction of beam elec-
trons has been assumed to emphasize hot-plasma effects
on the wave propagation; each beam is taken to contain 1% of the total electron density. Figure 7 shows a slight
difference between the hot- and cold-plasma solutions,
especially in the 0 range from 200 to 600 . The wave dispersion expressed by the refractive index is practi- cally not affected by this difference, whereas the group velocity and integration kernels exhibit a small bias of several percent (up to 8% in the case of kernel aBzBz).
All differences are due to the electron beams. The re-
placement of the 1-eV Maxwellian electrons by their cold-plasma approximation has a negligible effect on the
obtained results as well as the use of 1-eV Maxwellian ions in place of the cold ones.
A surprising effect is that the electron beams influ- ence wave propagation relatively far from the resonance, where no effects concerning the wave stability occur. More pronounced hot-plasma effects over a wider range of 0 values might be supposed in the case of a sub-
10,648 SANTOLIK AND PARROT: WAVE DISTRIBUTION FUNCTION IN A HOT PLASMA ß .:.... 2.:: :•,:,•: .,. ß ...,,-:• ,,,,,•.-... .. ..•N.,::•. -.: ... .. • : ,•<•;:.,.:,•.• . 250 ... •.•:;.•: ... *,•:z"!.•;•-, • ':..* --;'•':'•?*:. ß 200 '" t:• ... •"'•:•:':'"" •'•.:':,.• '%•[•:::. 150 10 0 ... *•*• ... 88.6 88.8 89.0 89.2 89.4 89.6 o -40 -20 0 20 40 60 80
Spatial growth rate (10-9m
-1)
Figure 8. Solution of the hot-plasma dispersion rela-tion of ducted EMIC waves at an altitude of 1700 km.
The plasma
model
consists
of 95% of cold H + ions, 5%
of cold O + ions, 99.9% of Maxwellian electrons with a temperature of 1 eV, and 0.1% of auroral electrons forming a beam with the drift energy 1 keV and ther- mal energy 100 eV. The spatial growth rate is plotted as a two-dimensional function of the frequency and 0. Three isolines correspond to the wave refractive indices 316, 1000, and 3160 and are labeled by the common logarithms of these values.bution. Such a distribution has been reported, e.g., by
Gustafsson et al. [1990] from orbit 849 of the Viking satellite, where over 10% of the total electron density
is observed as Maxwellian electrons with a temperature of 500 eV. Our calculations show that the influence on
the obtained curves is negligible, even if 20% of 500 eV
electrons are assumed to be present.
Near the resonance angle, the auroral electrons can exchange their energy with the EMIC waves. The 0
interval where unstable waves can be found is very nar-
row, below the resolution of Figure 7. The solution for
the dispersion relation has been used to analyze wave
stability near the resonance. Figure 8 shows the solu-
tion to the complex dispersion relation as in Figure 5.
The spatial growth rate is presented in the frequency- 0 plane by shades of gray. Approximate information
about the values of the wave refractive index is given
by isolines. The plasma model consists of cold ions (95%
H + and 5% O+), Maxwellian
electrons
with a tempe-
rature of 1 eV, and a single electron beam with the drift energy 1 keV. The energy of the thermal spread has been assumed to be 0.1 of drift energy, and beam electrons are supposed to constitute 0.1% of the totalelectron density. A narrow interval of 0 values of about 1 ø near the resonance is examined. The range of fre-
i •'•H+ quenc}es covers the observe(] spectra] peak from •
3•H+ A fine step-like
structure
is an artifact due
to • .to a finite number of examined frequencies. A light region in the top right part of Figure 8 corresponds
to heavily damped waves outside the resonance cone.
At a fixed frequency and with decreasing 0 we first see a short, fiat interval of relatively stable waves, then a sharp positive peak of growing waves, and suddenly, a deep negative peak of wave damping. For low 0 values the waves are stable (represented by the gray area at the bottom left of Figure 8) and the wave parameters are
not far from the cold-plasma approximation as shown
in Figure 7. For an increasing frequency the maximum
spatial growth rate increases
from about 3x 10
-8 m -1
to over 8 x 10 -8 m -1 contrary to the trend observed inthe measured spectrum, where the maximum intensity
falls in lower frequencies. The absolute values of wave growth are higher than in the case of the EMIC waves in Figure 5, but they are still insufficient to explain the observed signal-to-noise ratio.
150 lOO o z 50 o lOO 50 -lOO -150 :. ... i
...
:•'"'i
100 eV res.
I•11illllllll ... I ... ... I ... I ... I ... 89.95 89.96 89.97 0 øFigure 9. Parallel projection of the (top) refractive index and the (bottom) spatial growth rate (, plot- ted versus 0. The plasma model is assumed to be as in Figure 8, with a frequency corresponding to the higher-frequency peak in the measured spectrum (130
i
/271').
The solid
line corresponds
to zero
ion
Hz • 5•+
temperature (cold-plasma approximation), the dashed line corresponds to Maxwellian ions with a temperature
of i eV, and the dotted line represents the ion tempe- rature of 10 eV. The resonance condition for the 1-keV
electron beam corresponds to the horizontal line in Fi-
gure 9 (top), where
the beam velocity
(v• • 1.88 x l08
m/s) is equal to phase velocity v/.SANTOLIK AND PARROT: WAVE DISTRIBUTION FUNCTION IN A HOT PLASMA 10,649
The influence of a finite ion temperature is shown
in Figure 9. The solid lines present a horizontal cut of Figure 8 for the frequency 130 Hz (the location of the higher frequency peak in the measured spectrum). The dashed and dotted lines were calculated using the
same plasma model, except for the temperature of ion components. The cold-plasma approximation has been replaced by a Maxwellian distribution with the tem-
peratures 1 eV (dashed line) and 10 eV (dotted line). The approximate condition for the Landau resonance (the phase-velocity projection equal to the beam ve- locity) is plotted in Figure 9 (top). Near the 0 value,
where the condition is fulfilled, the positive peak of the
wave growth occurs. Its shape is almost independent of the ion temperature. For a higher 0 a fiat secondary peak is observed. Its width is strongly dependent on the ion temperature. This interval of weakly growing
waves may be interpreted as a resonance on the proton
gyrofrequency. As demonstrated, the finite ion tem-
perature has no substantial influence on the total wave
growth, because the Landau resonance is the main ge-
neration mechanism at observed frequencies.
We also analyzed the wave stability in the observed low-frequency band of EMIC waves. The results, simi-
lar to those presented in Figure 8, were obtained for the same plasma model. The general shape of the de- pendence of wave growth on 0 and frequency has been
conserved. The only differences are a more compressed
scale of 0 values (the hot-plasma effects are observed in a scale of 0.01 ø) and much lower absolute values of the spatial growth rate. At 8 Hz (the maximum intensity in the lower band of the measured spectrum), wave growth reaches only about 6% of the value at 130 Hz.
To study how the wave growth depends on the rela-
tive abundance of beam electrons and on the drift ener-
gy of the beam, the original plasma model from Fig-
ure 7 has been assumed. Two dense electron beams
with energies of 100 eV and 1 keV are expected to in- crease substantially the wave growth at 8 Hz. Figure 10 presents the obtained results in a form similar to that in Figure 9. Near the resonance angle, the solution of the dispersion relation is split into three independent
branches. The conditions for the Landau resonance of
both beams are plotted in Figure 10 (top), which shows that two branches contain the growing waves (dashed and dotted lines). Each of them fulfills the resonance
condition of the respective beam. The third branch
(solid line) follows the cold-plasma solution and be-
comes damped near the cold-plasma resonance. The influence of the respective plasma components is com-
pletely separated. If just one beam is present, only the corresponding branch exists without substantial changes. In accordance with the results of Ternerin and Lysak [1984], the 100-eV beam causes greater spatial wave growth than the 1-keV beam. However, the tem- poral growth .,•co/•co is approximately equal for both beams, and the difference is due to a lower group veloc- ity of the 100-eV branch. A fiat secondary peak on the
100-eV branch is interpreted as the resonance on the
first harmonic of the oxygen gyrofrequency (25 Hz). Its
150 lOO o 5O 0 6O 4O -20 -40 -60 89.50
cøld•/
,
1
eV . '
...
"i0 eV
...
I 1 ...'"' ! ! I I ..'"-
/
/.
Ncos
0 = c/vu
I I I _ : , ,: , , i , , i, i , i I i s i i .... 89.55 89.60 89.65 0 ø 10 eV ß ., iFigure 10. Same as Figure 9, but with the plasma model with two dense electron beams as in Figure 7 used to study the increase of wave growth in the low-
frequency
band
(8 Hz • «go+/2•r)of observed
EMIC
wavesø Three separate branches are marked with dif- ferent line styles. The solid line corresponds to a damped branch connected with the Maxwellian plasma, the dashed line represents a branch resonant with the
1-keV beam, and the dotted line is a branch resonant
with the 100-eV beam. The resonance condition for
both electron beams is drawn.
intensity is again much lower than the growth due to
the Landau resonance.
With the plasma model containing more free energy, same-order values of the wave growth have been oh- tinned as for the previous results in the higher-frequency band. However, with the same model the wave disper- sion at 130 Itz exhibits similar properties as reported in Figure 10, and the wave growth is again more than 16 times higher than at 8 Hz. Note that the influence of in- creasing the beam density is not only quantitative; the behavior of wave dispersion near the resonance qualita- tively changes and new EMIC branches occur. The ef- fect of beam temperature has been studied without ob- taining new information about the rate of wave growth in the higher and lower EMIC bands. While decreas- ing the thermal spread of the beam, the growth rate increases in both bands by approximately the same fac- tor. The results of the presented preliminary analysis of linear instability of EMIC waves disagree with the observed spectrum, mainly in the following points. (1)
10,650 SANTOLIK AND PARROT: WAVE DISTRIBUTION FUNCTION IN A HOT PLASMA
The wave growth obtained for the low-frequency band is only about 6% of the growth in the higher-frequency band, but the waves are observed in both bands. (2) In both bands a higher growth has been obtained for higher frequencies. The slope is rather inverse in the
measured spectrum.
Some effects probably cannot be explained by the li- near theory of homogeneous media that was used in our analysis. The disagreement may be also due to a diffe- rence of the assumed plasma model from the conditions in the generation region, in which case, propagation ef-
fects should be taken into account. The reconstruction
of the WDF can be an important tool in the analysis of EMIC waves. Propagation effects may lead to splitting of wave normals into two different directions [Parrot and Lefeuvre, 1986], or the observed wave normals can be declined from their original directions. The WDF
reconstruction on selected frequencies would therefore
help to find the most probable interpretation of the ob-
served spectrum.
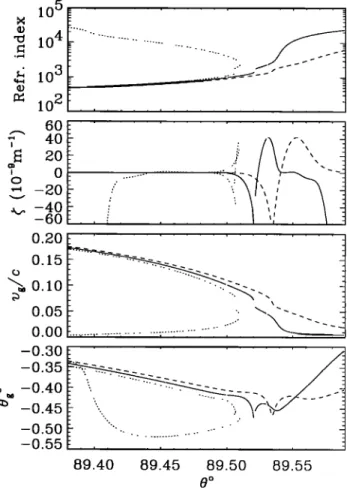
4.3. Influence of the Doppler Effect
The Doppler effect was not taken into account in any
of the cases presented above. If a satellite velocity of 5 km/s is supposed, a nonnegligible bias of the observed frequency requires a relatively high refractive index of several thousands. In the case of Figure 9 or 10 this con- dition is fulfilled and the Doppler effect should be taken
into account. To do this, we need information about the wave normal directions of the observed waves. The re- construction of the WDF or an equivalent approach is
therefore necessary. Figure 11 presents an example of
effects which can be obtained when the Doppler effect is taken into account. A plasma model as in the case
of cold ions in Figure 9 is supposed. The solid line rep-
resents the same solution of the dispersion relation as
presented by the solid line in Figure 9; that is, the satel- lite velocity vo is supposed to be perpendicular to the
wave normal, and no Doppler effect is seen.
The dashed line corresponds to the satellite velocity
nearly antiparallel to the wave normal. The compo-
nent vox(p)
of the velocity
(i.e., the projection
of vo to
the axis xx(p)
of the coordinate
system
of Figure
1) is
equal to 5 km/s and the wave normal is defined by the angle ;b=180 ø. For lower 0 values the refractive index is not sufficiently high to observe an influence of the
Doppler effect. If 0 > 89.55 ø, the Doppler effect causes
decreasing of the refractive index and an extension of the interval where the hot plasma effects are observed. The dotted line presents the results when the satel- lite velocity is nearly parallel to the wave normal. The
normal is now defined by ;b = 0 ø for the same com-
ponent vox(p)
of the velocity. For lower • values
and
lower refractive index, the results are again identical to those in the case without the Doppler effect. However,as the refractive index increases, important differences are obtained. At the • value, where the maximum wave amplification is observed, the EMIC mode solution is
mirrored to the lower 0 values, with increasing refractive index. This phenomenon has a clear consequence con-
105
104
3 10102
60 40 20 0 20 40 60 20 15 10 05 00 30 35 40 45 50 55 89.40 89.45 89.50 89.55 0 øFigure 11. Dependence of the solution of the Doppler- shifted dispersion relation on 0. (top to bottom) re- fractive index, spatial growth rate, group-velocity mo- dulus normalized to the velocity of light, and devia- tion of the group velocity from the ambient magnetic field. The solid line corresponds to the case without the Doppler effect, the solution taking into account the
velocity
vox(p)
of 5 km/s is presented
by the dotted
line,
and the dashed line corresponds to an opposite veloci- ty. The plasma model is assumed as in Figure 8, with a frequency corresponding to the higher-frequency peakin the measured
spectrum
(130 Hz • 5 +
cerning the WDF problem; the multimodal approach
described in section 2 must be used.
5. Conclusions
This paper contains a detailed characterization of the
WDF in a hot plasma.
A resolution
of the direct
prob-
lem has been made, taking into account
the Doppler
effect. Our approach is essentially similar to the cold-plasma
method
of Storey
and Lcfcuvrc
[1980],
and it is
different
from Oscarsson
and Rb'nnmark
[1989].
We use
an explicit frequency dependence of the WDF which is well related to the experimental data recorded by satel-lites.
Our detailed theoretical analysis of different waves in a hot plasma has provided a description of physi-