HAL Id: hal-01829920
https://hal.archives-ouvertes.fr/hal-01829920
Submitted on 4 Jul 2018
HAL is a multi-disciplinary open access
archive for the deposit and dissemination of
sci-entific research documents, whether they are
pub-lished or not. The documents may come from
teaching and research institutions in France or
abroad, or from public or private research centers.
L’archive ouverte pluridisciplinaire HAL, est
destinée au dépôt et à la diffusion de documents
scientifiques de niveau recherche, publiés ou non,
émanant des établissements d’enseignement et de
recherche français ou étrangers, des laboratoires
publics ou privés.
Mediterranean:standing stocks, bacterivory and
relationships with bacterial production
Urania Christaki, France van Wambeke, John Dolan
To cite this version:
Urania Christaki, France van Wambeke, John Dolan. Nanoflagellates (mixotrophs, heterotrophs and
autotrophs) in the oligotrophic eastern Mediterranean:standing stocks, bacterivory and relationships
with bacterial production. Marine Ecology Progress Series, Inter Research, 1999, 181, pp.297-307.
�10.3354/meps181297�. �hal-01829920�
MARINE ECOLOGY PROGRESS SERIES
Mar Ecol Prog Ser
1
Published May 18Nanoflagellates (mixotrophs, heterotrophs and
autotrophs)
in the oligotrophic eastern
Mediterranean: standing stocks, bacterivory
and relationships with bacterial production
Urania Christakill*, France Van wambeke2, John R. ~ o l a n ~
'NCMR Aghios Kosmas, GR-16604 Hellinikon, Greece
Z ~ i c r o b i o l o g i e Marine, CNRS, UPR 223, Campus de Luminy, Case 907, F-13288 Marseille, Cedex 9, France 3 ~ a r i n e Microbial Ecology. CNRS ESA 7076. Station Zoologique, F-06234 Villefranche-sur-Mer, Cedex. France
ABSTRACT: The vertical distribution (0 to 100 m) and abundance of nanoflagellates were examined in the oligotrophic Aegean Sea (east Mediterranean) in early spring (south basin) and late summer (north and south basins) of 1997 in the framework of the MATER project (Mass Transfer and Ecosystem Response). Different trophic types of nanoflagellates (mixotrophic, heterotrophic, and phototrophic) were identified based on the possession of chloroplasts and the consumption of Fluorescently Labelled Mlnicells (FLM). Bacter~al production (leucine method) was compared with bacterivory estimated from FLM consumption. We found that mixotrophic nanoflagellates played a small role as bacterivores rela- tive to heterotrophic nanoflagellates and total bacterivory roughly balanced bacterial production. In early spring with cool (14.2"C) well-mixed water columns, flagellate concentrations were lowest, pho- totrophic flagellates were the dominant group and concentrations varied little with depth. Average concentrations of mixotrophs, heterotrophs and autotrophs were 0.07, 0.34, and 0.64 X 10³ cells ml-', respectively. Bacterial production in the 0 to 100 m layer averaged about 0.74 pg C 1-' d-'. Estimated nanoflagellate bacterivory from FLM ingestion accounted for 4 0 % of bacterial prod'uction with mixotrophic nanoflagellates consuming 5 % of bacterial production. In late summer, total nanoflagel- late concentrations were higher. Average concentrations of mixotrophs, heterotrophs and autotrophs were 0.09, 1.14, and 0.66 X 10³ cells ml-', respectively, in the southern basin and 0.09, 1.1, and 0.98 X
lo3 cells ml-l, respectively, in the northern basin. In September, bacterial production for both basins roughly balanced estimated nanoflagellate consumption. Similar to the March estimates, mixotrophic nanoflagellates accounted for about 5% of nanoflagellate bacterivory. In a nutrient enrichment exper- iment in March, treatments including phosphorus resulted in increased bacterial production and reductions in identifiable mixotrophs.
KEY WORDS: Nanoflagellates Bacteria . Bacterial production . Mixotrophy . MATER project
INTRODUCTION
In oligotrophic systems, carbon stocks in the form of
bacteria are proportionately larger compared to more productive systems (e.g. Gas01 et al. 1997). Hence, in an oligotrophic system, bacterivory should represent a substantial carbon flux pathway but the fate of bacter- ial production is difficult to predict. Commonly, hetero-
trophic nanoflagellates are recognized as dominating bacterivory although mortality due to viral attack can be important in coastal waters (Fuhrman & Noble 1995). However, oligotrophic conditions generally cor- respond to concentrations of bacteria below 1 X 10⁶ cells ml-', lower than levels often associated with effi- cient bacterivory by heterotrophic nanoflagellates (Fenchel 1982, Eccleston-Parry & Leadbeater 1994, Zubkov & Sleigh 1995) or significant mortality d u e to viruses (e.g. Steward e t al. 1996). Furthermore, in olig- otrophic systems, inorganic nutrients can limit both O Inter-Research 1999
Fig. l . Station locations in the Aegean Sea
primary and bacterial production, leading to competi- tion between autotrophs a n d heterotrophs. In such a situation, mixotrophy among chloroplast-containing nanoflagellates may become a dominant trophic strat- egy, one of 'eating your competitor1-heterotrophic bacteria (Nygaard & Tobiesen 1993, Riemann et al. 1995, Thingstad et al. 1996). Thus mixotrophy, the combination of photoautotrophic and heterotrophic nutrition in a single individual, is used here in the more restricted sense of the combination photosynthesis and phagotrophy (Riemann et al. 1995).
It seems reasonable to expect that bacterivory from mixotrophic nanoflagellates could be important in olig- otrophic systems. Interestingly, at present there is very little data available concerning the abundance and activities of mixotrophic nanoplankton in oligotrophic marine systems. Previous studies have largely con- cerned brackish water environments (Epstein & Shiaris 1992, Havskum & Riemann 1996, Havskum & Hansen 1997) while data from coastal waters suggested that phytoflagellates may dominate bacterivory (Hall et al. 1993, Nygaard & Tobiesen 1993). Data from the olig- otrophic Sargasso Sea suggest a small proportion of phytoflagellates ingest bacteria (Arenovski et aI. 1995).
The Aegean Sea is a sub-system of the eastern Mediterranean and can be considered oligotrophic in terms of annual averages of standing stocks of chloro-
phyll, approximately 20 mg chl m-2 (Balopoulos et al. 1997) or in terms of primary production, approximately 68 mg C m-2 d-' (Ignatiades 1998). Cruises in the Aegean were conducted as part of the European pro- ject MATER (Mass Transfer and Ecosystem Response). The overall project goal is the collection of data on the dynamics of water masses and the behavior of dis- solved and particulate matter (especially carbon) for the eventual construction of a predictive model of the Mediterranean. Aegean stations were sampled when the water column was mixed, in March 1997 in the southern Aegean and in both the north and south Aegean in September 1997, in typical late summer conditions of thermal stratification.
The goal of our study was to examine the relation- ship between the consumption of heterotrophic bacte- ria by nanoflagellates and bacterial production, paying particular attention to the role of mixotrophic nanofla- gellates. We estimated bacterial consumption by het- erotrophic and mixotrophic nanoflagellates using prey analogs and compared it with bacterial production estimated via 3H-leucine method. We also examined the role of inorganic nutrients a s a factor influencing mixotrophy among nanoflagellates and bacterial pro- duction rates in a n oligotrophic marine system.
MATERIALS AND METHODS
Study site, sampling strategy. Both the north and
the south Aegean (Fig. 1) can be characterized as oligotrophic but in the north, due to input from the Black Sea and rivers, there are regions with higher productivity (e.g. fishery activity is concentrated in the northern part of the Aegean). The water mass of the south Aegean is of Levantine origin (LIW, Levan- tine Intermediate Water), which is typically oligo- trophic.
The sampling strategy was to sample 2 contrasting seasons. The first part of this study was carried out from 6 to 9 March 1997 in the southern Aegean Sea (eastern Mediterranean), during the first cruise of the MATER program, on the RV 'Aigaio' (Fig. 1, south Aegean MATER stations, Stns S1, S2, S6 and S?, depth 1300 to 2000 m ) . In March in the south Aegean, the water column was well mixed, phosphate concentra- tions were <0.05 p M (Souvermetzoglou et al. unpubl. data) in the 0 to 100 m layer and water temperature was 15.0°C. Water samples were collected in the euphotic zone at depths of 5, 10, 30, 50, 75 and 100 m. The second cruise was conducted from 9 to 23 Sep- tember 1997. During this cruise, 6 stations were sampled for rnixotrophic flagellates in the south ( S l , S2, S3, S4, S6 and S?, depth 900 to 2200 m) and 7 stations in the north Aegean ( N I to N7, depth 100 to 1200 m). In
Christakl et al.: Nanoflagellates In the oligotrophic eastern Medterranean 299
September, the water column was stratified, the tem- perature in the south Aegean was approximately 23°C in the surface layer a n d 15°C at 100 m depth. In the north, water temperatures were 18 to 20°C and 15°C at the surface and 100 m, respectively. The lower tem- perature and salinity in surface waters (salinity: 36.5 in the north versus 39.5 in the south) of the northern part is due to the influence of the Black Sea water. The PO, concentrations were <0.05 pM in most cases, the high- est PO4 concentration measured was 0.08 pM in the north Aegean (Souvermetzoglou et al. unpubl. data).
Nanoplankton and picoplankton abundance, bacte- rial production. To enumerate phagotrophs among chlorophyll-containing nanoflagellates, w e added flu- orescent food tracer particles: FLM (Fluorescently Labelled Minicells) or FLB (Fluorescently Labelled Bacteria). The FLM (0.65 pm diameter) were prepared following the protocol of Pace et al. (1990), the FLB were large cells (length 1.6 to 2.4 pm, ESD 0.8 to 1.0 pm) and were prepared following the protocol of Sherr et al. (1987). Both FLM and FLB were briefly son- icated (30 s) on-board before every experiment to obtain monodispersed prey items. The final concentra- tion of prey items in the experimental bottles was approximately 0.5 X 10⁵ ml-l. The uptake of FLB was evaluated only during the March cruise in the south Aegean for reasons that a r e explained below in the 'Results'.
Sampling was always conducted a t 10:OO to 11:OO h. Acid-cleaned 150 m1 glass bottles were filled with sea- water from each depth in duplicate (1 bottle for FLM and 1 for FLB). Before inoculation with the fluorescent tracers, bottles were left undisturbed for 1 h in a ther- moregulated water bath. Incubation temperature in March was 15°C for all depths since the water column was well mixed. In September, because of the pres- ence of the thermocline, w e used 2 incubation temper- atures corresponding to those above and below the thermocline.
After adding prey analogs, subsamples were imme- diately withdrawn for To counts, a n d counts of bacteria, cyanobacteria, initial densities of tracer particles, a n d nanoplanktonic organisms. Samples were preserved with ice-cold glutaraldehyde at a final concentration of
2 % . Subsequent subsamples of 30 m1 were removed
from bottles after 50 min to establish the abundance of mixotrophs. The time of 50 min was chosen to assure a 'maximal' uptake by phagotrophic organisn~s (Ny- gaard & Tobiesen 1993, Havskum & Hansen 199?), considering also that particle digestion of protists has been calculated to be 55 to 95 min for FLB at 12 to 16°C (Sherr et al. 1987). Samples were kept in the refrigera- tor and filtered 2 h after fixation on black Nuclepore filters (0.2 pm for picoplankton counts and 0.8 pm for nanoplankton counts), stained with DAPI (Porter &
Feig 1980) and stored at -20°C until counting. All populations were enumerated using epifluorescence microscopy, autofluorescence was distinguished under blue (chlorophyll, labelled bacteria) a n d green (cyano- bacteria) light excitation.
Among the nanoplankton in the size range 2 to 10 pm we differentiated 3 functional groups: HN (Hetero- trophic Nanoflagellates), PN (Phototrophic Nano- flagellates, i.e. all chloroplast-containing nanoplank- tonic protists) and MN (Mixotrophic Nanoflagellates, i.e. chloroplast-containing nanoplanktonic protists with ingested particles). In the text when w e refer to PN we mean total chloroplast-containing cells in- cluding MN.
At least 150 to 250 HN and PN were examined in each sample. This relatively low number is d u e to the low abundance of organisms (even with 30 m1 filtered) and was the best compromise between statistics and time spent on every sample examination. The organ- isms were classified in 4 different size categories (2-3, 3-5, 5-7 and 7-10 pm), using a n ocular micrometer. Biovolume-carbon conversion factors were 250 fg C pm" for cyanobacteria (Kana & Glibert 1987), 220 fg C pm" for HN a n d PN (Bnrrsheim & Bratbak 1987). Bacte- rial abundance data were converted to biomass using 20 fg C cell-' (Lee & Fuhrman 1987). Our choice of a factor of carbon content of bacteria, 20 fg C cell-', is commonly employed. However, recent studies have underlined the uncertainties involved in applying a constant conversion factor, which for small cells could range between 5 and 40 fg C cell-' (Theil-Nielsen & Sondergaard 1998). In a recent paper, Robarts et al. (1996) calculated a carbon content of 15.1
+
3.7 fg C for 87 % and 24.1+
15.6 fg C for the remaining 13 % of bacteria in the southeastern Mediterranean Sea. Hence, while the use of 20 fg C cell-' in our study looks reasonable, bacterial biomass estimates should b e interpreted with some caution.Bacterial production. Bacterial production was esti- mated by the 3H-leucine method (Kirchman et al. 1986, Kirchman 1993). At each depth, duplicate samples and a control were incubated with 1 nM L-[4,5 3H]-leucine (specific activity 128 Ci mmol-' in March, 158 Ci mmol-' in September)
+
19 nM non radioactive leucine. Samples were incubated in the dark, at in situ temper- ature. Bacterial production was calculated according to Kirchman (1993) from 3H-leucine incorporation rates. Determination of the isotopic dilution factor is described below.During the March cruise, time series experiments were carried out in order to choose the appropriate incubation time for a certain level of activity. We also performed concentration kinetic experiments to verify that the total concentration of leucine added (20 nM) was sufficient to saturate incorporation and, conse-
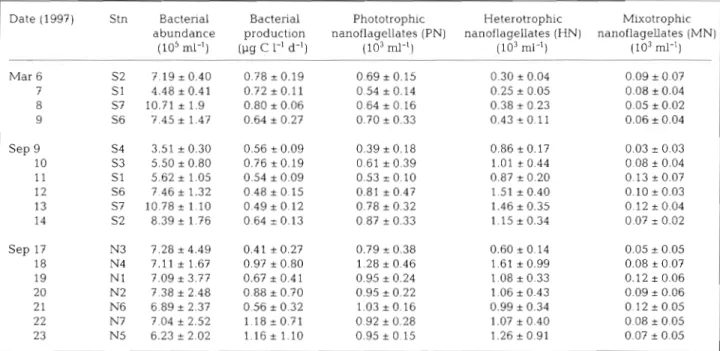
Table 1. Mean population abundance ( SD, n = 6 depths) and bacterial production in the 0 to 100 m layer in the south and north Aegean
Date (1997) Stn Bacterial Bacterial Phototrophic Heterotrophic Mixotrophic abundance production nanoflagellates (PN) nanoflagellates (HN) nanoflagellates (IMN)
(105 ml-l) @g C 1-1 d-l) (103 ml-l) (103 ml-l) (103 MP) Mar 6 S2 7.19
*
0.40 0.78 t 0.19 0.69*
0.15 0.30 i 0.04 0.09 i 0.07 7 S1 4.48*
0.41 0.72*
0.11 0.54*
0.14 0.25 i 0.05 0.08*
0.04 8 S7 10.71*
1.9 0.80*
0.06 0.64*
0.16 0.38 a 0.23 0.05*
0.02 9 S6 7.45*
1.47 0.64 * 0.27 0.70 2 0.33 0.43 t 0.11 0.06 2 0.04 Sep 9 10 11 12 1 3 14 Sep 17 18 19 20 21 2 2 23quently, to check that isotopic dilution would be negli- gible. For this purpose, w e added constant concentra- tions of labelled leucine (1 nM) and 5 different con- centrations of non radioactive leucine (1.8 to 37 nM). The plot of Tlf (inverse of radioactive leucine fraction incorporated per unit time) against leucine concentra- tion allows the calculation of an index of isotopic dilu- tion (X intercept) a n d the V,,,,, (inverse of the slope, Pollard & Moriarty 1984, Kirchman et al. 1986). Using the above concentration we found no isotopic dilution in the samples (ID = 1, for more details about the method, see Van Wambeke et al. in press).
Enrichment experiment. Response of microbial pop- u l a t i o n ~ to nutrient and/or carbon addition was exam- ined in a small-scale enrichment experiment at Stn S1 m March. Inorganic nutrients and carbon were added to seawater from 50 m depth to stimulate the activity of both phytoplankton and heterotrophic bacteria. The concentrations of NO3 and PO4 before enrichment were 0.6 pM and below detection limit (i.e. ~ 0 . 0 5 PM) respectively. Phosphates, nitrates and glucose were added individually and in all possible combinations: CO: control = 80 pm screened water; N: nitrates 1 pM; P: phosphate 0.5 PM; G: C-glucose 6 PM; NP: nitrate
+
phosphate; NG: nitrate+
glucose; PG: phosphate+
glucose; NPG: nitrate + phosphate + glucose.Within 1 h of collection, 8 acid-cleaned and sterilized
2 1 polycarbonate bottles, 1 bottle per treatment, were
filled with seawater from 50 m. The water was gently filtered through 80 pm to eliminate metazoans. After adding the nutrients, the bottles were placed in a n on-
deck incubator with circulating surface seawater, and covered with a neutral screen providing 50% light attenuation. The concentrations of nutrients in the experimental bottles were measured at time 0 h with a technicon analyzer. Subsamples of 30 m1 for HN and PN counting were removed at To, TZ4, T4& Subsamples (200 ml) for ingestion experiments to estimate abun- dance of MN were removed at time To and T,,. Bacter- ial numbers and bacterial production were measured at TO, T,, TI,,
Tu,
T X and T48.RESULTS
Vertical distribution of MN, PN, HN, bacteria and bacterial production
March
In early spring (5 to 11 March 1997) in the south Aegean, vertical gradients were weak; data reported below are in the form of overall sample averages for March (n = 24). Bacteria were found in concentrations of about 0.7 X 10%ells ml-' and bacterial production averaged 0.74
+
0.17 pg C 1-' d-l. Among the flagel-lates, PN were numerically dominant, representing 65 % of total flagellates (Table 1, Fig. 2a).
FLB and FLM were ingested by protists at different rates. While 60 r 11 % of HN contained FLM after 1 h of incubation, they did not ingest FLB at all. Among PN, 12 % took up FLM. FLB ingestion by PN and inges-
Christdki et al.: Ndnofldgeilates in the oligotrophic eastern Mediterranean 301
tion of naturally occurring Synechococcus was checked in 18 samples (3 stations, all depths). Syne- chococcus were present in concentrations of about 0.2 X 10⁵ cells ml-'. From a total of 1567 PN cells observed, 6.2 + 1.7% took up FLB, while only 2.9
+
2.3% were found to contain 'Synechococcus-like' cyanobacteria. The low rates of FLB consun~ption are probably d u e to their large size and the small size of flagellates (mostly 2 to 3 pm). Therefore, in the results below, for both estimation of MN numbers and calcula- tion of bacterivory rates only the FLM ingestion is con- sidered.MN concentrations generally followed the same dis- tribution trend as total phototrophs (PN) indicating that mixotrophs appeared to be a relatively constant pro- portion (about 12 %) of PN and about 23 % of the typi- cal bacterivores, HN. The mean biomass in the 0 to 100 m l a y e r w a s 4 . 9 ? 2.8, 2.2
+
1.25 and 0.53 + 0 . 3 p g C 1-' for PN, HN, MN respectively. In terms of size dis- tributions, the nanoplanktonic community was com- posed largely of small cells < 5 pm. MN were almost exclusively represented by Prymnesiophyceae-like organisms 2 to 4 pm.September
In September, there were differences in the vertical distributions of different types of nanoflagellates. HN were more abundant than PN in the upper layer and declined to low concentrations below the thermocline (Fig. 2b,c). In terms of overall average concentrations, HN abundance was similar in the north and the south (Table l ) , while PN abundance was slightly higher in the north. In the north stations influenced by the Black Sea water (BSW), we found high bacterial production in the surface waters. The highest bacterial production was measured at 5 m depth at Stn N5 and was 2.9 1-19 C 1-' d-' (i.e. 120 ng C 1-' h-'). In the spring, mean bacter- ial production in the 0 to 100 m layer was 0.74
+
0.17 1-19 C 1-' d-' for the south. Late summer mean values (9 to 23 September 1997) were close to those of March: 0.58+
0.15 and 0.82 + 0.64 p g C 1-' d-l in the south and in the north respectively. Thus, the mean bacterial pro- duction was similar in the north and the south, how- ever the variability between the north stations was pronounced. Despite all these differences, the abun- dances of MN were very similar in the south and north Aegean, 0.03 to 0.18 X 10³ ml-l, and were similar to those recorded for March. The relative contribution of mixotrophs to total nanoflagellate abundance was 5 %, and relative to the total phototrophs, MN equaled 13 % in the south and 9 % in the north.Compared to March, average cell size of nanoflagel- lates was larger with a shift in size distribution towards
a) March 97 Stn S1 b) September 97 Stn S1 0 0 5 1 1.5 -1 103 cells ml-1 c) September Stn N I
Fig. 2. Typical vertical profiles of HN (heterotrophic nanofla- gellates), PN (phototrophic nanoflagellates = all chloroplast containing flagellates), MN (mixotrophic nanoflagellates = PN with ingested minicells), bacterial numbers and bacterial production in (a) March 1997, south Aegean, Stn S1, [b) Sep- tember 1997, south Aegean, Stn S1, [c) September 1997, north
Aegean, Stn N1
organisms 8 to 10 pm. The dominance of 8 to 10 pm organisms was more pronounced for the PN popula- tion. The MN, in contrast to the March community, were composed of a variety of sizes and morphotypes and in terms of biomass, 8 to 10 pm size cells domi- nated the MN community.
The mean biomasses in the 0 to 100 m layer were 6.4 -+ 4.0, 7.6
+
4.2 and 1.8 +. 1.5 pg C 1-' for PN, HN,SEPTEMBER-NORTH
L
SEPTEMBER-SOUTHb
MARCH-SOUTHh
.
1
BACTERIAFig. 3. Mean integrated biomass of heterotrophic bacteria and nanoflagellate groups. HN (heterotrophic nanoflagellates), PN (phototrophic nanoflagellates = all chloroplast containing flagellates), MN ( m o t r o p h i c nanoflagellates = PN with in-
gested minicells)
MN respectively in the south; and 4.4
+
2.9, 4.6 rt 2.8 and 0.5 t 0.5 yg C 1-l PN, HN, MN respectively in the north. In the south, the relative biomass of MN was 15 and 23 % of PN, and 31 and 27 % of HN in March and September, respectively. In the north the MN relative biomass was lower, 10 and 11 % of the PN and HN, respectively.The mean integrated biomass of HN, PN, MN in the 3 cases studied showed that generally the MN biomass was 10 to 20% of the total biomass of PN (Fig. 3). MN biomass was 10 to 30 % of the biomass of HN which are the typical bacterivores. The integrated bacterial bio- masses were similar in the 3 cases studied: 1611
*
287 mg C m-' in March 97 in the south, and 1559+ 208
and 1366*
65 mg C m-2 in September, in the south and the north respectively.Table 2. t-test for comparisons of microbial parameters in
north and south Aegean in September 1997 (df = 76). 'Statis-
tically non significant. Chl a from Ignatiades et al. (unpubl.)
Parameter t-test p
Heterotrophic nanoflagellate number (HN) 0.39 0.696' Phototrophic nanoflagellate number (PN) 4.31 0.0001 Mxotrophc nanoflagellate number (MN) 0.32 0.741'
Bacterial number 0.20 0.83'
Bacterial production 3.35 0.001
Chl a 3.17 0.0001
Heterotrophc nanoflagellate biomass (HN) 3.40 0.001 1 Phototrophic nanoflagellate biomass (PN) 2.42 0.012' Mixotrophc nanoflagellate biomass (MN) 4.49 0.0001
Comparison of north and south basins (September) We compared microbial parameters in the north and south Aegean using the September data. While no dif- ferences were found for HN, MN and bacterial abun- dance, the t-test analysis (Table 2) suggested there were significant differences in PN abundance, bac- terial production, and HN, PN and MN biomasses
between the north and the south Aegean.
We then tested the variability among northern sta-
tions for given depths and variability among southern stations for given depths (Table 3). The south appeared
relatively homogenous. Based on the September data,
there were no Mferences among southern stations for the microbial parameters tested (HN, PN, MN num-
bers and biomass, bacterial numbers and production) but for the northern stations there was significant vari- ability between stations for most of the parameters tested (Table 3). Finally, we examined the relation- ships between microbial parameters in the north and
the south Aegean using correlation analysis (Table 4 ) . In March, when data were gathered only for the south Aegean, the single significant relationship was be- tween HN and bacterial concentration. The north and south stations were analyzed separately using the Sep-
tember data. For both areas, some of the most highly correlated parameters were between HN and bacterial abundance and between concentrations of HN and PN. In the north, in contrast to the south, HN concen-
trations were significantly related to bacterial produc- tion (Table 4 ) .
Estimates of bacterivory relationships with bacterial production
Mimmal estunates of bacterivory and C flow were
calculated based on minicell ingestion. We call these
Table 3. ANOVA for comparisons of microbial parameters be- tween stations in the north Aegean in September 1997 (df =
41). 'Statistically non slgnlficant. No statistical chfferences were found in the south Aegean. CM a from Ignatiades et al.
(unpubl.)
1
Parameter F-value pHeterotrophic nanoflagellate number (HN) Phototrophic nanoflagellate number (PN) Mixotrophlc nanoflagellate number (MN) Bacterial number
Bacterial production Chl a
Heterotrophlc nanoflagellate biomass (HN) Phototrophic nanoflagellate biomass (PN) Mixotrophc nanoflagellate biomass (MN)
Christaki et al.: Nanoflagellates in the oligotrophic eastern Mediterranean
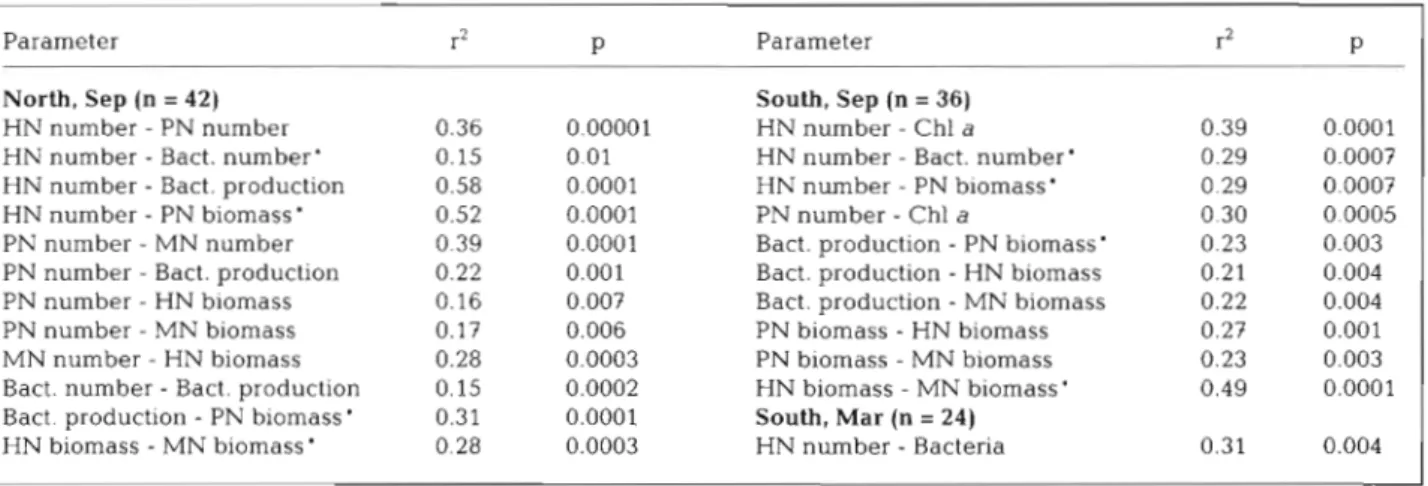
Table 4. Significant correlations between microbial parameters including chl a. r2 = Spearman's rho. 'Correlations common in the north and the south in September 1997. Chl a from Ignatiades et al. (unpubl.)
Parameter r2 P Parameter r2 P
North, Sep (n = 42) South, Sep (n = 36)
HN number - PN number 0.36 0,00001 HN number - Chl a 0.39 0.0001
HN number - Bact, number' 0.15 0.01 HN number - Bact. number' 0.29 0.0007
HN number - Bact. production 0.58 0.0001 HN number - PN biomass' 0.29 0.0007
HN number - PN biomass' 0.52 0.0001 PN number - Chl a 0.30 0.0005
PN number - MN number 0.39 0.0001 Bact. production
-
PN biornass' 0.23 0.003PN number - Bact. production 0.22 0.001 Bact. production
-
HN biomass 0.21 0.004PN number - HN biomass 0.16 0.003 Bact. production
-
MN biomass 0.22 0.004PN number - MN biomass 0.17 0.006 PN biomass - HN biomass 0.27 0.001
MN number - HN biomass 0.28 0.0003 PN biomass - MN biomass 0.23 0.003
Bact. number - Bact. production 0.15 0.0002 HN biomass - MN biomass ' 0.49 0.0001
Bact. production
-
PN biomass' 0.31 0.0001 South, Mar (n = 24)HN biomass - MN biomass ' 0.28 0.0003 HN number - Bacteria 0.31 0.004
estimates 'minimal' because rninicells may be discrirn- inated against by mixotrophs a s well a s heterotrophs. In our experiments, 60
+
11 % of H N were found to contain minicells. T h e range of ingested rninicells by H N w a s 1 to 4 FLM HN-l h-', while the minicells ingested by MN rarely exceeded 2 FLM MN-' h-'. We cannot know what % of M N discriminated against minicells because their recognition is based on the ingestion of these fluorescent prey (see 'Materials and methods'). The overall mean clearance rate (CR) based on rates of FLM consunlption by HN was higher than that of MN (2.6*
0.78 a n d 1.8 ~t 0.60 nl flagellate-' h-' respectively). Clearance rates of both HN a n d MN declined with increasing concentrations of bacteria, based on station averages (Fig. 4).To compare bacterial production with consumption rates, w e calculated bacterivory in carbon units. For each station, w e used the average clearance rate, bac- terial concentration, a n d a bacteria carbon content factor of 20 fg C per bacterium. Nanoflagellate bac- terivory accounted for about 4 0 % of bacterial produc- tion in March, while in September bacterial production for both basins (0.58 a n d 0.83 p g C I-' d-' in the south- e r n and northern basin respectively) roughly balanced estimated nanoflagellate consumption (Fig. 5). Bacter- ial grazing d u e to mixotrophic flagellates represented about 5 % of the total nanoflagellate bacterivory in both March a n d September experiments.
bations, however the decrease w a s pronounced in the phosphate amended bottles (Fig. 6). PN numbers var- ied little while H N showed a slight decrease in N, NP, PG a n d NPG amended bottles. No change in H N num- bers w a s observed in P or NG, while a slight increase was observed in t h e G-spiked bottle.
Bacterial numbers increased by 20 to 40% in all treat- ments relative to the 0 h control. In absolute numbers, the bacterial production in the control increased by a factor of 5 (from 19 to 109 n g C 1-' h-') during the 48 h incubation (confinement effect). 'Bottle or confinement effects' a r e commonly reported a n d a variety of ex- planations have been suggested (Ferguson e t al. 1984, Morita 1997 a n d references therein). The prevailing explanation is that nutrients a r e absorbed a n d concen- trated onto surfaces a n d thus become more utilizable by bacteria. However, another explanation is that t h e in- crease of bacterial population in the control during the first days of 'confinement' is d u e to a perturbation of their predators. In our experience, using oligotrophic water
Microbial responses to nutrient and carbon enrichment
After 4 8 h of incubation, the number of M N , PN a n d HN in the control bottles slightly increased (13, 7, 17 % respectively). Relative to t h e control, the number of 'phagotrophically active' algae decreased in all incu-
4 8
Bacteria (105 mt')
Fig. 4. Estimates of clearance rates plotted against bacterial concentration (averages per station: 6 depths) for hetero- trophic nanoflagellates (HN) and rnixotrophic nanoflagellates (MN) based on ingestion of FLM. Solid line for MN, broken
{
I
Bacterial ProdualonI
South-March South-September North-September
Fig. 5. Estimates of bacterivory and C flow based on minicell ingestion by hetero- trophlc and mixotrophic nanoflagellates. Bacterial production estimated using the leucine method. Consumption was esti- mated by calculating ingestion in terms of bacteria ingested flagellate-' h-' from clearance rate (based on FLM ingestion) times bacterial concentration and con- verted to carbon units using 20 fg C bacterium-' Depth-averaged rates were calculated for each station, error bars rep- resent the SD between station averages
samples, heterotrophs often show negative or zero and interpretation of bottle experiments. For this reason, growth immediately following confinement. In either whilst we give values of the control bottles at 0 and 48 h , way, the bottle effect has to be considered in the design we also make comparisons for the 48 h values.
The integrated bacterial production for the
1 .0 48 h of incubation (Fig. 7) showed little change
relative to the control in N and G bottles and the increase in NG-spiked bottle was of the order of
-
- 30 %. In contrast, bacterial production increasedE in P, PG and NPG by a factor of 3, 5, 7 respec-
m
0 tively (360 to 700 %, Fig. 7). While treatments
were unreplicated, the 4 bottles which received
g
0.5phosphorus, either alone with N or glucose or
g
both, showed high bacterial production and lowconcentrations of phagotrophically active PN, i.e. bIN (Figs. 6 & 7).
O CO [=Oh CO t=48h h' NG G NP P PG NPG DISCUSSION
'CO t = ~ h ~ o t=48h N NG G NP P PG NPG Fig. 6. Flagellate populations in the enrichment experiment in the south Aegean, March 1997, Stn S1. CO: control = 80 pm screened water; N: nitrates 1 pM; P: phosphate 0.5 pM; G: glucose 6 FM C-glu- cose; NP: nitrate + phosphate; NG: nitrate
+
glucose; PC;: phosphate +glucose: NPG: nitrate + phosphate + glucose. (a) Absolute numbers of flagellates, heterotrophic nanoflagellat~s, HN, rnixotrophic nanofla- geuates, hlN, and phototrophic nanoflagellates, PN. (b) Changes, in
percent, relative to the control bottle at 48 h
We found bacterial production in the Aegean Sea in the 0 to 100 m layer to average about 74 mg C m-2 d-l. Our values are close to previous measurements of bacterial produc- tion made in open sea stations of the Cretan Sea (60 to 70 mg C m-' d-l, Van Wambeke et al. in press) but are somewhat higher than estimates made for the Levantine basin, 8.2 to 43.4 mg C m-' d-' (0 to 200 m layer, Robarts et
al. 1996). These values of bacterial production, compared to estimates of primary production for the Aegean Sea of about 68 mg C m-' d-' (Ignatiades 1998), confirmed our expectations concerning the importance of heterotrophic bdcterial production in such a n oligotrophic system. However, despite low absolute con- centrations of bacteria, bacterivory appeared to be dominated by HN rather than MN.
A possible source of error in our estimates of bacterivory is discrimination against prey analogs, by M N or HN. Nanoflagellates are known to be capable of selective feeding, dis-
Christaki et al.: Nanoflagellates in the oligotrophic eastern Mediterrdnedn 305
tinguishing for example, between inert particles or live and heat-killed bacteria (Nygaard et al. 1988, Landry et al. 1991) with selectivity varying with the availabil- ity of prey (e.g. Jurgens & DeMott 1995, Dolan & Simek 1998). Hence, it would not 'be unreasonable to suppose that FLM ingestion rates could underestimate true bac- terivory. However, while HN bacterivory left a sub- stantial amount of bacterial production unconsumed in March, it closely matched estimates of bacterial pro- duction in September (Fig. 5).
Our analysis of microbial parameters suggested sig- nificant differences between the southern and north- ern stations (Table 2). We found little variance be- tween stations in the south but significant variability among northern stations (Table 3). Given these results and differences in the relationships between microbial parameters in the north and south (Table 4), the 2
appear to be distinct systems, probably reflecting the input of Black Sea water in the north. In the south, where there was little station to station variability, there were fewer significant relationships, Spearman's rho values were low, and bacterivory -considered as biomass of HN or MN - was weakly linked to bacter- ial production or concentration. In contrast, among samples gathered from northern stations, HN concen- trations were relatively strongly correlated with bacte- rial production (Spearman's rho = 0.58, Table 4).
Clearance rate estimates based on FLM ingestion fell within the typical figures reported of a few nl cell-' h-' (e.g. Eccleston-Parry & Leadbeater 1994, Gonzalez 1996). Interestingly, in both HN and MN populations, clearance rates appeared to decline with bacterial con- centration (Fig. 4). Such a pattern may reflect an adap- tation to low prey concentrations or, alternatively, a discrimination against FLM increasing with ambient bacterial prey concentration.
We found that mixotrophs were not the dominant consumers of heterotrophic bacteria and were a small part of the community of phototrophic nanoplankton. Our findings are similar to those concerning the nano- flagellate community of the oligotrophic Sargasso Sea. Arenovski et al. (1995) reported that only a few percent of the phototrophic nanoplankton ingested bacteria- sized particles in surface waters of the Sargasso Sea. In phosphorus-depleted surface waters of a Norwegian fjord, mixotroph feeding on picoplankton was unde- tectable, although consumption of larger food items by some small dinoflagellates was estimated (Havskum &
Hansen 1997).
The relative contribution of bacterivory to the growth of mixotrophs is still poorly understood. While mixotrophic algae are abundant in a variety of aquatic habitats, few generalities have emerged. Bacterivory by these organisms may vary as a function of environ- mental factors, such as nutrient availability, light,
CO t=Oh C o t 4 8 h N NG G NP P PG NPG IT 600 g 0 U _o 400 C .-
-
a e2
200 m L U .S 0 Cot=OhCo tz48h N NG G NP P PG NPG Fig. 7. Heterotrophic bacteria in the enrichment experiment in the south Aegean, March 1997, Stn S1. CO: control = 80 pm screened water; N: nitrates 1 pM; P: phosphate 0.5 pM; G: glucose 6 pM C-glucose; NP: nitrate+
phosphate; NG: nitrate +glucose; PG: phosphate+
glucose; NPG: nitrate +phosphate+
glucose. (a) Absolute numbers of bacteria and production rates at 0 h (control) and 48 h (control and spiked bottles); (*)bacterial production = 0.019 pg C 1-' h-'. (b) Changes relative to the control bottle; integrated bacterial production is ex-
pressed in pg C 1-' At, where A t = 4 8 h
salinity etc, and of course species-specific preferences explaining variability between observations and some- times conflicting results ( e . g , review by Riemann et al. 1995, Legrand et al. 1998 and references therein). For example, in the Bay of Aarhus (Denmark), in coastal waters of New Zealand during an upwelling event, in a Norwegian fjord during the end of a bloom and in Boston Harbor (USA), bacterivory was dominated by
M N (Epstein & Shiaris 1992, Hall et al. 1993, Nygaard
& Tobiesen 1993, Havskum & Riemann 1996). Mixo- trophs are common in freshwater eutrophic systems (e.g. Bennet et al. 1990, Sanders 1991), but in a com- parison of lakes of differing trophic status, Berninger et al. (1992) found bacterivory by mixotrophs to be most important in mesotrophic rather than oligotrophic or eutrophic lakes.
Mixotrophs of the Aegean Sea probably gain carbon from bacterivory, an amount equivalent to approxi-
on our estimates of clearance rates. This suggests, unless we have severely underestimated mixotroph clearance rates, that they probably do not profit signif- icantly from the carbon ingested but may practice phagotrophy to obtain nutrient salts. Evidence in sup- port of this view was found in the enrichment experi- ment. While individual treatments were unreplicated, all the bottles which received phosphorus showed marked decreases in abundance of phagotrophically active PN-rnixotrophs, as well as increases in bacterial production and concentrations (Figs. 6 & 7). The results from the enrichment experiment support the view of the Mediterranean as a phosphorus-limited marine system (Dolan et al. 1995, Thingstad et al. 1998) with the eastern Mediterranean as severely phosphorus- limited (Krom et al. 1993, Zohary & Robarts 1998). Declines in phagotrophic activity by mixotrophs when nutrients are plentiful have been reported by others (e.g. Arenovski et al. 1995, Rothhaupt 1996, Legrand et al. 1998). Interestingly, nutrient enrichment expen- ments with Sargasso Sea populations gave very similar results to ours, with marked declines in phagotrophi- cally active PN in treatments including phosphorus additions (Arenovski et al. 1995).
Thus, mixotrophic algae are indeed commonly found in the oligotrophic eastern Mediterranean. These pri- mary producers play a role as potential bacterivores and should be considered in the assessments of the flows of material between compartments of the plank- tonic food web. We found that phagotrophic activity of algae in the Aegean may be related to the concentra- tion of nutrients in the water (e.g. phosphorus).
To our knowledge, the data presented here are some of the first concerning evidence of selective feeding among natural populations of marine MN. We found some indications of size-selection: PN ingested FLM (0 0.65 pm) at higher rates than FLB (length 1.6 to 2.4 pm, ESD 0.8 to 1.0 pm) and more PN ingested FLB than were found containing naturally occurring Syne- chococcus sp. cells (0 1.0 pm). Interestingly, HN feed-
ing on heterotrophic bacteria generally show increases in clearance rates with increasing prey size (e.g. Gon- zalez 1996). However, very large bacteria are often not ingested (e.g. Sirnek & Chrzanowski 1992) and thus clearance rates decrease when prey volumes exceed 0.6 to 1.2 pm3 (Jiirgens & Gude 1994). Clearly, discrim- ination among prey ltems may have been on a basis other than size alone given that some nanoflagellates feed at higher rates on living versus heat-killed bac- teria (Monger & Landry 1992). However, MN in the eastern Mediterranean, given their small sizes, simply may not feed efficiently on large bacteria.
Clearly, much work remains concerning MN. Future investigations on mixotrophic flagellates should proba- bly be oriented towards examinations of feeding
behavior in relation to other environmental factors such as the availability of trace elements or light as well as their physiological state.
Acknowledgements. Financial support was provided by the Commission of the European Communities through the con- tracts MATER (MAST 3, PL 95-0401), KEYCOP (MAS 3 - CT 97- 0148). We thank Lydia Ignatiades and colleagues, and Katerina Souvermetzoglou and colleagues for providing unpublished chlorophyll and nutrient data. We are grateful to Harry Havskum and Celia Marrase for kindly providing the FLB and minicells. We also thank Vassilis Zervalus for help with Fig. 1 and useful discussions, and the captain and the crew of RV 'Aigaio' for their assistance and good mood. This is a n MTP I1 MATER contnbution no. 29.
LITERATURE CITED
Arenovski AL, Lim EL, Caron DA (1995) Mixotrophic nano- plankton in oligotrophic surface waters of the Sargasso Sea may employ phagotrophy to obtain major nutrients. J Plankton Res 17:801-820
Balopoulos E, Varnavas S, Monaco A, Price NB, Collins MB, Kotsovinos N. Matsoukis P, Dermissis V. Apostolopoulou M (1997) Hydrodynamics and biochemcal fluxes in the straits of the Cretan Arc Aegean Sea, eastern Mediter- ranean Basin. MTP-Pelagos. In: Lipiatou E (ed) Interdisci- p h a r y research in the Mediterranean Sea. A synthesis of scientific~results from the Mediterranean targeted project phase I , 1993-1996. European Communities DGXII, Brus- sels, p 93-119
Bennet SJ, Sanders RW, Porter KG (1990) Heterotrophlc, autotrophic and mixotrophic nanoflagellates: seasonal abundances and bacterivory in a eutrophic lake. Limnol Oceanogr 35: 1821-1832
Berninger UG, Caron DA, Sanders RW (1992) Mixotropluc algae in three ice-covered lakes of the Pocono Mountains USA. Freshw Biol28:263-272
Bsrsheim KY, Bratbak G (1987) Cell volume to cell carbon conversion factors for a bacterivorous Monas sp. enriched from sea water. Mar Ecol Prog Ser 36:171175
Dolan JR, Simek K (1998) Ingestion and digestion of an autotrophlc picoplankter Synechococcus, by a hetero- trophic nanoflagellate, Bodo saltans. Limnol Oceanogr 43: 1740-1746
Dolan JR, Thingstad TF, Rassoulzadegan F (1995) Phosphate transfer between microbial size-fractions in Vdlefranche Bay (N. W. Mediterranean Sea) France in autumn 1992. Ophelia 41:7 1-85
Eccleston-Parry JD, Leadbeater BSc (1994) A comparison of the growth kinetics of six marine heterotrophic nano- flagellates fed with one bacterial species. Mar Ecol Prog Ser 105:16?-177
Epstein SS, Shiaris M (1992) Size-selective grazing of coastal bacterioplankton by natural assemblages of pigmented flagellates, colorless flagellates, and ciliates. Microb Ecol 23:211-225
Fenchel T (1982) Ecology of heterotrophic microflagellates. II.
Bioenergetics and growth. Mar Ecol Prog Ser 8:225-231 Ferguson RL, Buckley EN, Palumbo AV (1984) Response of
marine bacterioplankton to differential filtration and con- finement. Appl Environ Microbiol 47:49-55
Fuhrman JA, Noble RT (1995) Viruses and protists cause similar bacterial mortality in coastal seawater. Limnol Oceanogr 40: 1236-1242
Christaki et al.. Nanoflagellates in the oligotrophic eastern Mediterranean 307
Gas01 JM, Del Giorgio PA, Duarte C (1997) Biomass distribu- tion in marine planktonic communities. Lirnnol Oceanogr 42:1353-1363
Gonzalez JM (1996) Efficient size-selective bacterivory by phagotrophic nanoflagellates in aquatic systems. Mar Biol 126:785-789
Hall JA, Barrett DP, James MR (1993) The importance of phytoflagellate, heterotrophic flagellate and ciliate graz- ing on bacteria and picophytoplankton sized prey in a coastal marine environment. J Plankton Res 15:1075-1086 Havskum H, Hansen AS (1997) Importance of pigmented and
colourless nano-sized protists as grazers on nanoplankton in a phosphate-depleted Norwegian fjord and in enclo- sures. Aquat Microb Ecol 12:139-151
Havskurn H, Riemann B (1996) Ecological importance of bacterivorous, pigmented flagellates (rnixotrophs) in the Bay of Aarhus, Denmark. Mar Ecol Prog Ser 137: 251-263
Ignatiades L (1998) The productive and optical status of the oligotrophic waters of the southern Aegean Sea (Cretan Sea), Eastern Mediterranean. J Plankton Res 20: 985-995 Jiirgens K, DeMott WR (1995) Behavioral flexibility in prey
selection by bactivorous nanoflagellates. Limnol Oceanogr 40:1503-1507
Jurgens K, Gude H (1994) The potential importance of graz- ing-resistant bacteria in planktomc systems. Mar Ecol Prog Ser 112:169-188
Kana T, Glibert PM (1987) Effect of irradances up to 2000 1.1Em-~s-l on marine Synechococcus WH 7803-1. Growth, pigmentation and cell composition. Deep-Sea Res 34: 479-516
l r c h m a n DL (1993) Leucine incorporation as a measure of biomass production by heterotrophic bacteria. In: Kemp PF, Sherr BF, Sherr EB, Cole J J (eds) Handbook of meth- ods in aquatic microbial ecology. Lewis Pubhshers, Ann Arbor, p 509-512
Kirchman DL, Newell SY, Hodson RE (1986) Incorporation versus biosynthesis of leucine: implications for measuring rates of protein synthesis and biomass production by bac- teria in marine systems. Mar Ecol Prog Ser 32:4?-59 Krom DM, Kress N, Brenner S (1993) Nutrient distributions
during an annual cycle across a warm-core eddy from the E. Mediterranean Sea. Deep-Sea Res 40:805-825
Landry h4R. Lehner-Fourrier JM, Sundstrom JA, Fagerness VL, Selph KE (1991) Discrimination between living and heat-killed prey by a marine zooflagellate Paraphyso- monas vestita Stokes. J Exp Mar Biol Ecol 146:139-15 Lee S, Fuhrman JA (1987) Relationships between biovolume
and biomass of naturally derived marine bacterioplank- ton. Appl Environ Microbiol 53:1298-1303
. Legrand C, Grankli E, Carlsson P (1998) Induced phagotrophy
1
in the photosynthetic dinoflagellate Heterocapsa tn'que-tra. Aquat Microb Ecol 15:65-75
Monger BC, Landry MR (1992) Size-selective grazing by heterotrophic nanoflagellates: a n analysis using live- stained bacteria and dual-beam flow cytometry. Arch Hydrobiol Beih Ergeb Limnol37:173-185
Morita RY (1997) Bacteria in oligotrophic environments. Chapman & Hall, New York
Editorial responsibility: Otto Kinne (Editor), Oldendorf/Luhe, Germany
Nygaard K, Tobiesen A (1993) Bacterivory in algae: a survival strategy during nutrient limitation. Lirnnol Oceanogr 38: 273-279
Nygaard K, B~rsheim KY, Thingstad TF (1988) Grazing rates on bacteria by marine heterotrophic microflagellates com- pared to uptake rates of bacterial-sized monodisperse flu- orescent latex beads. Mar Ecol Prog Ser 44:159-16529 Pace ML, McManus GB, Findlay SEG (1990) Planktonic com-
munity structure determines the fate of bacterial produc- tion in a temperate lake. Limnol Oceanogr 35795-808 Pollard PC, Moriarty D (1984) Validity of the tritiated thymi-
dine method for estimating bacterial growth rates: mea- surement of isotope dilution during DNA synthesis. Appl Environ Microbiol48:1076-1083
Porter KG, Feig YS (1980) The use of DAPI for identifying and counting aquatic microflora. Limnol Oceanogr 25: 943-948
Riemann B, Havskum H, Thingstad F, Bernard C (1995) The role of rnixotrophy in pelagic environments. In: Joint I (ed) NATO AS1 Series, Molecular ecology of aquatic microbes, Vol38. Springer-Verlag, Berlin. p 87-114
Robarts RD, Zohary T, Waiser MJ, Yacobi YZ (1996) Bacterial abundance, biomass, and production in relation to phyto- plankton biomass in the Levantine Basin of the southeast- ern Mediterranean Sea. Mar Ecol Prog Ser 137:273-281 Rothhaupt KO (1996) Utilization of substitutable carbon and
phosphorus sources by the mixotrophic chrysophyte Ochromonas sp. Ecology 77:706-715
Sanders RW (1991) Mixotrophic protists in marine and fresh- water ecosystems. J Protozool38:76-81
Sherr BF, Sherr EB, Fallon RD (1987) Use of monodispersed fluorescently labelled bacteria to estimate in situ proto- zoan bacterivory. Appl Environ Microbiol53:958-965 Simek K, Chrzanowski T (1992) Direct and indirect evi-
dence of size-selective grazing on pelagc bacteria by freshwater nanoflagellates. Appl Environ Microbiol 58: 3715-3720
Steward GF, Smith DC, Azam F (1996) Abundance and pro- duction of bacteria and viruses in the Benng and Chukchi Seas. Mar Ecol Prog Ser 131:287-300
Theil-Nielsen J , Sondergaard M (1998) Bacterial carbon bio- mass calculated from biovolumes. Arch Hydrobiol 141: 195-207
Thingstad TF, Havskum H, Garde K, Riemann B (1996) On the strategy of 'eating your competitor'. A mathematical analysis of rnixotrophy. Ecology 77:39-49
Thingstad TF, Zweifel UL, Rassoulzadegan F (1998) P limita- tion of heterotrophic bacteria and phytoplankton in the Northwest Mediterranean. Lirnnol Oceanogr 43: 88-94 Van Wambeke F,Christaki U, Bianchi M. Tselepides T, Psarra
S (in press) Heterotrophic bacterial production in the Cretan Sea. Prog Oceanogr
Zohary T, Robarts RD (1998) Experimental study of rnicro- bial P limitation in the eastern Mediterranean. Limnol Oceanogr 43:387-395
Zubkov MV, Sleigh MA (1995) Bacterivory by starved marine heterotrophic nanoflagellates of two species which feed differently, estimated by uptake of dual radioactive- labelled bacteria. FEMS Microbiol Ecol 17: 57-65 Submitted: July 27, 1998; Accepted: November 26, 1998 Proofs received from au thor(s): April 22, 1999