HAL Id: insu-01112032
https://hal-insu.archives-ouvertes.fr/insu-01112032
Submitted on 4 Mar 2021
HAL is a multi-disciplinary open access
archive for the deposit and dissemination of
sci-entific research documents, whether they are
pub-lished or not. The documents may come from
teaching and research institutions in France or
abroad, or from public or private research centers.
L’archive ouverte pluridisciplinaire HAL, est
destinée au dépôt et à la diffusion de documents
scientifiques de niveau recherche, publiés ou non,
émanant des établissements d’enseignement et de
recherche français ou étrangers, des laboratoires
publics ou privés.
contaminants in the unsaturated zone. Case study:
Guadalete River basin (Cadiz, Spain)
C. Corada-Fernandez, Joachin Jimenez-Martinez, Lucila Candela, Eduardo
Gonzalez Mazo, Pablo Lara-Martin
To cite this version:
C. Corada-Fernandez, Joachin Jimenez-Martinez, Lucila Candela, Eduardo Gonzalez Mazo, Pablo
Lara-Martin. Occurrence and spatial distribution of emerging contaminants in the unsaturated zone.
Case study: Guadalete River basin (Cadiz, Spain). Chemosphere, Elsevier, 2015, 119, pp.S131-S137.
�10.1016/j.chemosphere.2014.04.098�. �insu-01112032�
1
3
Occurrence and spatial distribution of emerging contaminants
4
in the unsaturated zone. Case study: Guadalete River basin (Cadiz, Spain)
5 6
7
Carmen
Corada-Fernández
a,
Joaquín
Jiménez-Martínez
b,
Lucila
Candela
c,
Eduardo
González-Mazo
a,
8Pablo A.
Lara-Martín
a,⇑9 a
Department of Physical-Chemistry, Faculty of Marine and Environmental Sciences, University of Cadiz, Campus of International Excellence of the Sea (CEI.MAR), Río San Pedro, 10 Puerto Real, Cadiz 11510, Spain
11 b
Geosciences Rennes UMR 6118 CNRS, University of Rennes 1, Rennes 35042, France
12 c
Department of Geotechnical Engineering and Geosciences, Technical University of Catalonia-UPC, Barcelona 08034, Spain
13 1 5
a r t i c l e
i n f o
16 Article history: 17 Received 3 January 2014
18 Received in revised form 21 April 2014 19 Accepted 29 April 2014
20 Available online xxxx 21
22 Handling Editor: J. de Boer 23 Keywords: 24 Emerging pollutants 25 Surfactants 26 Pharmaceuticals 27 Vadose zone 28 Soils 29 3 0
a b s t r a c t
31Irrigation with reclaimed water is becoming a common practice in arid- and semi-arid regions as a
32
consequence of structural water resource scarcity. This practice can lead to contamination of the vadose
33
zone if sewage-derived contaminants are not removed properly. In the current work, we have
character-34
ized soils from the Guadalete River basin (SW Spain), which are often irrigated with reclaimed water from
35
a nearby wastewater treatment plant and amended using sludge. Physico-chemical, mineralogical and
36
hydraulic properties were measured in soil samples from this area (from surface up to 2 m depth).
37
Emerging contaminants (synthetic surfactants and pharmaceutically active compounds, or PhACs) were
38
also determined. Synthetic surfactants, widely used in personal care products (PCPs), were found in a
39
wide range of concentrations: 73–1300lg kg 1 for linear alkylbenzene sulfonates (LAS), 120– 40
496lg kg 1for alkyl ethoxysulfates (AES), 19–1090
lg kg 1for alcohol polyethoxylates (AEOs), and 41
155–280lg kg 1for nonylphenol polyethoxylates (NPEOs). The presence of surfactant homologues with 42
longer alkyl chains was predominant due to their sorption capacity. A positive correlation was found
43
between LAS and AEOs and soil organic carbon and clay content, respectively. Out of 64 PhACs analyzed,
44
only 7 were detected occasionally (diclofenac, metoprolol, fenofibrate, carbamazepine, clarithromycin,
45
famotidine and hydrochlorothiazide), always at very low concentrations (from 0.1 to 1.3lg kg 1).
46
Ó 2014 Elsevier Ltd. All rights reserved.
47 48 49
50 1. Introduction
51 Groundwater contamination is often the result of human
activ-52 ities. This is a rising issue as the worldwide population density is
53 increasing and the use of land is becoming more intensive. One
54 of the clearest examples is contamination by pesticides, which
55 are directly applied to crops. These compounds are now frequently
56 measured for monitoring the quality of soils and aquifers
57 (Hildebrandt et al., 2008). There are, however, hundreds of other
58 chemicals that are not considered in routine sampling campaigns
59 and have potential to jeopardize groundwater resources. Among
60 these contaminants, there has been a growing interest over the last
61 decade in pharmaceuticals and personal care products (PPCPs), a
62 wide group that includes therapeutic drugs, antimicrobials,
fra-63 grances, sun-screen agents, insect repellents, surfactants and some
64 polymers. PPCPs have been dumped into the environment for as
65 long as humans have been using them, although they have become
66 relevant recently, once the improvement of analytical techniques
67 (e.g., mass spectrometry) has enabled their detection and
quantifi-68 cation at trace levels. So far, these substances have been detected
69
in most surface water bodies worldwide (Halling-Sörensen et al.,
70 1998; Heberer, 2002) and, occasionally, in groundwater (Teijón
71 et al., 2010). Available data on the concentrations and distribution
72 of PPCPs in solid matrices, especially sediment and soils, are still
73
scarce (Xu et al., 2009; Perez-Carrera et al., 2010).
74 Most of the information is related to the fate and behavior of
75
PPCPs in wastewater treatment plants (WWTPs) (Miége et al.,
76
2009) as their effluents are one of the most significant sources of
77 these chemicals to the aquatic environments. These studies show
78 that conventional treatments are not capable of efficiently
remov-79 ing many of these chemicals, especially pharmaceutically active
80 compounds (PhACs). As a consequence, soils can be later
contam-81 inated in several ways: (1) using digested sewage sludge or
bioso-82 lids as fertilizer on agricultural soils, (2) irrigation from treated
83 wastewater, (3) leakages of sewer drains and sewage treatment http://dx.doi.org/10.1016/j.chemosphere.2014.04.098
0045-6535/Ó 2014 Elsevier Ltd. All rights reserved.
⇑ Corresponding author. Tel.: +34 956 016159; fax: +34 956 016040. E-mail address:[email protected](P.A. Lara-Martín).
Q1
Contents lists available atScienceDirect
Chemosphere
j o u r n a l h o m e p a g e : w w w . e l s e v i e r . c o m / l o c a t e / c h e m o s p h e r e
84 plants and (4) surface flooding with waters containing appreciable
85 proportions of treated wastewater (Oppel et al., 2004). Other
86 sources include industrial production of pharmaceuticals, residues
87 from hospitals (Thiele-Bruhn, 2003), and the use of antibiotics in
88 animal farms. Later, these contaminated soils are a potential source
89 of surface and groundwater pollution by runoff (Oppel et al., 2004)
90 and leaching (Candela et al., 2007; Xu et al., 2009). Other PPCPs
91 considered in this work, such as surfactants and their degradation
92 products (main ingredients in detergents, cleaning products,
sham-93 poos, or lotions), unlike many PhACs, show high removal
efficien-94 cies in WWTPs (95–99%) (Matthijs et al., 1999). Their presence in
95 aquatic and terrestrial ecosystems, where they have been detected
96 in a wide range of concentrations (Corada-Fernández et al., 2010,
97 2013), is mostly related to their extended use and high
consump-98 tion. In fact, surfactants and their metabolites constitute, by far,
99 the organic contaminants showing the highest concentrations in
100 untreated wastewaters (Kolpin et al., 2002). Other sources include
101 the use of these compounds in pesticide formulations as
emulsifi-102 ers, dispersing and spreading agents (Carlsen et al., 2002).
103 The behavior and fate of most PPCPs still remains unclear,
espe-104 cially in soils and aquifers. There are only a few studies focusing on
105 the transport of these compounds from soils to surface waters and
106 groundwater (Oppel et al., 2004; Topp et al., 2008). Due to their
107 wide structural diversity, understanding the different sorption
108 mechanisms of PPCPs in soils is determinant for predicting their
109 mobility and leaching to the groundwater. Their persistence is also
110 another key aspect as the main route for disappearance of PPCPs
111 from contaminated soils is biodegradation. Degradation in soils
112 can be a relatively fast process for some surfactants such as linear
113 alkylbenzene sulfonates (LAS) (half-life = 3–33 d), the most
com-114 mon anionic surfactant (Linear Alkylbenzene Sulfonate,
115 Environmental Risk Assessment, 2013), and pharmaceuticals, but
116 extend over long periods of time for many other PPCPs. As an
117 example, amoxicillin, sulfamethazine and trimethoprim, three
118 antibiotics, show half-lives in soils of 1, 18.6 and 103 d,
respec-119 tively (Boxall, 2008). Both sorption and degradation processes are
120 also strongly influenced by environmental conditions such as
121 temperature, redox potential, pH, soil type, organic carbon content,
122
clay minerals and soil bacteria (Topp et al., 2008).
123 The current work has been carried out in the Guadalete River
124 basin (Cadiz, Spain), a region where reclaimed water from WWTPs
125 is occasionally used for irrigation due to water scarcity. Other
126 issues include severe pollution episodes in some areas of the basin
127 due to uncontrolled sewage spills and the use of digested sludge as
128
a fertilizer (Lara-Martín et al., 2008; Corada-Fernández et al., 2010,
129 2013; Perez-Carrera et al., 2010). Our main objectives were:(a) to
130 assess the occurrence of some selected PPCPs (surfactants and
131 pharmaceuticals) in the unsaturated zone, including both surface
132
and deep soils and(b) to relate their spatial distribution to
differ-133 ent sources and the physicochemical properties of the receiving
134 media.
135 2. Materials and methods
136 2.1. Study area
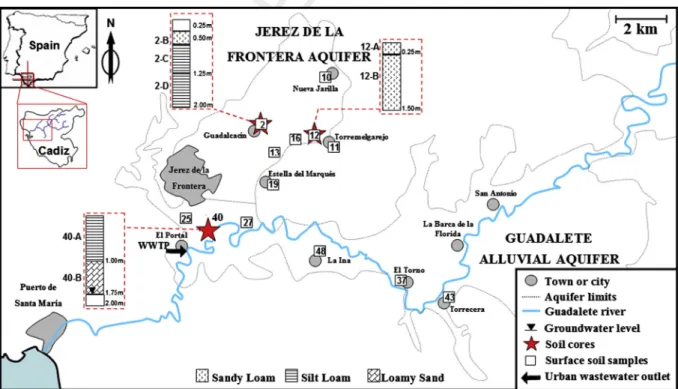
137 The study area is within the Guadalete River basin (SW, Spain)
138 where two unconfined aquifers are located: Jerez de la Frontera
139
and Guadalete alluvial aquifer (Fig. 1). Land use is dominated by
140 agricultural and farmland activities. There is also a significant
pres-141 ence of small villages along the riverside, sources of small
uncon-142
trolled sewage spills to the surface waters (Lara-Martín et al.,
143 2008; Corada-Fernández et al., 2011). The main population in the
144 area is a 200,000 inhabitant city, Jerez de la Frontera, located in
145 the northwest part of the basin. Most of the sewage of this city is
146
collected and treated in the WWTP El Portal (Fig. 1) and discharged
147 into the river, although there also some other small settlements
148 dumping untreated wastewater to the main watercourse through
149
a small creek (Salado Stream) (Corada-Fernández et al., 2013).
150 The region has a mean annual precipitation of 600 mm and a
151 mean annual temperature of 18 °C. Cotton and beetroot are the
152 main crops that irrigated in the area, and only the first type
153
(31 km2) is irrigated in summer (4–8 mm m2d 1) using water
154 from the river and/or the aquifer. Additionally, a fraction of the
Fig. 1. Map of the Guadalete River basin showing the location of sampling stations and nearby populations. Textural class for the three soil cores is also displayed.
Q2
2 C. Corada-Fernández et al. / Chemosphere xxx (2014) xxx–xxx
155 WWTP effluent (60,000–70,000 m3year 1) undergoes tertiary
156 treatment (UV disinfection after filtration) and is used for irrigation
157 of the local golf course and/or discharged into the Torrox pond,
158 both locations adjacent to sampling stations 25 and 40. Sludge is
159 composted (4000 tons year 1) and used by local farmers as
fertil-160 izer, covering a surface up to 10 km2.
161 2.2. Unsaturated zone sampling and characterization
162 The sampling was divided in two campaigns, the first in
Sep-163 tember 2006 to collect surface soil samples (disturbed, 500 g),
164 and the second in September 2008 to collect soil cores (including
165 disturbed and undisturbed). Note that both years were dry (567
166 and 476 mm in 2006 and 2008, respectively), especially during
167 the 3 months before the sampling campaigns (40 mm in 2006
168 and 9 mm in 2008).
169 Surface soil samples (disturbed, 500 g) were taken from both
170 Jerez de la Frontera and Guadalete aquifers at seven and five
differ-171 ent locations, respectively (Fig. 1), in September 2006. Later, and
172 taking into account the results obtained from surface soil samples,
173 and other criteria like land use/cover, disturbed and undisturbed
174 core samples (at intervals of 0.25 m up to 2 m depth) were
col-175 lected from sampling points 40, 12 and 2, within the Jerez de la
176 Frontera aquifer (Fig. 1), in September 2008. A hand auger drilling
177 equipment (EijkelkampÒ) and stainless steel rings (5 cm length;
178 5 cm inner diameter), inserted into the soil using a hand-held
ham-179 mer, were used to this end. All samples were transported and
180 stored after to be carefully wrapped in aluminum foil to avoid
pho-181 todegradation of some photosensitive PhACs, wrapped
hermeti-182 cally in plastic bag to avoid loss of water content, and kept at
183 4 °C during their transport to the laboratory using a cooler. All
184 samples were subsequently frozen in the laboratory until their
185 analysis.
186 Different techniques and standards were used to determine soil
187 physico-chemical properties (grain size distribution, bulk density,
188 saturated hydraulic conductivity, organic carbon content, electric
189 conductivity, pH, cation exchange capacity and clay fraction
miner-190 alogy). More information is available in Supplementary
191 Information.
192 2.3. Determination of PPCPs in soil samples
193 Analysis of surfactants in soil samples was carried out according
194 toLara-Martín et al. (2006), whereas determination of
pharmaceu-195 ticals was performed following the method developed byJelic et al.
196 (2009). These references include the list of all the chemicals and
197 reagents used during this study, as well as further details about
198 the performance of the different methods. Briefly, 4 different
syn-199 thetic surfactants– linear alkylbenzene sulfonates (LAS), alcohol
200 ethoxysulfates (AES), nonylphenol ethoxylates (NPEOs), and
alco-201 hol ethoxylates (AEOs) – and 64 pharmaceuticals – analgesics
202 and anti-inflammatories, antihypertensives, lipid regulators,
203
antibiotics, psychiatric drugs, and others–were analyzed by liquid
204
chromatography – mass spectrometry (LC-MS) after pressurized
205
liquid extraction (PLE). More information is available in
206 Supplementary Information.
207 3. Results and discussion
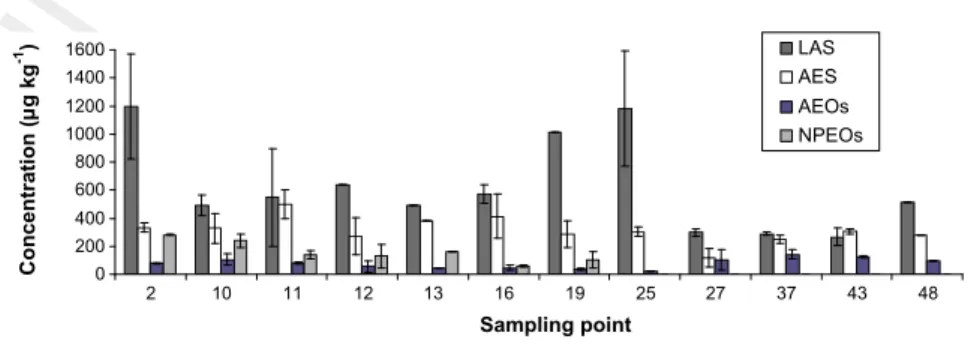
208 3.1. Distribution of synthetic surfactants in surface soil samples
209 Fig. 2shows concentrations of anionic (LAS and AES) and
non-210 ionic surfactants (AEOs and NPEOs) in surface soil samples. Values
211
of target compounds ranged from less than 20
l
g kg 1 to212
1200
l
g kg 1. Maximum concentrations were measured for LAS213
(from 290 to 1183
l
g kg 1) and AES (from 120 to 496l
g kg 1),214 two anionic surfactants mainly used in household detergents and
215 personal care products (e.g., shampoos). AEOs and NPEOs,
non-216 ionic surfactants mostly used for industrial applications and some
217 specific uses (e.g., wetting agents, dispersers and emulsifiers), were
218
detected at lower concentrations, between 19 and 140
l
g kg 1,219
and between 57 and 280
l
g kg 1, respectively. NPEOs were banned220 for household applications a few years ago in the EU due to the
221
estrogenic properties of their degradation metabolites (Jobling
222 et al., 1996). They were only detected in soil samples from the
223 Guadalete alluvial aquifer, where agriculture and farming are
pre-224 dominant. The main source of NPEOs in this area is probably the
225 application of pesticides to crops as this surfactant is as adjuvant
226
in pesticide formulation (Krogh et al., 2003). Regarding LAS, the
227 most abundant contaminant in soils, maximum concentrations
228
(around 1 mg kg 1) were found at sampling points 25, 19, and 2,
229 within the Jerez de la Frontera aquifer and surrounding urban
230 areas. Here, treated and untreated wastewater is discharged
231
(WWTP El Portal,Fig. 1) and represents the main source of this
sur-232 factant. The occurrence of these discharges has been confirmed in
233 previous works reporting highly polluted sediments and surface
234
waters within the same study area (Corada-Fernández et al.,
235 2011, 2013; Lara-Martín et al., 2008, 2010). Briefly, they measured
236
average values for surfactants between 0.1 and 3.7 mg kg 1in
sur-237 face sediments from Guadalete River, and between 0.2 and
238
37 mg L 1in surface water. In this study, maximum concentrations
239 for anionic surfactants were observed in two hot spots
correspond-240
ing to the outlet of WWTP El Portal (89.4 mg kg 1) and a small
241 creek (Salado Stream) that collects untreated wastewater from
242
small villages in rural areas (242.6 mg kg 1) (Corada-Fernández
243 et al., 2011). On the other hand, the highest values for nonionic
sur-244
factants were measured by the mouth of the river (14.9 mg kg 1)
245 and were related to industrial and seaport activity in that area
246 (Lara-Martín et al., 2008).
247 The distribution of organic contaminants in terrestrial
environ-248 ments is affected by their physico-chemical properties, and this is
249 especially relevant for surfactants, which are often sold in
com-250 mercial formulations as a complex mixture of homologues and
eth-251 oxymers (occasionally, formed by more than 100 individual
0 200 400 600 800 1000 1200 1400 1600 2 10 11 12 13 16 19 25 27 37 43 48 Sampling point Concentration ( µ g kg -1) LAS AES AEOs NPEOs
Fig. 2. Surfactant concentrations (lg kg 1
) in surface soil samples.
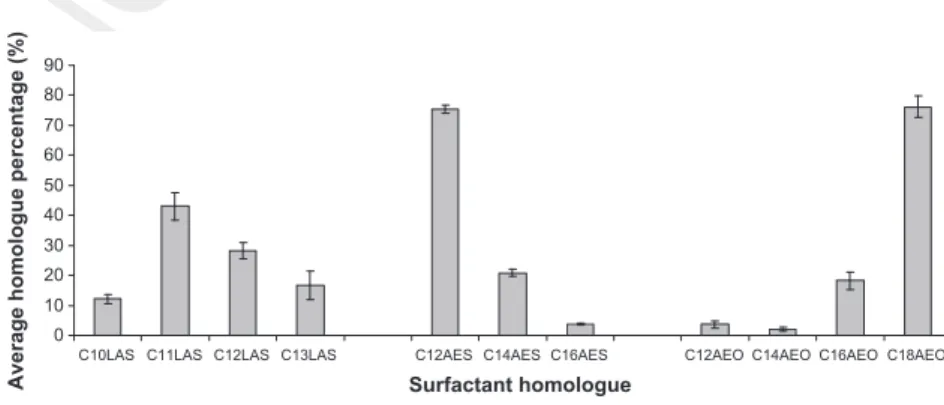
252 components) with different solubility and sorption capacity.Fig. 3
253 shows the average homologue percentages of LAS, AES, and AEOs
254 in surface soil samples. It is noticeable that, for AES and AEOs, only
255 homologues with an even number of carbon atoms (C12, C14 and
256 C16for AES, and C12, C14, C16and C18for AEOs) in their alkyl chain
257 were detected. This fact can be explained because most of them are
258 derived from vegetable and/or animal fatty acids instead from
pet-259 rochemical feedstocks (which contain not only even but also
odd-260 carbon numbered homologues). Differential sorption can be
261 observed by examining the homologue distributions represented
262 inFig. 3. In general, those homologues having longer alkyl chains
263 have higher sorption capacity on soils. This is especially evident
264 for AEO components, which are usually more hydrophobic than
265 the rest of surfactants. Regarding AES, highlights C12 AES, also
266 known as lauryl ether sulfate, which is one of the main ingredients
267 in shampoos, soaps, toothpastes, etc., as it is one of the cheapest
268 and more effective foaming agents. It is the main homologue also
269 in AES commercial mixtures (see data inSupplementary
Informa-270 tionrespect to the composition of the standard used), the main
271 reason why this homologue is always the most abundant in the
272 environment, in agreement with results reported byLara-Martín
273 et al. (2005) for these compounds in aquatic systems. Similar
274 trends regarding the homologue distribution of LAS, AEOs, and
275 AES have been previously reported for river and marine sediments
276 (Corada-Fernández et al., 2011; Lara-Martín et al., 2005, 2008)
277 from this and/or nearby sampling areas. Toxicity of these
com-278 pounds has been addressed inSupplementary Information.
279 Apart from the physico-chemical properties of their molecules,
280 the distribution and behavior of surfactants may be also correlated
281 to the properties of the environment, which may differ greatly
282 from one sampling area to another. That makes that sorption
283 mechanisms for anionic and non-ionic surfactants on soils and
284 other solid phases (e.g., sludge and sediments) are still not fully
285 understood (Rodríguez-Cruz et al., 2005). Some authors have
286 reported the existence of a positive relationship between sorption
287 coefficients and the organic carbon content in soils (Litz et al.,
288 1987; Fytianos et al., 1998), whereas other have found a similar
289 relationship but considering the clay content and/or specific
sur-290 face instead (Ou et al., 1996; Brownawell et al., 1997; Shen,
291 2000). Sorption can occur in multiple ways in the environment
292 as both hydrophobic and hydrophilic moieties in the molecular
293 structure of surfactants can interact with soil surfaces.Table 1S
294 (seeSupplementary Information) shows the main
physico-chemi-295 cal and hydraulic properties of surface soil samples in the
Guada-296 lete River basin. These soils are characterized by low organic
297 matter content (<2.5%) and low percent of clay (<3.8%). These
val-298 ues, however, are high enough to influence the sorption and,
there-299 fore, the distribution of surfactants in the area. LAS concentrations
300 were positively correlated (r2= 0.6, p = 0.002213) with organic
301 matter content in soils (Fig. 4a), suggesting hydrophobic
interac-302 tions between the alkyl chain of LAS homologues and the organic
303
carbon content in soils (e.g., Litz et al., 1987; Fytianos et al.,
304
1998). No influence of the soil clay content was observed for this
305
surfactant (Fig. 4b) at a p-value of 0.05. On the other hand, AEO
306 concentrations in soil did not seem to be affected by the organic
307
carbon content in soil (Fig. 4c) at a p-value of 0.05, but were weakly
308
positively correlated (r2= 0.5, p = 0.02148) with the presence of
309
clays in soil (Fig. 4d). This was especially true for those AEO
eth-310 oxymers with higher molecular weight, as polar interactions such
311
as hydrogen bonding may occur (Brownawell et al., 1997; Shen,
312 2000; Krogh et al., 2003).
313 3.2. Vertical profiles of PPCPs in soils
314 Three different sampling points (2, 12 and 40) were selected to
315 study the vertical distributions of contaminants in the vadose zone.
316 We considered not only LAS but also the total concentration of
sur-317 factants (LAS + AES + NPEO + AEO) in surface soil samples taken in
318 2006, as well as other criteria like land use/cover, for collection soil
319 core samples later in 2008. We decided to choose the 3 most
pol-320 luted stations, which were 25, 19 and 2, having a total
concentra-321
tion of surfactants of 1506, 1436 and 1888
l
g kg 1, respectively.322 However, stations 25 and 19 were altered due to construction
323 works after two years, so we decided to sampling station 40 and
324 12 instead. Station 40 is less than 1 km away from station 25
325 (Fig. 1), whereas station 12 is the next one having higher levels
326
of LAS (and a total surfactant concentration of 1096 ng g 1) after
327
stations 25, 19 and 2.Fig. 5shows concentrations of synthetic
sur-328 factants, the most commonly detected target compounds, in these
329 soil sediment cores. Surfactant levels ranged from 73 to
330
1300
l
g kg 1 for LAS, and from 329 to 1090l
g kg 1 for AEOs.331 Nonylphenol polyethoxylates (NPEOs) were also detected in some
332 samples, although at much lower concentrations than the rest
333
(<200
l
g kg 1) probably due to their lower use. According to the334 USDA textural classification system, the three soil cores were
335 characterized by loamy sand, sandy loam and silt loam textures,
336 with low levels of organic matter (<2%) and a low clay fraction
337
(<4%) (Table 2S, seeSupplementary Information). The vertical
dis-338 tribution of surfactants seems to be related to changes in the
phys-339 icochemical and hydraulic properties of soils. Thus, the maximum
340 values for AEOs were measured in those soil sections with higher
341 clay content, as we could observe in surface soil samples. LAS
con-342 centrations decreased with depth, which was also the trend
343 observed for organic carbon content in soil. This decrease in the
344 organic carbon content, combined with an increase in pH, may
345 reduce the sorption capacity of this surfactant on soils. Overall,
346 there was a decrease in the concentration of surfactants towards
347 deeper layers in the soil column, although an exception was
348 observed at sampling point 40, between 1.25 and 1.75 m depth
349 (Fig. 5a), where an increase in the concentrations of LAS and AEOs
350 was detected. This may be related to the presence of the capillary
351 fringe (fully saturated conditions were found at 1.75 m depth). We
0 10 20 30 40 50 60 70 80 90
C10LAS C11LAS C12LAS C13LAS C12AES C14AES C16AES C12AEO C14AEO C16AEO C18AEO
Surfactant homologue
Average homologue percentage (%)
Fig. 3. Average homologue distribution (%) of surfactants in surface soil samples.
4 C. Corada-Fernández et al. / Chemosphere xxx (2014) xxx–xxx
352 have detected the presence of surfactants and pesticides (data
353 unpublished) at significant concentrations (>1 ppb) in
groundwa-354 ter samples from this sample station. The increase in the
concen-355 trations of LAS and AEOs in the capillary fringe is due to their
356 presence in the aqueous phase and later-lower adsorption under
357 saturated conditions. The occurrence of local maximums at
differ-358 ent depths (e.g., between 0.75 and 1 m for AEOs in soil core 12, or
359 between 1 and 1.5 m for LAS in soil core 2) was also observed and
360 can be attributed to sporadic inputs of untreated or poorly treated
361 wastewater, as well as to the application of pesticides. Note that
362 untreated sewage dumped into the river sporadically from the
363 WWTP outlet during heavy rains every year, as well as through
364 small creeks collecting wastewater from local farms and cottages
365 (Lara-Martín et al., 2010; Corada-Fernández et al., 2011), and
pol-366 luted surface waters (concentrations up to 2.8 mg L 1of LAS have
367 been measured), are later used for irrigation. However, which
368 was observed in the soil profiles is the typical mass transport
369 movement in soil media when a pulse of chemical compound
(con-370 taminant or a tracer) is applied on the ground surface (Candela
371 et al., 2007), with the possible accumulation in soil deep horizons
372 by the reasons exposed above.
373 Table 1shows concentrations of PhACs at specific layers (Table
374
2S) in the soil, as well as some physicochemical properties (log Kow
375 and pKa) of these compounds. The selected pharmaceuticals belong
376
to different therapeutical classes–analgesics and
anti-inflamma-377 tories, antihypertensives, lipid regulators, psychiatric drugs, and
378
antibiotics–and are among the most used. Only 7 out of 64 target
379 compounds (diclofenac, metoprolol, fenofibrate, carbamazepine,
380 clarithromycin, famotidine and hydrochlorothiazide) were
occa-381 sionally detected at very low concentrations (from 0.1 to
382
1.3
l
g kg 1) in soil samples. Additionally, 5 pharmaceuticals(keto-383 profen, acetaminophen, atenolol, clofibric acid and
sulfametha-384 zine) were detected in some samples but always below the limits
385
of quantification (<0.1
l
g kg 1). The compounds showing thehigh-386
est concentrations were metoprolol (up to 1.5
l
g kg 1), anantihy-387
pertensive, and clarithromycin (1.3
l
g kg 1), an antibiotic. The rest388 of pharmaceuticals were always at concentrations lower than
389
0.4
l
g kg 1. Although some of these compounds showed relatively390
high log Kowvalues (over 4), such as fenofibrate, ketoprofen and
391 diclofenac, this may be not the best indicator to evaluate the
pres-392 ence of PhACs in terrestrial environments. Many of these chemical
393 can be either in ionic or neutral form depending on the pH of the Fig. 4. Concentration of LAS and AEOs (lg kg 1
) as a function of organic carbon content (%) (a and c) and clay content (%) (b and d) in soils.
Fig. 5. Vertical concentration profiles (lg kg 1) for selected surfactants in three soil cores: sampling points 40, 2 and 12.
394 soil and, therefore, their sorption capacity may change and better
395 be evaluated by Dow(pH-dependent n-octanol–water distribution
396 ratio) (Wells, 2006). Thus, some of the PhACs identified in this
397 study may show log Dowvalues that are from similar (0.33–0.34
398 for acetaminophen) to very different (0.16–0.67 for
sulfametha-399 zine) from those for log Kow(Table 1). Additionally, hydrophilic
400 interactions between ionic compounds and soils also occur. It has
401 been observed for AEOs, which were positively correlated to the
402 amount of clays in soil (Fig. 4d), but also for metoprolol and
clari-403 thromycin, both positively charged at environmental conditions
404 and the two most predominant PhACs in the sampling area in spite
405 of their relatively low log Kowvalues (1.88–3.16). This kind of
inter-406 actions has been previously foreseen from very recent laboratory
407 experiments (Schaffer et al., 2012) and field data from other
aqua-408 tic systems (Lara-Martín et al., 2014).
409 Results inTable 1can be complemented with those from a
pre-410 vious study carried out in the same study area, where 21 surface
411 soil samples were screened for 32 specific PhACs (Perez-Carrera,
412 2009; Perez-Carrera et al., 2010). Eleven target compounds were
413 detected at concentrations ranging from below limits of detection
414 (0.3–7.1
l
g kg 1) up to 24.3l
g kg 1. Omeprazole, used for treating415 peptic ulcers and not analyzed in the present work, was the most
416 commonly detected pharmaceutical (>50% of soil samples),
417 although we did not include it in this sampling campaign as we
418 used a different analytical methodology (Jelic et al., 2009). The rest
419 of compounds showed a low detection frequency (only 1–2
posi-420 tive samples) (Perez-Carrera, 2009; Perez-Carrera et al., 2010). As
421 most of the pharmaceuticals detected in the sampling area are only
422 for human consumption, their occurrence in agricultural soils may
423 be related to irrigation of crops with either recycled wastewater
424 (e.g., golf courses) or with river water, which is sometimes mixed
425 with treated/untreated wastewater. Application of sludge from
426 the WWTP El Portal over soils as a fertilizer cannot be discarded
427 as a source either. A few compounds (e.g., sulfamethazine) are also
428 for veterinary use, so they could be released into the environment
429 by disposal of manure residues and/or by leaching from animal
430 excrements (Halling-Sörensen et al., 1998).
431 4. Conclusions
432 Data on the occurrence, reactivity and behavior of PPCPs in solid
433 matrices is severely limited in comparison with aqueous matrices.
434 In that sense, this work shows some of the first data available on
435 the areal and vertical distribution of surfactants and
pharmaceuti-436 cals in sewage affected soils. Their occurrence in the vadose zone
437 can be explained by several sources, including the direct (or
indi-438 rect) use of treated and untreated wastewater for crop irrigation,
439 the application of sewage sludge and manure residues as fertilizer,
440 and the use of pesticides. Synthetic surfactants were detected in all
441 soil samples, and their distribution was related to the presence of
442 local sewage sources, as well as to the physico-chemical properties
443 of the soils. In this sense, LAS concentrations were positively
corre-444 lated with organic matter content in soils, suggesting hydrophobic
445 sorption mechanisms. AEO concentrations, on the other hand, were
446 positively correlated with the presence of clays, especially for
447 those ethoxymers having longer ethylene oxide chains. Presence
448 of PhACs in soils was scarce. Only 7 out of 64 compounds analyzed
449
could be measured, most of them showing high log Kowvalues
450 (>4.45) (e.g., diclofenac, fenofibrate and ketoprofen) or being
posi-451 tively charged at environmental conditions (e.g., atenolol,
meto-452 prolol, clarithromycin). Our data suggest a low exposure level for
453 pharmaceuticals in terrestrial environments if we compare their
454 occurrence and concentrations with those measured for
surfac-455 tants in the same soil samples.
456 5. Uncited references
457 Chemspider (xxxx), Jensen and Folker-Hansen (1995).
458 Acknowledgements
459 We express our gratitude to J.J. Montes de Oca and
460 J.M. Traverso-Soto for their help during the sampling campaigns
461 and to E. de Miguel (SCCYT UCA) for his technical support with
462 the LC-MS system. Thanks to Dr. Ignasi Queralt from the
Labora-463 tory of X-ray Analytical Applications (ICTJA-CSIC) too. This research
464 has been funded by the CICYT project CGL2008-05598 and a FPI
465 fellowship from the Spanish Ministry of Education and Science.
466 Appendix A. Supplementary material
467 Supplementary data associated with this article can be found, in
468
the online version, at http://dx.doi.org/10.1016/j.chemosphere.
469 2014.04.098.
Table 1
Chemical properties and concentrations (lg kg1
) of PhACs in three soils cores (12, 40 and 2).
Compound pKa Log Kow 12-A 12-B 40-A 40-B 2-B 2-C 2-D
Ketoprofen 3.12a 4.45a – – n.q. n.q. – – – Diclofenac 4.15b 4.51b 0.3 0.1 0.2 0.2 – 0.1 0.1 Acetaminophen 9.38b 0.46b n.q. n.q. – – – – – Atenolol 9.6c 0.03d n.q. n.q. n.q. n.q. n.q. n.q. n.q. Metoprolol 9.7b 1.88b 0.5 0.1 0.6 0.6 0.1 1.5 0.6 Clofibric acid 3.46b 2.58b n.q. n.q. n.q. n.q. n.q. n.q. n.q. Fenofibrate – 5.19b 0.4 0.3 0.4 0.2 0.4 0.4 0.2 Carbamazepine 13.9b 2.45b n.q. n.q. 0.1 0.1 0.1 n.q. n.q. Clarithromycin 8.89c – 0.5 0.5 1.3 0.5 0.3 0.6 0.7 Sulfamethazine 7.4c 0.89e n.q. 0.1 1.2 n.q. n.q. n.q. n.q. Famotidine – – 0.3 0.2 n.q. 0.2 0.2 0.3 0.3 Hydrochlorothiazide 7.9c 0.07d 0.1 0.2 0.2 0.2 0.2 0.2 0.2 Concentration (lg kg 1
); –, not detected; n.q., detected, not quantified.
a Baccar et al. (2012). b Vazquez-Roig et al. (2010). c Morais et al. (2013). d Chemspider (www.chemspider.com/chemical-structure). eGong et al. (2012). Q3
6 C. Corada-Fernández et al. / Chemosphere xxx (2014) xxx–xxx
470 References
471 Baccar, R., Sarrá, M., Bouzid, J., Feki, M., Blánquez, P., 2012. Removal of 472 pharmaceutical compounds by activated carbon prepared from agricultural 473 by-product. Chem. Eng. J. 211–212, 310–317.
474 Brownawell, B.J., Chen, H., Zhang, W., Westall, J.C., 1997. Sorption of non-ionic 475 surfactants on sediment materials. Environ. Sci. Technol. 31, 1735–1741. 476 Boxall, A.B.A., 2008. Fate and transport of veterinary medicines in the soil 477 environment. In: Aga, D.S. (Ed.), Fate of Pharmaceuticals in the Environment 478 and in Water Treatment Systems. CRC, Boca Raton, FL, USA, pp. 123–138. 479 Carlsen, L., Metzon, M., Kjelsmark, J., 2002. Linear alkylbenzene sulfonates (LAS) in 480 the terrestrial environment. Sci. Total Environ. 290, 225–230.
481 Candela, L., Fabregat, S., Josa, A., Suriol, J., Vigués, N., Mas, J., 2007. Assessment of soil 482 and groundwater impacts by treated wastewater reuse. A case study: 483 Application in a golf course (Girona, Spain). Sci. Total Environ. 374, 26–35. 484 Chemspider (www.chemspider.com/chemical -structure).
485 Corada-Fernández, C., Lara-Martín, P.A., Candela, L., González-Mazo, E., 2011. 486 Tracking sewage derived contamination in riverine settings by analysis of 487 synthetic surfactants. J. Environ. Monit. 13, 2010–2017.
488 Corada-Fernández, C., Lara-Martín, P.A., Candela, L., González-Mazo, E., 2013. 489 Vertical distribution profiles and diagenetic fate of synthetic surfactants in 490 marine and freshwater sediments. Sci. Total Environ. 461–462, 568–575. 491 Fytianos, K., Voudrias, E., Papamicheli, A., 1998. Behaviour and fate of linear 492 alkylbenzene sulfonate in different soils. Chemosphere 36, 2741–2746. 493 Gong, W., Liu, X., He, H., Wang, L., Dai, H., 2012. Quantitatively modeling soil–water 494 distribution coefficients of three antibiotics using soil physicochemical 495 properties. Chemosphere 89, 825–831.
496 Halling-Sörensen, B., Nors Nielsen, S., Lanzky, P.F., Ingerslev, F., Holten Lützhöft, 497 H.C., Jörgensen, S.E., 1998. Occurrence, fate and effects of pharmaceutical 498 substances in the environment – a review. Chemosphere 36, 357–393. 499 Hildebrandt, A., Guillamon, M., Lacorte, S., Tauler, R., Barcelo, D., 2008. Impact of 500 pesticides used in agriculture and vineyards to surface and groundwater quality 501 (North Spain). Water Res. 42, 3315–3326.
502 Heberer, T., 2002. Occurrence, fate and removal of pharmaceutical residues in the 503 aquatic environment: a review of recent research data. Toxicol. Lett. 131, 5–17. 504 Jelic, A., Petrovic, M., Barcelo, D., 2009. Multi-residue method for trace level 505 determination of pharmaceuticals in solid samples using pressurized liquid 506 extraction followed by liquid chromatography/quadrupole-linear ion trap mass 507 spectrometry. Talanta 80, 363–371.
508 Jensen, J., Folker-Hansen, P., 1995. In: Soil Quality Criteria for Selected Organic 509 Compounds, Arbejdsrapport Nr.47 fra MiljØstyrelsen. Danish Environmental 510 Protection Agency, Copenhagen, p. 156.
511 Jobling, S., Sheahan, D., Osborne, J.A., Matthiessen, P., Sumpter, J.P., 1996. Inhibition 512 of testicular growth in rainbow trout (Oncorhynchus mykiss) exposed to 513 estrogenic alkylphenolic chemicals. Environ. Toxicol. Chem. 15, 194–202. 514 Kolpin, D.W., Furlong, E.T., Meyer, M.T., Thurman, E.M., Zaugg, S.D., Barber, L.B., 515 Buxton, H.T., 2002. Pharmaceuticals, hormones, and other organic wastewater 516 contaminants in US streams, 1999–2000: a national reconnaissance. Environ. 517 Sci. Technol. 36, 1202–1211.
518 Krogh, K.A., Halling-Sørensen, B., Mogensen, B.B., Vejrup, K.V., 2003. Environmental 519 properties and effects of nonionic surfactants adjuvants in pesticides: a review. 520 Chemosphere 50, 871–901.
521 Lara-Martín, P.A., Corada-Fernández, C., Gómez-Parra, A., González-Mazo, E., 2010. 522 Seasonal changes in the concentration of anionic surfactants in estuarine 523 sediments from the River Guadalete (Cadiz, Spain). Scientia Marina 74S1, 125–
524 131.
525 Lara-Martín, P.A., Gómez-Parra, A., González-Mazo, E., 2005. Determination and 526 distribution of alkyl ethoxysulfates and liner alkylbenzene sulfonates in coastal 527 marine sediments from the bay of Cadiz (southwest of Spain). Environ. Toxicol. 528 Chem. 24, 2196–2202.
529 Lara-Martín, P.A., Gómez-Parra, A., González-Mazo, E., 2006. Development of a 530 method for the simultaneous analysis of anionic and non-ionic surfactants and 531 their carboxylated metabolites in environmental samples by mixed-mode 532 liquid chromatography–mass spectrometry. J. Chromatogr. A 1137, 188–197.
533 Lara-Martín, P.A., Gómez-Parra, A., González-Mazo, E., 2008. Sources, transport and
534 reactivity of anionic and non-ionic surfactants in several aquatic ecosystems
535 from SW of Spain: a comparative study. Environ. Pollut. 156, 36–45.
536 Lara-Martín, P.A., González-Mazo, E., Petrovic, M., Barceló, D., Brownawell, B.J.,
537 2014. Occurrence, distribution and partitioning of nonionic surfactants and
538 pharmaceuticals in the urbanized Long Island Sound Estuary (NY). Mar. Pollut.
539 Bull..http://dx.doi.org/10.1016/j.marpolbul.2014.01.022.
540 Linear Alkylbenzene Sulfonate, 2013. Environmental Risk Assessment, Brussels,
541 Belgium.
542 Litz, N., Doering, H.W., Thiele, M., Blume, H.P., 1987. The behaviour of linear
543 alkylbenzene sulfonate in different soils. A comparison between field and
544 laboratory studies. Ecotoxicol. Environ. Saf. 14, 103–106.
545 Matthijs, E., Holt, M.S., Kiewiet, A., Gerard, B., Rijs, G.B.J., 1999. Environmental
546 monitoring for linear alkylbenzene sulfonates, alcohol ethoxylates, alcohol
547 ethoxysulfate, alcohol sulfate and soap. Environ. Toxicol. Chem. 18, 2634–
548 2644.
549 Miége, C., Choubert, J.M., Ribeiro, L., Eusébe, M., Coquery, M., 2009. Fate of
550 pharmaceuticals and personal care products in wastewater treatment plants –
551 conception of a database and first results. Environ. Pollut. 157, 1721–1726.
552 Morais, S.A., Delerue-Matos, C., Gabarrell, X., Blánquez, P., 2013. Multimedia fate
553 modeling and comparative impact on freshwater ecosystems of
554 pharmaceuticals from biosolids-amended soils. Chemosphere 93, 252–262.
555 Oppel, J., Broll, G., Loffler, D., Meller, M., Rombke, J., Ternes, T., 2004. Leaching
556 behaviour of pharmaceuticals in soil-testing-systems: a part of an
557 environmental risk assessment for groundwater protection. Sci. Total Environ.
558 328, 265–273.
559 Ou, Z., Yediler, A., He, Y., Kettrup, A., Sun, T., 1996. Adsorption of alkylbenzene
560 sulfonate (LAS) on soils. Chemosphere 32, 827–839.
561 Perez-Carrera, E. 2009. Distribution and reactivity of regulated and emerging
562 organic pollutants in surface and groundwater systems. PhD. University of
563 Cadiz, Spain.
564 Perez-Carrera, E., Hansen, M., Leon, V.M., Björklund, E., Krogh, K.A.,
Halling-565 Sorensen, B., Gonzalez-Mazo, E., 2010. Multiresidue method for the
566 determination of 32 human and veterinary pharmaceuticals in soil and
567 sediment by pressurized-liquid extraction and LC-MS/MS. Anal. Bioanal.
568 Chem. 398, 1173–1184.
569 Rodríguez-Cruz, M.S., Sanchez-Martin, M.J., Sanchez-Camazano, M., 2005. A
570 comparative study of adsorption of an anionic and a non-ionic surfactant by
571 soils based on physicochemical and mineralogical properties of soils.
572 Chemosphere 61, 56–64.
573 Schaffer, M., Börnick, H., Nödler, K., Licha, T., Worch, E., 2012. Role of cation
574 exchange processes on the sorption influenced transport of cationic b-blockers
575 in aquifer sediments. Water Res. 46, 5472–5482.
576 Shen, Y.H., 2000. Sorption of non-ionic surfactants to soil: the role of soil mineral
577 composition. Chemosphere 41, 711–716.
578 Teijón, G., Candela, L., Tamoh, K., Molina-Díaz, A., Fernández-Alba, A.R., 2010.
579 Occurrence of emerging contaminants, priority substances (2008/105/CE) and
580 heavy metals in treated wastewater and groundwater at Depurbaix facility
581 (Barcelona, Spain). Sci. Total Environ. 408, 3584–3595.
582 Thiele-Bruhn, S., 2003. Pharmaceuticals antibiotic compounds in soils – a review. J.
583 Plant. Nutr. Soil Sci. 166 (2), 145–167.
584 Topp, E., Monteiro, S.C., Beck, A., Coelho, B.B., Boxall, A.B.A., Duenk, P.W., Kleywegt,
585 S., Lapen, D.R., Payne, M., Sabourin, L., Li, H., Metcalfe, C.D., 2008. Runoff of
586 pharmaceuticals and personal care products following application of biosolids
587 to an agricultural field. Sci. Total Environ. 396, 52–59.
588 Vazquez-Roig, P., Segarra, R., Blasco, C., Andreu, V., Picó, Y., 2010. Determination of
589 pharmaceuticals in soils and sediments by pressurized liquid extraction and
590 liquid chromatography tandem mass spectrometry. J. Chromatogr. A 1217,
591 2471–2483.
592 Wells, M.J.M., 2006. Log Dow: key to understanding and regulating
wastewater-593 derived contaminants. Environ. Chem. 3, 439–449.
594 Xu, J., Chen, W., Wu, L., Green, R., Chang, A.C., 2009. Leachability of some emerging
595 contaminants in reclaimed municipal wastewater-irrigated turf grass field.
596 Environ. Toxicol. Chem. 28, 1842–1850.
597