Development of a Thermal Device for a Haptic Display
byMichelle Judith Berris B.S. Mechanical Engineering
Massachusetts Institute of Technology, 1999
Submitted to the Department of Mechanical Engineering in Partial Fulfillment of the Requirements for the Degree of
MASTER OF SCIENCE IN MECHANICAL ENGINEERING
AT THE
MASSACHUSETTS INSTITTUE OF TECHNOLOGY
SEPTEMBER 2002
MASSACHUSETTS INSTITUTE OF TECHNOLOGY
OCT
2
5 2002
LIBRARIES
C 2002 Massachusetts Institute of Technology. All rights reserved.
Signature of Author ... Depa
C ertified by...
rtment of Mechanical Engineering August 9, 2002
ILynette A. Jones
Principal Research Scientist in Mechanical Engineering Thesis Supervisor
A ccepted by...
Ain A. Sonin Chairman, Department Committee on Graduate Students
Development of a Thermal Device for a Haptic Display by
Michelle Judith Berris
Submitted to the Department of Mechanical Engineering on 09 August 2002 in partial fulfillment of the requirements for the Degree of Master of Science in
Mechanical Engineering
Abstract
This research involves the development of a thermal display for a haptic device. A comprehensive review of human temperature perception is presented along with a
description of existing thermal display technologies. The results from preliminary testing of prototypes for the thermal display are described together with the layout of the future design. Results from physiological experiments indicated that finger thermal responses were not consistent between subjects and showed little to no relation to the material in contact with the hand. Results from psychophysical experiments confirmed that successful material discrimination is limited to material pairs where differences in thermal conductivities are large and in the range of 200-300 W/m0C. A fast responding
thermal display has been designed and tested using a single RTD as both a heater and sensor. The cold temperature source is provided by a thin-walled tube with water flowing through it.
Thesis Supervisor: Lynette A. Jones Title: Principal Research Scientist
Acknowledgements
My most sincere thanks are extended to Dr. Lynette Jones for her thoroughness as a
scientist and thesis advisor, and for introducing me to the haptics community. She exemplifies the ideal balance between a successful academic and devoted parent. Thank you to Professor Ian Hunter for keeping me on my toes and reminding me that there is always more to learn.
The greatest asset of the Bioinstrumentation Laboratory is the commitment of its
students. The current research would not have been completed without the assistance of the following people: Aimee Angel for training in the machine shop, Bryan Crane for guidance in Visual Basic programming, Robert David for reviewing heat transfer, Laura Proctor for suggestions in electronic circuit design and Peter Madden who has mastered
all of these and many more fields during his tenure in the lab.
Completion of a postgraduate degree demands perseverance and intellect, but more importantly, a sense of humor. The days in which I could not laugh at myself, James Tangorra provided comic relief. Rachel Peters endured my ever-changing moods, and encouraged discussions equally important but often unrelated to mechanical engineering.
I am grateful for her friendship, perspective, and genuine willingness to help in whatever
way possible.
Finally, I thank all the members of the Newman Lab and specifically those who participated in these experiments. This research was supported through the Advanced
Decision Architectures Collaborative Technology Alliance sponsored by the U.S. Army Research Laboratory under Cooperative Agreement DAAD 19-01-2-0009.
Table of contents
Abstract ... 2
Acknow ledgem ents... 3
Table of contents ... 4
1. Introduction... 6
2. Physiology... 7
2.1. General description... 7
2.2. Blood flow ... 8
2.3. Theoretical tissue - heat m odel ... 9
2.4. Biom aterial properties... 11
2.5. Therm oreceptors ... 12
2.5. 1. Firing rates ... 13
2.5.2. Speed of inform ation transm ission ... 14
3. Therm al sensing ... 15
3.1. Perceptual studies ... 15
3.1.1. Thresholds... 15
3.1.2. Spatial sum m ation... 16
3.2. Heat transfer m odalities... 17
4. Effects of contact force ... 19
4.1. Influence on blood flow ... 19
4.2. Pressure profile with fingerpad compression... 19
5. M aterial discrim ination... 21
6. Tem perature transducers... 23
6.1. Therm ocouples... 23
6.2. RTD s...24
6.2.1. Platinum RTDs...25
6.2.2. Heat flow and self-heating ... 26
6.3. Peltier device... 27
7. Existing technology ... 29
8. Prelim inary testing ... 33
8.1. Sensor selection ... 33
8.2. JP Technologies thin film RTD ... 34
8.3. Hot and cold transients ... 36
8.3.1. Therm al transients via water ... 36
8.3.2. M aterial induced transients... 38
8.3.3. Force sensors integrated with therm al testing... 42
8.4. Peltier prototype... 43 8.5. Psychophysical testing... 46 9. RTD therm al display... 49 9.1. Circuit design... 50 9.2. RTD testing... 51 9.3. Future work... 53 10. Conclusion ... 54 References... 55 4
Appendix A: Visual Basic code to control data acquisition ... 60
A. 1. Code for force and temperature sensors and recirculating chiller ... 60
A.2. Code to separate incoming streaming data ... 66
Appendix B: MathCad 2001i script ... 68
B. 1. Converting voltage measured with RTD to temperature ... 68
B.2. Mathematical reversion for polynomials ... 70
Appendix C: C++ code to interface between National Instruments Data Acquisition Board and MathCad 2001i... 71
C .1. A /D Function ... 71
C .2. D /A Function ... 72
1. Introduction
Touch is one of the more complex senses; it pervades our daily exploration of the environment and facilitates interactions with tools. Haptic interfaces, a relatively new field of research, involve the kinesthetic and tactile senses in a real or computer generated environment. Two types of feedback can be presented in a haptic interface, force
feedback which conveys information about the mechanical properties of objects, and tactile feedback which conveys information about an objects material and geometrical properties.
Haptic interfaces were introduced in the early 1940s to assist in the handling of hazardous materials. The operator of a grasper or manipulator could remotely perform tasks that would otherwise compromise human safety. Force and tactile cues in human-machine interfaces provide the feedback about the task being performed. Early haptic interfaces also provided communication media for the deaf and blind.
This research describes the development of a thermal display for a haptic device. A comprehensive review on human temperature perception is presented along with a description of existing thermal display technologies. This is followed by a description of preliminary testing of prototypes for the thermal display and a layout of the future design.
2. Physiology
2.1. General description
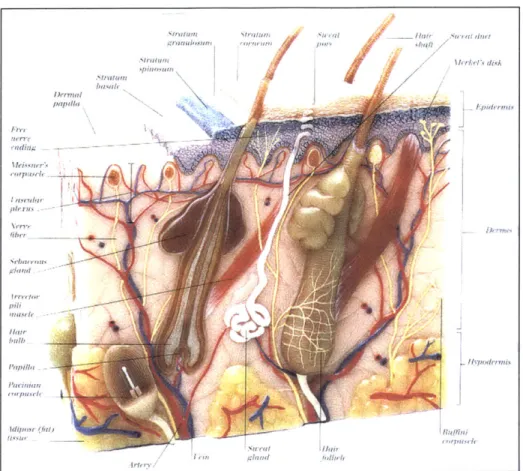
Skin, the largest organ of the human body, contains an outer epidermal shell of cellular, stratified epithelium, and a deeper dermal layer consisting of connective tissue (see Figure 1). In addition to protecting against invasion from microbes or injury, skin provides the primary elements for heat regulation through sensors, sweat, and blood vessels (Moore & Agur, 1995).
An integrated control system maintains a constant temperature of 37*C for the vital organs in the trunk and head, and minimizes environmentally-induced surface
temperature fluctuations. Thermoreceptors in the skin signal temperature changes to the hypothalamus, which in turn sends out efferent commands for control of blood flow. Blood acts as a conduit, transporting heat from the heart, and conveying it to the
peripheral circulatory system. This network cools the blood from the body core, elevates the skin surface temperature, and enhances the removal of metabolically generated heat in muscle tissue (Fulton, 1956).
Figure 1. Anatomical structure of skin and subcutaneous tissue (Visual Encyclopedia, 1999).
2.2. Blood flow
Blood flow, the main source of nutrition and heat for the human body, is ultimately responsible for surface temperature regulation. Analysis of biological heat exchange
ascribes the blood-tissue interaction to the surface areas of capillaries, arterioles and venules (Weinbaum & Jiji, 1985), and more recently to larger (100-500 Am2) deeper
countercurrent vessels (Weinbaum & Jiji, 1985). Countercurrent vessels transfer heat between a pair of vessels with opposing directions of flow. They continuously branch,
shrinking in size, spacing and flow velocity with depth.
Systemic cooling and heating prompt vasomotor activity in the extremities. During vasodilation, the blood vessels expand to deliver more blood for cooling in the peripheral
system. Conversely, vasoconstriction inhibits blood flow to the peripheral system, so as to preserve core body temperature.
8 Ayr/.'
/t"Iu
0,110 As pill",1 pdinoal ItyI))dl -I'. I I ryl 'y "In the arm, blood flows through the radial and ulnar arteries and branches into the palmar arches to supply the fingertips and phalanges. The arteriovenous anastomoses (AVAs) regulate flow between the superficial arteries and veins. AVAs close once the body cools, reducing blood flow through the hand and redirecting blood back to the core through deep veins. Heat input to the hand declines with reduced flow and counter-current heat exchange. Blood in the hand travels at 0.5-50 mL/min per 100 ml of tissue, and increases in the fingers, due to the presence of more AVAs (Spray, 1986).
2.3. Theoretical tissue - heat model
Shitzer et al. (1996) assess bioheat transfer in the hand with a lumped-parameter tissue temperature model. In this model, a single artery and vein transport heat to a gloved semispheric finger. Heat balance at the finger is based on heat storage, environmental heat exchange, and heat clearance through blood perfusion as given by:
pc = hA(T -T)+ pbWbcb(T - T),
at
where A is fingertip surface area, h is the heat transfer rate, Wb is the blood perfusion rate, cb is the blood heat capacity, Pb is blood density, Tb is blood temperature and T is tissue temperature.
The initial conductive heat transfer between a finger and solid object can be modeled as a step change in surface temperature for two semi-infinite solids (Myers, 1971). This representation remains valid for a short time period in a small contact region. Assuming no surface resistance, both the finger and object instantaneously achieve a common temperature, Tc, upon contact. Substituting the solution to the semi-infinite solid problem, with an initial temperature ti,
t(x,0) =ti +(t, - ti) e-0 e- d , 2
f 2
into Fourier's law of heat conduction
aT
q = -K - 3
&x
k x(te -ti) 4 ;r
where q is the equivalent heat flow into the finger or out of the wall and k is the thermal conductivity of the object. Bergamasco et al. (1997) utilize partial and ordinary
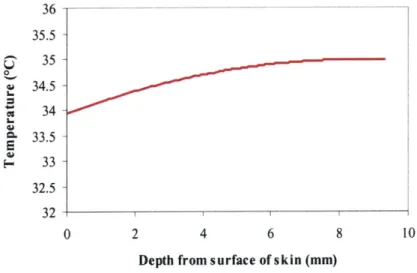
differential equations (PDE, ODE) to illustrate finger-object interactions. Their first model portrays the transition from core temperature to surface temperature for a one dimensional finger in equilibrium with the surrounding air (20*C). The deterministic model is described by a Taylor expansion. Thermal material properties for human tissues are derived from the relative composition of water (75%), fat and protein in the tissue. An equivalent density calculation for a composite material is as follows:
1
Peq = MI + 2 + 3 5
A P2 P3
where m is percent of total mass for each material. The solution to the model is expressed as a linear combination of exponential functions as shown in Figure 2.
36 35.5 35 - 0-34.5 I~34 33.5 k 33 32.5 32 -0 2 4 6 8 10
Depth from surface of skin (mm)
Figure 2. Model of finger temperature as it transitions from core to skin surface (Bergamasco et al., 1997).
The ODE evaluation assumes that the finger is a homogenous, thermally passive, semi-infinite solid. The model partitions the cutaneous tissue into ten layers each with different material properties, bisects the object into two identical sections and neglects lateral blood flow, thermal radiation, and metabolic affects. The contact temperature is
10
constant with time and the solution from the earlier non-contact model defines initial value conditions. The inner layer xi' is given as:
2k [T -x (t)]+ 1 2k [x(t)-x t)]
D. Di +D 6
Dipc
where Di and D, are dimensions of the inner and superficial layer. Bergamasco et al. use this model to simulate a 1 s step input for a finger in contact with aluminum, marble or wood. The resulting graphs show the initial skin temperature at 30'C, followed by a spike in temperature within the first 100 ms which settles to a steady state value after 1 s. The spike associated with aluminum is more pronounced than spikes associated with marble and wood. The final model depicts an experiment in which an object is contacted
for 10 s then released.
2.4. Biomaterial properties
Specification of biological material properties largely depends on testing conditions. For example, thermal conductivity of skin is greater in-vivo than in-vitro, and decreases proportionally with temperature. Table 1 lists properties relevant to the preceding
Table 1. Biomaterial properties (Chato, 1985; GE, 1977).
Thermal conductivity W/mOC
Human skin at body temp (in vivo) 0.28-0.48 Human skin at body temp (in vitro) 0.21-0.41
Water 0.59
Blood 0.51
Fat at body temp (in vitro) 0.094-0.37
Thermal diffusivity m2/S
Skin at body temp (in vitro) 0.82x10 7 - 1.2x10⁷
Skin at body temp (in vivo) 0.4x10 7 - 1.6x10⁷
Specific heat kJ/kg0C Tissue 3.899 Blood 3.136 Density kg/m3 Tissue 1,057 Blood 1,050
Heat transfer coefficient W/m0C
Finger 8.09
Emmitance Ratio
Skin 0.993
2.5. Thermoreceptors
Thermoreceptors are categorized into cold and warm sensors and are differentiated by their responses to changes in temperature. The cold and warm sensors are free nerve endings and the associated axons are small myelinated AS and unmyelinated "c" fibers.
Warm receptors are 1-2 yim in diameter and 150 jim below the skin surface, in contrast to cold receptors which are 3 ptm in diameter and 300 pm deep (cf Fulton, 1956). The receptive field of warm and cold receptors is less than 1 mm in diameter (Yarnitsky & Ochoa, 1991). Although thermoreceptor concentration varies with body site, cold
receptors are always more numerous than warm receptors as illustrated in Table 2 and are most abundant in the tongue, face and scrotum (Darian-Smith, 1984). Cold and likely warm fibers innervating the glabrous skin of the fingers and palm populate the hand with
a density of 0.5-0.7 fibers/mm2(Darian-Smith et al. 1973).
Table 2. Thermoreceptor concentration density measured in points responding to stimulation per 100 mm2
(Fulton, 1956).
Cold Warm
Forearm 14 1-2
Hand 2.5 1
Face 10 2
Increases in skin temperature augment warm receptor firing, and reductions in temperature amplify cold receptor firing. Warm receptors fire constantly at skin temperatures above 30'C with peak intensities between 41-47'C (Spray, 1986). Cold receptors, which overlap warm receptors at 37'C, respond over a wider temperature range of approximately 5-43*C with peak intensities of 4-6 impulses/s. Heat pain commences abruptly at 45'C and cold pain has a slower onset at temperatures below 15-18'C (Darian-Smith, 1984). This presumably explains the inclination to withdraw quickly a finger in contact with a hot object, and the less abrupt response to a cool object in these temperature zones. Cold and heat pain are not mediated by thermoreceptors, but by specialized thermal nociceptors.
Cold fibers reportedly fire in bursts at temperatures below 300C and fire paradoxically
above 45*C which is associated with cutaneous vasodilation and secondary effects (Chen,
1997; Darian-Smith, 1973, 1984; Dodt & Zotterman, 1952b; Spray, 1986). Continued
exposure of thermoreceptors to extreme temperatures leads to fiber destruction.
2.5.1. Firing rates
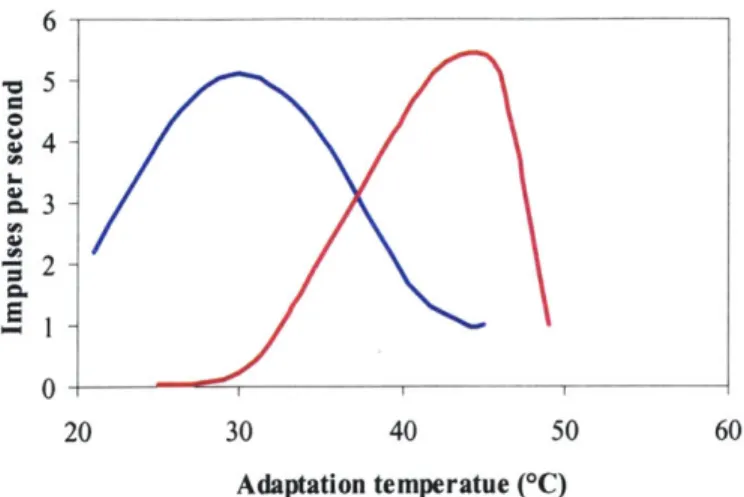
Thermoreceptors discharge with frequencies of 1-6 impulses/s for skin temperatures between 30-35'C as depicted in Figure 3 (Darian-Smith et al., 1973; Spray, 1986). Dodt and Zotterman (1952a) reported 1.5-3.7 impulses/s over the range of 37.5-40'C for warm
fibers dissected from the median nerve of a rhesus monkey which is 70% higher than the equivalent value for cold sensors at temperatures below 220C (Dodt & Zotterman, 1952b;
6 5 4-3 -4-3 S2-0 20 30 40 50 60 Adaptation temperatue (*C)
Figure 3. Discharge frequencies of cold (blue) and warm (red) receptors (Schmidt, 1983). The firing rate depends on the steady state temperature and the rate of change of temperature (Darian-Smith, 1984; Darian-Smith et al., 1973). Time constants for the response to dynamic cold stimuli are 2.2 s in the cat tongue, and 15-30 s in the monkey hand Smith et al., 1973). Warm receptor responses decay within 5-12 s
(Darian-Smith, 1984), independent of the adapting temperature. The warm receptors are also characterized by a linear correlation between firing rate and magnitude of a temperature
step for steps in the range of 1-8*C above the adaptation temperature. Most receptors adapt to static stimuli within 30 minutes, but do not entirely cease firing.
2.5.2. Speed of information transmission
Conduction velocities of both warm and cold fibers are in the range of 0.4-20 m/s (Schmidt, 1983). Darian-Smith et al. (1973) dissected apart individual median nerve
fibers in the upper arm of monkeys. Stimulation of thermoreceptors below the wrist elicited conduction velocities of 1.2 m/s and 14.5 m/s for warm and cold fibers respectively (Darian-Smith, 1984). The faster conduction velocity of cold receptors results from the large diameter myelinated axons whereas warm receptors have small diameter unmyelinated axons. Increases in epidermal thickness lengthen the pathway to the receptor and also influence response time (Chen, 1997).
3. Thermal sensing
3.1. Perceptual studies
Human skin temperature is typically 32-351C, although it fluctuates in the range of 20-40'C depending on the time of day, ambient temperature, and physical activity. Over the temperature range of 30-36'C, humans do not sense fluctuations in temperature, although receptors are spontaneously firing (Schmidt, 1983). Beyond this range, the ability to detect changes in temperature depends on a number of variables including the area of stimulation, the rate of change in temperature, and the amplitude of the change. Thermal adaptation occurs some time after stimulation and results in neutral sensation. For small temperature steps, a thermal stimulus is adapted before the skin temperature has
stabilized, but a large temperature step allows the skin temperature to stabilize before adaptation (Schmidt, 1983).
3.1.1. Thresholds
Human thermal sensory thresholds are influenced by body site, age, area, duration of exposure, and rate of temperature change. An absolute thermal threshold is defined as the smallest temperature change above or below skin temperature that is detected. The minimal heat energy required to elicit warm sensation is 6.28x10⁻³ kgJ/m2s (cf Fulton,
1956).
A thorough investigation of thresholds in 13 regions of the body of subjects aged from 18-88 years determined that there was a 100-fold variation in sensitivity (Stevens &
Choo, 1998). The area encircling the mouth is the most sensitive region and the lower extremities are the least sensitive (Stevens & Choo, 1998). All body zones are more sensitive to cold stimulation than to warm stimulation. For example, the warm threshold
for the toe in people aged 65 and older is 10 C, whereas the equivalent cold threshold is
-2.7'C. Darian-Smith (1984) identified the thenar eminence and volar forearm as the most
sensitive portions of the hand and forearm. Within the hand, low thresholds are reported on the dorsal hairy skin of the fingers, and volar surface of the forearm, whereas higher thresholds are recorded on the finger and palmar pads (Johnson et al., 1973). Thermal
sensitivity declines with age, most profoundly at the extremities, and less significantly at the more central regions such as the mouth and belly. Gender has no apparent effect on thermal thresholds (Dyck et al., 1974; Stevens & Choo, 1998).
In a neutral environment and an initial skin temperature of 34'C, human subjects can discriminate a temperature change of 0.01 C for warming and 0.048'C for cooling (Johnson et al., 1973). The range of thresholds measured using other experimental methods is as small as 0.00P1C for warm and 0.004'C for cold (Fulton, 1956) and as high as 5.27*C and 3.23'C for warm and cold respectively (Yarnitsky & Ochoa, 1991). An increase in initial skin temperature from 31 C to 36C doubles the cooling and halves the warming threshold (Darian-Smith, 1984). Thresholds are influenced by the duration of thermal stimulation. A linear tradeoff is apparent between the threshold and the duration of a stimulus for periods less than 1 s. The thermal threshold increases dramatically for slower changes (Schmidt, 1983).
3.1.2. Spatial summation
Spatial summation of stimuli is a common feature of information processing in the thermal modality. An increase in the area of a thermal stimulus is perceived as indicating a more intense stimulus. This is different from vision for example, where a bigger visual cue specifies magnification in size, not in brightness. In thermal perception, intensity and area are inversely proportional until high intensities near the pain threshold are reached. At temperatures of 45'C, the area of stimulation has no influence on perceived intensity, although the stimulus is more accurately located (Stevens et al., 1974). The lower spatial summation threshold is 100 mW/mm2 while the upper boundary is 100 W/mm2 (cf
Stevens et al., 1974).
The perceived magnitude of a thermal stimulus is independent of the rate of temperature change for rates faster than 0.50C/s (Molinari et al., 1977). Experimentation conducted
with temperature changes greater than 1 0C/s showed that perceived cold increases linearly as a function of area (maximum 2380 mm2) with constant slope. In contrast,
warmth estimation, increases logarithmically as a function of area, and converges with different intensity curves at higher intensities (Stevens & Marks, 1979).
3.2. Heat transfer modalities
The three modes of heat transfer are convection, conduction and radiation. Convection refers to energy exchange by means of one medium flowing over another, prompted by a difference in density or forcefully with a pump, compressor or fan. The heat flux or energy flow per unit of time is defined by:
QCONV = h, (I - T2).A, 7
where A is surface area and the heat transfer coefficient, he, is a function of media temperature and nature of the flow field, which follows Newton's law of cooling. In the context of human thermal studies, heat transfer via convection occurs when the body is exposed to natural or forced air provided by a fan, and when it is immersed in a bath of hot or cold water (Chen, 1997; Mills, 1999).
The Fourier conduction law relates the heat transfer rate to the temperature gradient between two objects in physical contact according to
QCOND =-A(T -T 2)Y 8
L
where k is thermal conductivity and L is length of contact. An example of conductive stimulation is a Peltier device or material sample in contact with the skin. This is the most frequently used of the three modes of heat transfer in human thermal studies.
Electromagnetic radiation transfers energy within one object, released upon photon collision, to another object. The wavelength and frequency determine the type of radiation. The net radiant energy interchange between two surfaces is given by:
=~
=Ar -Tj9
RAD , T 2 '
where hr is the radiation heat transfer coefficient. Radiative sources for artifical thermal stimulation include quartz or infrared (0.1 - 100 ptm) heat lamps. This was used in earlier
addition, evaporative heat loss from the body accounts for energy exchange, but is negligible for the hand.
4. Effects of contact force
The force imposed by a finger on an object may affect thermal responses in two ways. First, compressing the cutaneous tissue of the index finger may enhance thermal sensing
by increasing the area of contact with the object. Compressing the finger may also affect
finger temperature by collapsing blood vessels in the region which prevents continuous tissue-heat exchange.
4.1. Influence on blood flow
Of the blood flow to the finger tip, 90% is bound for temperature regulation (cf Mascaro,
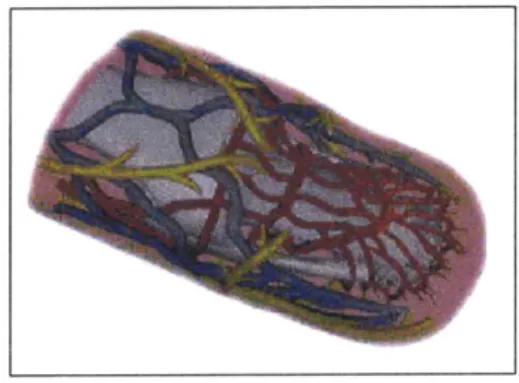
2002). Although the digital arteries, which are protected by the underlying bone, are unaffected by contact pressure exerted by the finger pad, the larger, more compliant digital veins which run lateral to the bone (Figure 4) have a lower internal blood pressure and collapse. This results in accumulation of blood pools in capillaries under the nail bed and impedes the continuous warming process.
Figure 4. Vascular anatomy of the fingertip, digital arteries and veins are red and blue respectively (cf Mascaro, 2002).
4.2. Pressure profile with fingerpad compression
When the finger makes contact with an object, the contact area on the finger pad begins as a single point, expanding exponentially in size with surface compression. Contact distribution is symmetric in the medial-lateral direction but not in the proximal-distal direction (Pawluk & Howe, 1999). A force of 1 N applied normal to the finger pad compresses two thirds of the corresponding contact area compressed by a force of 10 N 77
(Westling & Johansson, 1987). If there is a circular pressure profile, there will be a 0-6 mm radius change from 0-1 N (Westling & Johansson, 1987).
Pawluk & Howe (1999) introduced a theoretical model for a distributed pressure response of the index finger pad to a flat surface with dynamic 0-2 mm displacements for 0-2 N of force. This is given by:
t(e)(U)= emu(t) -1] 10
m
where u(t) is the deformation at the point of maximum indentation on the fingerpad. The model is derived from an interaction between an incompressible, linear isotropic,
homogenous, elastic sphere and a rigid plane. Constants b and m were generated
empirically by accelerating 64 indentor tactors spaced 2 mm apart into the index finger of five subjects at 200 Hz.
5.
Material discrimination
Thermal and tactile cues are both used to recognize and discriminate between materials. The hand is extremely good at discriminating texture. For example, a matrix of 6 Am high, 50 Am diameter dots etched onto a glass plate, is detected by stroking the finger across the surface with 0.2 N of force (Srinivasan et al., 1990).
In contrast, subjects can differentiate materials with only large differences in thermal conductivity and heat capacity (Jones & Berris, 2002). It takes a subject 3-5 s on
average, to discriminate between an ice cube, heated soldering iron, aluminum block, and insulation foam (Caldwell & Gosney, 1993). A plot of finger skin temperature versus time as the finger contacts various material samples shows a horizontal line at 32'C representing initial finger temperature, a nearly vertical drop upon material contact (2.5*C in less than 0.5 s for aluminum) followed by another horizontal line at a lower steady state temperature (Ino et al., 1993).
Clinical neurological testing includes evaluation of thermal sensations in patients with diseases characterized by small fiber damage. A testing apparatus named the "Minnesota thermal disks" (Dyck et al., 1974) is composed of 18 mm diameter disks made of copper, stainless steel, PVC and glass. Copper is always presented to the subject along with one of the other materials for 2 s. The subject must determine which material of the pair is warmer, at seventeen different points on the body. Of the three different material combinations, discrimination between copper and PVC is best, and between copper and
stainless steel the worst. This corresponds to the largest and smallest difference in thermal conductivity respectively. Correct discrimination occurs most frequently on the
forehead and is least accurate on the back and thigh.
Ino et al. (1993) and Caldwell & Gosney (1993) have both developed thermal displays that simulate contact with various materials, using a Peltier device. On the basis of the change in finger temperature upon contact with the material, Ino et al. simulate contact with aluminum, glass, rubber, polyacrylate, and wood. During testing, a subject
identifies both materials presented in the display by name. Presentation of two aluminum samples is correctly identified 100% whereas presentation of polyacrylate and glass are successfully identified only 6% of the time.
Using a robot and data glove system, Caldwell & Gosney (1993) presented an ice cube, heated soldering iron, aluminum block, and insulation foam. A signal from a
thermocouple on the robot indicated the type and magnitude of thermal transient, which was presented to the subject who wore a glove fitted with a Peltier device. Subjects successfully identified each material 80% of the time.
6. Temperature transducers
Most materials respond in some way to a change in temperature. This has resulted in the development of a myriad of temperature sensors ranging from embedded semiconductors to simple bimetallic strips (Capgo, 1998). The most reliable sensors which are targeted at
small, high speed, precision applications, are thermocouples and resistive temperature detectors (RTDs).
6.1. Thermocouples
Thermocouples are the most common and versatile of temperature sensors. A
thermocouple circuit contains two metals joined together at a measurement junction as shown in Figure 5. A voltage generated by the temperature gradient from the union of
dissimilar materials, known as the Seebeck effect, provides the output signal for the sensor. The Seebeck voltage comprises a Peltier voltage, proportional to the junction temperature, and a Thomson voltage, VT, derived from the gradient along the wires. The
latter of the two accounts for the majority of the mV signal range and is described by,
T2
VT = (QA - QB)dT 11
where QA and QB are the temperature independent thermal transport constants for the respective materials.
metal 1
Junction metal 2 small voltage
Figure 5: Thermocouple (Capgo, 1998).
Thermocouples do not require power for excitation and thus do not self heat. Response time varies with design; thermocouples sealed by a sheath may not respond for 75 s, whereas an exposed thermocouple registers within 2 s. Sensitivity ranges from 10-70
AV/*C. Thermocouples are internationally standardized with 12 types, each with a
different material combination and respective Seebeck voltage curve. Use of a thermocouple requires voltage compensation and linearization.
6.2. RTDs
The resistance of a resistor is determined by delivering an excitation current and measuring the voltage across its leads according to the relation
V=I-R. 12
An RTD is essentially a variable resistor; the resistance of a heated metal increases due to the reduction of the mean free path of free valence band electrons. The temperature coefficient of resistance (TCR) for metals varies between 0.003 and 0.007 DI P/0 C and is influenced by very slight differences in material composition. The average coefficient for a given metal between 0*C and 100 C can be calculated by:
R100 - RO 13
100R0
where RO is the ice point, or resistance at 00C. RTDs are manufactured in two package
types, either by encasing a coil of wire in a ceramic tube or plating a thin film as shown in Figure 6.
ceramic wubstrate
wire coil
ceramic holder
Figure 6: Wire wound and thin film RTDs (Capgo, 1998).
The quantity of conductive material embedded in an RTD is calculated at ice point and fine tuned with laser trimming according to:
PL
A'= 14
A
where p is conductor density, L is conductor length and A is cross sectional area.
24
6.2.1. Platinum RTDs
Platinum is favored over other RTD metals for its precision, linear relation between temperature and resistance, and stability in air over a large temperature range (see Figure
7).
I
I
5-0 -100 0 100 200 3004 '4 32 212 392 572 7 Temperature 500 6 932 1130 70012 1292Figure 7: Relative resistance vs. temperature of typical RTDs (Honeywell, 1998).
The Callendar Van Dusen polynomial (Honeywell, 1998) specifies RT, the resistance at a temperature T for platinum RTDs with constants A, B, C, a, fl, and 6:
RT = RO(I+ AT + BT2 -100CT' +CT ), ag 100 -aS B = , 1 1002 CTo = a , and 100 4 RO(l+ a -260)- R2 4.16. -R *a
For T > 0,
f= 0 and C= 0 which simplifies the equation to an easily solved quadratic
where T is a function of R:
-RA+ A2R2 -4R2B(RO - RT
2ROB
00 192
As was noted for thermocouples, platinum RTDs also conform to an International Standard (IEC75 1). Standards for both sensor types have updated calibrations to reflect ITS-90, the International Temperature Scale change of 1990.
6.2.2. Heat flow and self-heating
The excitation current of an RTD induces an effect referred to as "self heating." Manufacturers recommend limiting operating current to 5 mA in order to avoid the additional heat factor. The magnitude of this term depends on thermal diffusivity
Y=- - 21
p-c sec
as defined by density p, thermal conductivity K, and specific heat c, in addition to RTD geometry, and the thermal power dissipated which is given by:
V 2
P=-=I-V, 22
R
where V is voltage output, I is input current, and R is the calculated resistance. RTD
TI _i X=0
L
Mounting Surface
Figure 8: RTD model (Honeywell, 1998).
The general solution to the heat conduction equation, approximated as a one-dimensional problem for a thin film RTD drawn in Figure 8, is composed of a time independent temperature distribution and a series sum of exponentially damped orthogonal functions:
w ____W si23
u(x,t)=(T2 -7).- +7j+be , 23
L n=1
where t is time, x = 0 at TI, x =L at T2 and
b = x 2 - - sin 24
where f(x) equals temperature distribution at t = 0. Applying Equation 3 as a boundary condition to Equation 24, reduces the self heating factor to
PL
7 = -- +T2, 25
A2Y
where A2 is the RTD surface area (Honeywell, 1998).
6.3. Peltier device
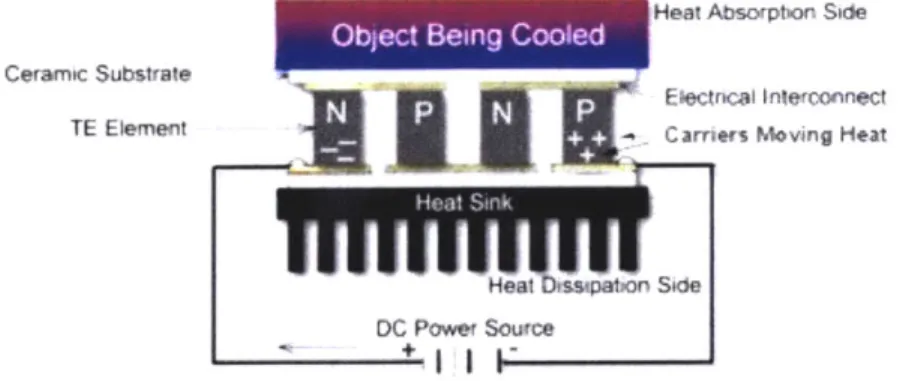
A thermoelectric cooler or Peltier device, pumps and produces heat without any moving
parts according to the Peltier effect previously described. N and P-doped semiconductors connected in parallel thermally, and in series electrically, are sandwiched between two ceramic substrates. A unidirectional heat flows between the substrate, in proportion to an input current traveling through each N and P pair generates a hot and cold side (see Figure 9).
Heat Absorptian Side
Ceramic Substrate
E'lctncal Interconnect
TE Element
3
C arriers Moving HeattffitwstptronSide DC Power source
Figure 9: Schematic diagram of a thermoelectric cooler (Capgo, 1998).
A heat sink must be integrated with the Peltier module in order to dissipate heat from the
cold side. Liquid cooled and forced convection heat sinks work best, removing 0.005-0.5*C/Watt, while maintaining a temperature of 10-20*C above ambient.
The heat pumping capacity of a Peltier device,
Qc,
depends on the temperature differential dT, power input, and module thermal conductivity Km:QC=SMTCI-
KM dT, 26where SM, the Seebeck coefficient is a combination of polynomial expressions for both hot and cold sides with module specific coefficients.
SM (SMTh -SMTC) 27
dT
s2T 2 s3T 3 s4T4
SMT(h,c) =sT + 2 + 3 + 4 28
2 3 4
Km and RM in Equation 26 mimic Equations 27 and 28, replacing the variable S, with K and R respectively. The power input has a thermal and an electrical term due to the input voltage,
V,, = SdT + IRm. 29
The time t, to reach a desired temperature can be estimated from
t = (d T). 30
Qt
0+
Qt
Qto is the initial heat pumping capacity when dT=O, and Qtt is the heat pumping capacity once the desired temperature is attained (Ferrotec, 2002).
7. Existing technology
Haptic displays are used for training, entertainment, and industrial applications. They transmit force feedback and/or tactile information using physical models of object properties and behavior. Haptic displays range from gross force feedback found in computer or video games to vibrotactile displays used to convey surface features in simulated environments developed for surgical training.
Innovation in thermal display technology has been propelled by novel applications in medical diagnostics (Jamal et al., 1984; Pepler et al., 1985), physiological research (Kenshalo & Bergren, 1975; Monkman & Taylor, 1993) and virtual environments (VE) (Caldwell et al., 1996; Dionisio, 1997; MacLean & Roderick, 1999; Ottensmeyer &
Salisbury, 1997). Contemporary displays consist of a Peltier thermoelectric device, temperature sensor and a heat sink, controlled by a computer or microprocessor. These
structurally rigid assemblies are often retrofitted to pre-existing haptic interfaces (Yee, 2000; Caldwell & Gosney, 1993; Mukai et al., 2000) and are limited by their size and temporal response to temperature changes. At best, they output 20'C/s with a 15x1 5 mm
surface area.
A patent search of haptic thermal display technology identified two corporate ventures,
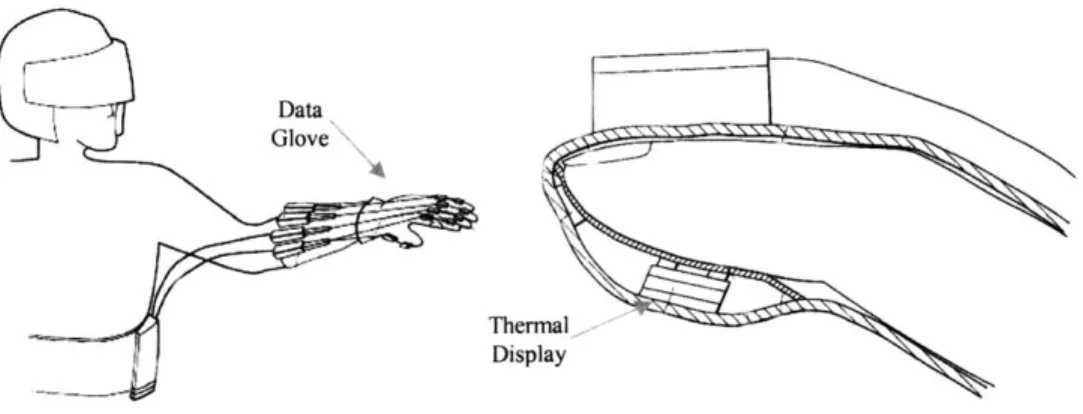
one sponsored by Fanuc America, and the other by Mitsubishi, as well as an individual application. Fanuc submitted patent requests in 1997 for a remote controlled master-slave robot system composed of an exoskeleton, video console and user glove. The thermal display, which consists of a Peltier device, heater and temperature sensor, is adapted to Virtual Technology's Dataglove as shown in Figure 10. At least one prototype was developed, but the project was abandoned by the company in 2000.
Data
Glove- -
-Thermal
4 Display
Figure 10. Dataglove and retrofitted thermal display, Fanuc America. Thermal display includes sensor closest to skin, followed by heater, thermoelectric cooler and vibrator (Yee, 2000). The Mitsubishi application discusses general concepts of a medical simulator providing various types of sensor feedback and refers to a thermal display associated with another haptic device. The independent application submitted by Lander & Haberman (1999) introduces an internet based multi-user haptic interface. Hand position is tracked in order to simulate interactions between two individuals located in different places. Neither of these two concepts produced a thermal display. Finally, an unpatented Displaced Temperature Sensing System was developed by CS Research, and consisted of an eight thermode display with a thin film RTD sensor and thermoelectric heat pump. This device was unsuccessful in the original equipment manufacturer market (OEM).
The Phantom (SensAble Technologies), a 6 degree of freedom force-reflecting interface with position tracking (shown in Figure 11), is one of a number of commercially
successful haptic devices embraced by the haptic and VE communities (Salisbury & Srinivasan, 1997). In 1997, Ottensmeyer appended the Thermostylus (Ottensmeyer & Salisbury, 1997) to the Phantom platform. The thermal interface is a Peltier device covered by an aluminum plate. The index finger makes contact with the temperature display by holding the Thermostylus in a three jaw chuck configuration where the thumb is in opposition to the index and middle fingers. Heating and cooling rates of 11 0C/s and
4.50C/s respectively are achieved with a water based heat sink, proportional integrated
(PI) control, and 0.1 Hz system bandwidth. Ottensmeyer combines force feedback with the thermal display to simulate palpation of a feverish patient, dragging a probe through a viscous fluid, feeling the heat at the interior of the sun and experiencing gravitational forces.
Figure 11. Phantom (SensAble Technologies, MA).
Another invention, "the haptic doorknob" from Interval Research, illustrated in Figure 12, features torque, haptic, auditory and thermal displays (MacLean & Roderick, 1999). The designers aspired to convey clues about the space beyond the door such as the mood or number and type of people inside. A Peltier device is embedded in the mechanical portion of the doorknob while the stationary aluminum back doubles as a heat sink. The
display outputs approximately 10*C above and below ambient temperature in 30 s peak to peak. The real time system architecture updates torque at 1 kHz, auditory output at 88 Hz, and proportional integrated derivative (PID) control of the thermal display at 20 Hz.
Figure 12. Haptic doorknob (Interval Research, CA).
There are several research groups working on thermal displays: Caldwell in England
(1993, 1996), Bergamasco in Italy (1994, 1997), Ino in Japan (1993) and Dionisio in
Germany (1997). Dionisio (1997) emphasizes global integration of all heat transfer modalities. He introduced the ThermoPad, a thermal kit for graphics-based virtual reality
applications, that can be used in conjunction with force-feedback devices. As the user walks through a computer based virtual reality scenario, the hardware delivers
corresponding conductive (Peltier), convective (fan) and radiative (IR lamp) heat
(Dionisio et al., 1997). The ThermoPad can be integrated with other hardware (Phantom) to simulate collision detection and grasping for arthroscopy training.
Bergamasco et al. (1994) investigated dextrous manipulation and exploration for both virtual environment and teleoperation applications using a 7-degree-of-freedom
exoskeleton. His prototype integrates thermal feedback and indentation stimulation using Peltier devices and air pressure. He presents several theoretical finger-object thermal models including a full description of finger-Peltier interaction, and describes PID control
for the Peltier device.
Caldwell et al. (1993, 1996) built a teleoperated robot hand as part of a master-slave system from PVC bones, Kevlar tendons and pneumatic muscle actuators with three fingers and a thumb. The robot's sensors evaluate dynamic slip, texture, pressure, shape, hardness, and temperature. Tactile feedback is channeled back to the user through a
glove outfitted with various transducers and Hall-effect position sensors. The thermal display, positioned on the dorsal side of the first proximal phalanx of the index finger, includes an aluminum plate heat sink and a thermocouple in contact with the skin and Peltier device. A 16 channel A/D converter with 12 bit resolution scans both components at 5 kHz (Caldwell & Gosney, 1993).
Ino et al. (1993) have also studied thermal transients targeted for master-slave robotic systems and virtual reality applications. They conducted psychophysical testing to understand how to present the quality of different materials using thermal feedback. Finger contact with aluminum, rubber and wood samples at room temperature showed decreases in skin temperature of 6.9*C, 2.6'C and 1.7*C respectively. These data were used to simulate the three materials with the Peltier device. Presentation of two
simulated aluminum samples was correctly identified 100%, whereas presentation of polyacrylate and glass were successfully identified only 6% of the time.
8. Preliminary testing
The objective of the current research was to create a structurally flexible,
servo-controlled, thermally conductive display that could be used for psychophysical testing. An integrated heater and temperature sensor attached to thin-walled plastic tubing replaces the traditional Peltier designs. System response speed comes from 16 bit A/D
and D/A conversion, along with electronic components. Initially, various temperature sensors were evaluated in terms of performance. A Peltier-based system was then designed and built to determine the appropriate size and distribution of thermal elements in a display that was to be used with the hand. Finally, a series of experiments were conducted to determine the physiological and psychophysical responses to thermal stimuli and materials with varying thermal conductivity.
8.1. Sensor selection
Criteria for selecting a temperature sensor included geometry, robustness and
performance. A custom manufactured thin film RTD (JP Technologies, NC) a J-type thermocouple (iron-constantan, accuracy ± 1.2-2.2'C), and a standard Omega thin film RTD (F3105) represent small, inexpensive temperature sensors that function over a range of 0-1000C. These three sensors were fixed to a Melcor Peltier device (DT 6-6) which
was in turn mounted with thermal grease (Omegatherm 201) to a fluid cooled (30% ethylene glycol, 70% water) heat sink (VWR Recirculating Chiller). The temperature of the Peltier device was manually controlled with a DC Power Supply (Hewlett Packard,
E3632A). A Visual Basic program commanded the data acquisition unit (Agilent 34970A), and sampled the sensors at 4 Hz.
Thermocouple leads were connected directly to the high/low terminals of the data acquisition module, whereas the RTDs were connected in a four-wire configuration (Figure 13). A large supply current which passed through the RTDs induced superfluous current from lead resistance. By sampling the voltage with leads separate from the current carrying wires, measurement accuracy was improved.
L7
1,
L3
Figure 13. Honeywell Microswitch 4-wire setup (Honeywell, 1998).
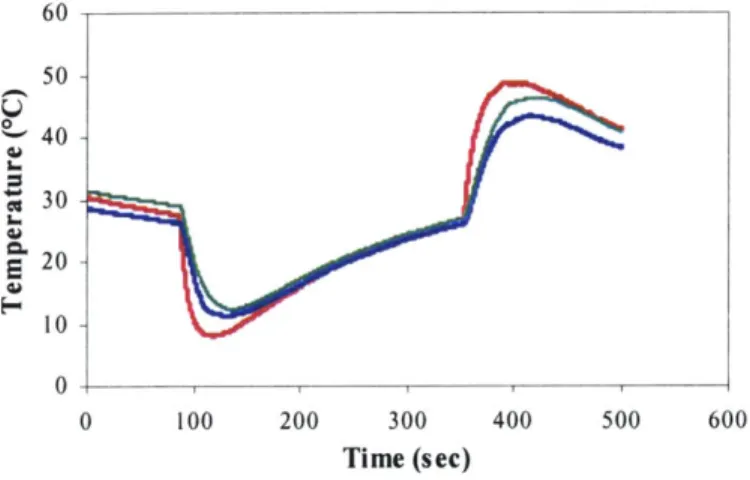
The three sensors were initially at room temperature (30*C) and responded similarly to the changes in temperature generated by the Peltier device. A series of 10 trials were repeated with different input voltage steps in the range of 0-7 V to heat and cool the Peltier device. Figure 14 shows an example of one of these trials in which the Peltier device charged to 5 V after 100 s, and returned to null voltage after 350 s. The JP Technologies RTD responded most sensitively to temperature fluctuations as shown by the peaks and troughs in Figure 14. This was presumably due to its lower thermal inertia.
This response profile made it the sensor of choice. 60 50 40-20 10-0 0 100 200 300 400 500 600 Time (sec)
Figure 14. Sensor comparison; Red is JP Technologies RTD, blue is thermocouple and green is Omega RTD.
8.2. JP Technologies thin film RTD
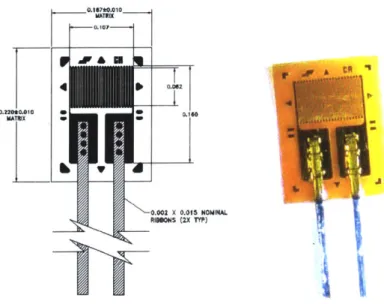
The JP Technologies custom-made platinum serpentine resistor is 4.2 mm x 5.6 mm x 5 tim thick, emulating a typical strain gauge design (Figure 15). The polyimide exterior with the following thermal properties: 0.121 W/m0C in conductivity, 1090 J/kg0C in heat
capacity and 400'C melting point, encapsulates the pure platinum characterized by 69.1
W/m*C in conductivity, 1340 J/ kg*C in heat capacity and 17690C melting point. A
summation of the 25 jim wide trace, scanned with magnifying lenses and a video camera (Sony 1394), reveals a conductor surface area of 2.6 mM2
(Figure 16). The fragile platinum ribbon leads have recently been replaced with more durable 36 gage wire.
0.107to.010 r0210
0.220*0.010 * D
0.001 X 0.015 NOMINAL
Figure 15. JP Technologies Thin Film Resistor (JP Technologies, 2001).
Figure 16. Serpentine resistor of RTD.
The platinum current density is approximately 107 A/m2, and like all conductors, it self-heats in response to a supply current. The 100 1 ice point RTD is specified for
maximum operation at 5 V, which translates into 0.050 A.
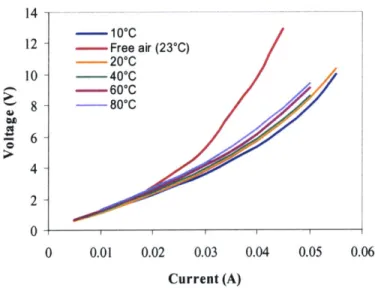
In order to understand better RTD self heating, a series of experiments analyzed the RTD response to a current input. Current was delivered to the RTD and the corresponding voltage from the power supply was recorded using the same leads. Current was
controlled manually, increasing in steps of 5 mA. During the first trial, the RTD was suspended in free air, exposed only to natural convective cooling. For the remaining five trials, the RTD was glued to a heat sink with temperatures ranging from 10-80'C. The heat sink was made of plastic tubing with water flowing through it. The effect of the water's large heat capacity in comparison to the cooling effects of free flowing air is evident in the data shown in Figure 17. The varying heat sink temperatures had a greater impact at higher input currents. At 50 mA, there was a 1.7 V difference in RTD output between a 10*C and an 80'C heat sink. At 0.040 A, the polyamide began to burn into a white ash which radiated outward with increasing current.
14 - - -12 - - Free air (23C) -- 20*C 10 - 400 C -60 0 C 8 -- 80C -6 4 2 0 4 0 0.01 0.02 0.03 0.04 0.05 0.06 Current (A)
Figure 17. RTD response to water circulating through a thin-walled vessel.
8.3. Hot and cold transients
The next series of experiments was concerned with quantifying the response of the pad of the index finger to hot and cold temperature transients. The first set of experiments measured the finger temperature as it contacted a thin-walled tube streaming with water.
In the second set of experiments, finger temperature was measured as the finger made contact with forty different materials with varying thermal conductivity.
8.3.1. Thermal transients via water
Fixture one was built to examine a finger's response to hot and cold constant
temperatures. It was an open-ended hollow cavity, which minimized convective effects, and was equipped with a 4 mm diameter tube through which water was constantly
flowing (Figure 18). The RTD was bonded to the external contour of the tube. The finger was not in contact with the tube for the first 10 s of the trial. The subject then placed her finger on top of the sensor and the hand remained immobile for the completion of the trial which lasted 500 s.
Figure 18. Fixture one.
A Visual Basic program (Appendix A) controlled the data acquisition and chiller as
previously described, and temperature was sampled at approximately 1 Hz. Ambient temperature was measured with an RTD suspended in air (24*C) and initial skin temperature was taken with an RTD held between two fingers (31.6'C). A hot (43*C) temperature was delivered by the recirculating chiller using a PID controller. The actual temperature at the fingertip was measured with the RTD attached to the tube.
Figure 19 illustrates the change in RTD temperature as the finger approaches the tube (the vertical portion), makes contact with the tube (the spike), and then remains stationary on the surface. Finger temperature converges to fluid temperature in approximately 500 s. These data are similar to Bergamasco et al.'s (1997) model generated using Equation
46 -C 42 0 1 38 34 -30 0 200 400 600 Time (sec)
Figure 19. Time response of index finger to heat.
A second experiment involving Fixture one analyzed finger thermal responses to 12
intermittent temperature input steps to a temperature of 45*C. The subject made contact with the tube for 20 s, removed her hand, suspended it in air, and then replaced it on the tube 20 s later. The trend line as seen in Figure 20, stabilized after 250 s of contact. This
setup did not control for the contact location nor for the surface area between the finger and sensor with repeated trials.
50- 46- 42- 38-E- 3430 -0 100 200 300 400 500 Time (sec)
Figure 20. Time response of index finger to 20 s interval heat input steps.
8.3.2. Material induced transients
Fixture two was designed to control finger repositioning and contact pressure, and tested the finger's thermal response to a range of 40 materials at ambient temperature. The
fixture layout included a vacuum formed plastic mold of a finger that was screwed into a delrin base (Figure 21). The mold, pulled over an epoxy coated plaster cast, was
originally made by immersing the hand in Earthium (MSW Creative, NV), a biofriendly silicone-like medium. The base contained a 12.5 mm diameter slot into which 12.4 mm diameter material samples could be inserted and exchanged during testing. The samples were turned from 12.7 mm (% inch) rod stock, milled and sanded to provide a flat,
smooth contact surface with minimal textural cues. The sensor used for measuring finger pad temperature was offset laterally to enable direct material contact and was affixed
with a biocompatible cyanoacrylate (Dermabond, Closure Medical). A second sensor was fastened to the material sample with 25 lim double-sided tape (Medical grade 1512, 3M) and monitored its temperature.
Figure 21. Test fixture two (left) and example of material samples (right).
Three female subjects between the ages of 24 and 27 participated in this experiment. Each signed a consent form. An RTD was glued to the side of the index finger. Initial
skin (finger) temperatures ranged from 20-30*C and ambient temperature was 24*C ± 2 as measured with an RTD in free air. The subjects were instructed to insert their fingers into the plastic finger mold for 2-3 s. The finger then stayed in contact with the material for the remainder of the 12 s trial. The data were sampled at approximately 30 Hz. This arrangement was repeated once for all 40 material samples, with 30 s breaks between trials. The experiment lasted approximately 60 minutes.
Figure 22 illustrates the initial finger temperature and response to contact with naval brass, PVC and stainless steel for the three subjects. The initial skin temperature of each
detected upon contact. There was no consistent change in temperature associated with a specific material. Average skin temperature for Subject 1 was 21.5*C which increased 0.70C upon contact. At 2 seconds after contact, the temperature of Subject 2 increased on average 0.4-0.6*C above its initial range of 25-31 C. Initial skin temperature of Subject
3 averaged 28*C, varied 5.54C during testing and changed 0.1 C upon contact.
0 2 4 6 8 10 Time (sec) Subject 3
1
0 2 4 6 Time (sec) 8 10Figure 22. Finger temperature results for three different subjects contacting naval brass (blue), stainless steel (red) and PVC (green) in top left and right, and bottom left;
0.50C scaled response for subject 2 to HDPE in bottom right.
The thermal response of the finger to contact with the 3 materials was fairly consistent for the same subject but varied between subjects. This may be due to differences in the initial skin temperatures and the varying ways in which the subject made contact with the material.
In the lower right graph of Figure 22, the temperature scale is reduced from 10*C to
0.5'C. This shows the 0.30C increase in the finger temperature of Subject 2 upon contact
40 *LE0 Subject 1 28 26 24 22 20 18 Subject 2 32 30 28 26 2 24-22 0 2 4 6 Time (sec) 8 10 32 30 28 u 26 0. 2 E 24 22 a. 0. 2 23.5 23.4 23.3 23.2 23.1 23 0 2 4 6 Time (sec) 8 8 10
-__________________________________________________________________________ JJ Ii"'* ''~J~IinIUWL[
with the material at an initial skin temperature of 23.1 4C. The skin temperature initially overshoots and settles to a temperature of 23.3*C approximately 3 s after contact. The initial peak of skin temperature may be explained by the increased pressure inside the mold as the finger approaches the material, similar to a piston compressing air in a closed cavity.
A steady decrease in skin temperature occurred in all three subjects throughout the one
hour testing period, independent of material contact. This was attributed to a lack of finger motion after attachment of the sensor. An additional experiment was therefore conducted in which the hand was rewarmed to 30'C prior to each trial by placing it on the recirculating chiller for several minutes. This experiment followed the procedure described above, although only seven material samples were presented to a single subject. The results from this experiment are shown in Figure 23. All seven temperature curves follow the same profile, peaking at full finger contact, followed by a decrease in skin temperature to below 30'C. The final steady state temperature is a function of ambient and normal skin temperature. Finger contact with metals resulted in a larger temperature increase than for insulators, but no specific correlation was observed for final steady state temperatures.
31 - - -
-30.8 - Aluminum - Naval Brass
A luminum Bronze Nickel
30.6 - Stainless Steel -PBT Polyester
-- Linen 30.4 30.2 30 -29.8 29.6 -29.4 29.2 -29 0 2 4 6 8 10 12 Time (sec)
Figure 23. Finger temperature results for hand rewarmed to 30*C prior to contact with each of seven materials.
8.3.3. Force sensors integrated with thermal testing
A force sensor was added to the test fixture to identify the point of finger contact with the
material and to help explain unexpected changes in finger temperature. Miniature force sensitive resistors such as the FSR (Interlink electronics, CA) and FlexiForce (Tekscan, MA) have been easily used in haptic displays (Caldwell et al., 1996; Monkman & Taylor,
1993). They operate in low force ranges (0-2 N) in which resistance decreases with
force. These pressure sensitive transducers achieve equilibrium after 30 s and so are recommended for use in threshold or switch applications.
Load cells, albeit cumbersome and more costly, are a better option for accurate real time force measurement. An Omega load cell with an operating range of 0-9.8 N was
positioned under Fixture two so that the forces transmitted by the finger through the material sample could be measured by the load cell below. The load cell was connected to the Agilent Data Acquisition Unit and controlled using a Visual Basic program similar to the one used to measure temperature (Appendix A).
In an effort to minimize noise, a signal conditioning amplifier (Measurement Group, NC) was added to the setup. Comparison of the constant force response with and without the signal conditioning amplifier (SCA) confirmed that it was useful for voltage gains up to one order of magnitude (Figure 24).
0.002 --0.001 0 -0.001 -0.002 0 10 20 30 40 Time (sec)
Figure 24. Force measurements with a unity gain signal conditioning amplifier (blue) and reading directly into the acquisition system (red).
Larger gains, however, amplified the noise to that produced without the SCA. Figure 25
displays the force-voltage relation measured using calibrated weights from 0-1 kg. The sensor can be used in the linear zone by preloading to 25% of its full range.
0.008 --- -- 250 - -0.006 y = 0.0007x - 6E-05 > 200 0.006 -150 0.004 100 > 0.002 50 -0 0 0 2 4 6 8 10 0 500 1000 Force (N) Mass (g)
Figure 25. Calibration for force sensor (left) and accuracy of the value with varying mass (right). Several material contact experiments as described above were repeated with the force sensor now recording the forces generated by subjects as they made contact with the material. The force data facilitated identification of contact time and the average force measurements matched previously reported values of 0-2 N (Caldwell et al., 1996; Ino et al., 1993; Pawluk & Howe, 1999; Westling & Johansson, 1987).
8.4. Peltier prototype
This prototype was designed as a portable interactive display to determine the number and size of individual thermal units required for a display. The user interface comprised a concave mold of the human hand with eight Peltier devices inserted at five digit and three palmar locations (Figure 26).
The plastic thermoform was pulled over a detailed mold of the hand as described in section 8.3.2. The miniature Peltier device (MIl01T, Marlow) contained 2 negative and positive doped semiconductor pairs as shown in Figure 27. The performance of these devices is illustrated in Figure 28.
Figure 27. Peltier device (Marlow, TX).
Hot Side Temperature: 27*C
80.0 60.0 .U 40.0 20.0 0.0 -0.8 0.6 0.4 - -0.2 0.0 0.0 0.2 0.4 0.6 0.8 1.0 CURRENT (AMPS) 1.: HEAT LOAD (WATTS) 0.00 0.05 0.10 0.15 0.20 0.25 0.30 0.35 0.40 0.45 w CD I--J 0 T=0 2 80.0 60.0 40.0 20.0 0.0 0.8 0.6 0.4 0.2 0.0 0
Hot Side Temperature: 500C
.0 0.2 0.4 HEAT LOAD (WATTS) 0.00 0.05 0.10 0.15 0.20 0.25 0.30 0.35 0.40 0.45 Q=0 A T=0 0.6 0.8 1.0 1.2 CURRENT (AMPS)
Figure 28. Performance characteristics of specific peltier device (Marlow, TX).
44 0 w CD I--J 0 ... ..