HAL Id: hal-00303952
https://hal.archives-ouvertes.fr/hal-00303952
Submitted on 5 Oct 2006HAL is a multi-disciplinary open access
archive for the deposit and dissemination of sci-entific research documents, whether they are pub-lished or not. The documents may come from teaching and research institutions in France or abroad, or from public or private research centers.
L’archive ouverte pluridisciplinaire HAL, est destinée au dépôt et à la diffusion de documents scientifiques de niveau recherche, publiés ou non, émanant des établissements d’enseignement et de recherche français ou étrangers, des laboratoires publics ou privés.
Validation of MIPAS ClONO2 measurements
M. Höpfner, T. von Clarmann, H. Fischer, B. Funke, N. Glatthor, U.
Grabowski, S. Kellmann, M. Kiefer, A. Linden, M. Milz, et al.
To cite this version:
M. Höpfner, T. von Clarmann, H. Fischer, B. Funke, N. Glatthor, et al.. Validation of MIPAS ClONO2 measurements. Atmospheric Chemistry and Physics Discussions, European Geosciences Union, 2006, 6 (5), pp.9765-9821. �hal-00303952�
ACPD
6, 9765–9821, 2006 MIPAS ClONO2 validation M. H ¨opfner et al. Title Page Abstract Introduction Conclusions References Tables Figures J I J I Back Close Full Screen / EscPrinter-friendly Version Interactive Discussion
EGU
Atmos. Chem. Phys. Discuss., 6, 9765–9821, 2006 www.atmos-chem-phys-discuss.net/6/9765/2006/ © Author(s) 2006. This work is licensed
under a Creative Commons License.
Atmospheric Chemistry and Physics Discussions
Validation of MIPAS ClONO
2
measurements
M. H ¨opfner1, T. von Clarmann1, H. Fischer1, B. Funke2, N. Glatthor1, U. Grabowski1, S. Kellmann1, M. Kiefer1, A. Linden1, M. Milz1, T. Steck1, G. P. Stiller1, P. Bernath3, C. E. Blom1, Th. Blumenstock1, C. Boone3, K. Chance4, M. T. Coffey5, F. Friedl-Vallon1, D. Griffith6, J. W. Hannigan5,
F. Hase1, N. Jones6, K. W. Jucks7, C. Keim1, A. Kleinert1, W. Kouker1, G. Y. Liu1, E. Mahieu8, J. Mellqvist9, S. Mikuteit1, J. Notholt10, H. Oelhaf1, C. Piesch1, T. Reddmann1, R. Ruhnke1, M. Schneider1, A. Strandberg9, G. Toon11, K. A. Walker3, T. Warneke10, G. Wetzel1, S. Wood12, and R. Zander8
1
Institut f ¨ur Meteorologie und Klimaforschung, Forschungszentrum Karlsruhe, Germany
2
Instituto de Astrof´ısica de Andaluc´ıa, Granada, Spain
3
Department of Chemistry, University of Waterloo, Ontario, Canada
4
Harvard-Smithsonian Center for Astrophysics, Atomic and Molecular Physics Division, Cambridge, MA, USA
5
Atmospheric Chemistry Division, National Center for Atmospheric Research, Boulder, CO, USA
6
ACPD
6, 9765–9821, 2006 MIPAS ClONO2 validation M. H ¨opfner et al. Title Page Abstract Introduction Conclusions References Tables Figures J I J I Back Close Full Screen / EscPrinter-friendly Version Interactive Discussion
EGU
7
Harvard-Smithsonian Center for Astrophysics, Optical and Infrared Astronomy Division, Cam-bridge, MA, USA
8
Institut d’Astrophysique et de G ´eophysique, Universit ´e de Li `ege, Belgium
9
Department of Radio and Space Science, Chalmers University of Technology, G ¨oteborg, Swe-den
10
Institut f ¨ur Umweltphysik, Universit ¨at Bremen, Germany
11
Jet Propulsion Laboratory, California Institute of Technology, Pasadena, CA, USA
12
National Institute of Water and Atmospheric Research, Lauder, New-Zealand
Received: 8 August 2006 – Accepted: 15 September 2006 – Published: 5 October 2006 Correspondence to: M. H ¨opfner ([email protected])
ACPD
6, 9765–9821, 2006 MIPAS ClONO2 validation M. H ¨opfner et al. Title Page Abstract Introduction Conclusions References Tables Figures J I J I Back Close Full Screen / EscPrinter-friendly Version Interactive Discussion
EGU Abstract
Altitude profiles of ClONO2 retrieved with the IMK (Institut f ¨ur Meteorologie und Kli-maforschung) science-oriented data processor from MIPAS/Envisat (Michelson Inter-ferometer for Passive Atmospheric Sounding on Envisat) mid-infrared limb emission measurements between July 2002 and March 2004 have been validated by comparison
5
with balloon-borne (Mark IV, FIRS2, MIPAS-B), airborne (MIPAS-STR), ground-based (Spitsbergen, Thule, Kiruna, Harestua, Jungfraujoch, Iza ˜na, Wollongong, Lauder), and spaceborne (ACE-FTS) observations. With few exceptions we found very good agree-ment between these instruagree-ments and MIPAS with no evidence for any bias in most cases and altitude regions. For balloon-borne measurements typical absolute mean
10
differences are below 0.05 ppbv over the whole altitude range from 10 to 39 km. In case of ACE-FTS observations mean differences are below 0.03 ppbv for observations below 26 km. Above this altitude the comparison with ACE-FTS is affected by the pho-tochemically induced diurnal variation of ClONO2. Correction for this by use of a chem-ical transport model led to an overcompensation of the photochemchem-ical effect by up to
15
0.1 ppbv at altitudes of 30–35 km in case of MIPAS-ACE-FTS comparisons while for the balloon-borne observations no such inconsistency has been detected. The compari-son of MIPAS derived total column amounts with ground-based observations revealed no significant bias in the MIPAS data. Mean differences between MIPAS and FTIR col-umn abundances are 0.11±0.12×1014cm−2 (1.0±1.1%) and −0.09±0.19×1014cm−2
20
(−0.8±1.7%), depending on the coincidence criterion applied. χ2 tests have been performed to assess the combined precision estimates of MIPAS and the related in-struments. When no exact coincidences were available as in case of MIPAS – FTIR or MIPAS – ACE-FTS comparisons it has been necessary to take into consideration a coincidence error term to account for χ2 deviations. From the resulting χ2 profiles
25
there is no evidence for a systematic over/underestimation of the MIPAS random error analysis.
ACPD
6, 9765–9821, 2006 MIPAS ClONO2 validation M. H ¨opfner et al. Title Page Abstract Introduction Conclusions References Tables Figures J I J I Back Close Full Screen / EscPrinter-friendly Version Interactive Discussion
EGU 1 Introduction
Chlorine nitrate (ClONO2) is a major temporary reservoir gas of chlorine in the strato-sphere. It plays an important role in the processes of ozone depletion (Solomon,1999). Though ClONO2has recently been observed by in-situ methods (Stimpfle et al.,1999;
Marcy et al.,2005), by far most measurements have been made remotely by analysis of
5
its rovibrational bands in the mid-infrared atmospheric window through high-resolution spectroscopy.
Stratospheric ClONO2was first detected by solar absorption spectroscopy from bal-loons (Murcray et al.,1979;Rinsland et al.,1985) and from space (Zander et al.,1986) by the Atmospheric Trace Molecule Spectroscopy (ATMOS) instrument. ATMOS also
10
provided spaceborne measurements of ClONO2 profiles in March 1992, April 1993 and November 1994 (Rinsland et al.,1994,1995,1996;Zander et al.,1996). Column amounts from ground-based solar absorption observations have been first reported by
Zander and Demoulin(1988) over the Jungfraujoch and byFarmer et al. (1987) over McMurdo.
15
Early sun-independent determination of ClONO2 through mid-IR thermal emission spectroscopy are balloon-borne measurements by the Michelson Interferometer for Passive Atmospheric Sounding (MIPAS-B) (von Clarmann et al., 1993; Oelhaf et al.,
1994), airborne observation by MIPAS-FT (Blom et al., 1995), and spaceborne data by the Cryogenic Limb Array Etalon Spectrometer (CLAES) (Roche et al.,1993,1994).
20
CLAES obtained nearly global fields of ClONO2from 25 October 1991 until 5 May 1993 which have been validated byMergenthaler et al.(1996).
In this paper we report on the validation of atmospheric ClONO2 profiles derived from MIPAS observations made on board the polar orbiting satellite Envisat between mid-2002 and end of March 2004.
ACPD
6, 9765–9821, 2006 MIPAS ClONO2 validation M. H ¨opfner et al. Title Page Abstract Introduction Conclusions References Tables Figures J I J I Back Close Full Screen / EscPrinter-friendly Version Interactive Discussion
EGU 2 MIPAS ClONO2data analysis
MIPAS is a Fourier transform spectrometer sounding the thermal emission of the earth’s atmosphere between 685 and 2410 cm−1(14.6–4.15 µm) in limb geometry. The maximum optical path difference (OPD) of MIPAS is 20 cm. For the present data anal-ysis the spectra have been apodised with the Norton-Beer strong function (Norton and
5
Beer,1976) resulting in an apodised spectral resolution (FWHM) of 0.048 cm−1. The field-of-view of the instrument at the tangent points is about 3 km in the vertical and 30 km in the horizontal. In the standard observation mode in one limb-scan 17 tangent points are observed with nominal altitudes 6, 9, 12,..., 39, 42, 47, 52, 60, and 68 km. In this mode about 73 limb scans are recorded per orbit with 14.3 orbits per day. The
10
measurements of each orbit cover nearly the complete latitude range from about 87◦S to 89◦N. In the described standard mode MIPAS measured quasi-continuously from July 2002 until end of March 2004 when operation was stopped for investigation of instabilities of the interferometer drive velocity. Measurements have been resumed in early 2005, however, with poorer spectral resolution and finer tangent altitude grid.
15
Here we concentrate on the validation of ClONO2 profiles derived from the first measurement period. ClONO2 is one of the trace-gases retrieved at the Institut f ¨ur Meteorologie und Klimaforschung, Forschungszentrum Karlsruhe (IMK) as an off-line product and is available at http://www-imk.fzk.de/asf/ame/envisat-data/. ClONO2 is not included in the operational level 2 data analysis under ESA responsibility. The
20
present validation work is performed with IMK data versions V3O CLONO2 10 and V3O CLONO2 11 which are consistent. These retrievals are based on reprocessed ESA level 1b products (calibrated spectra) Version 4.61 and 4.62.
The data processing chain for ClONO2 has been described in detail by H ¨opfner
et al. (2004). The IMK version of the data discussed there was V1 CLONO2 1 which
25
differs from the version V3O CLONO2 10/11 in several aspects: (1) near-real-time ESA level 1b data version 4.53 was used then, (2) latitude-band dependent a-priori profiles were assumed while for V3O CLONO2 10/11 flat zero a-priori profiles are used, and
ACPD
6, 9765–9821, 2006 MIPAS ClONO2 validation M. H ¨opfner et al. Title Page Abstract Introduction Conclusions References Tables Figures J I J I Back Close Full Screen / EscPrinter-friendly Version Interactive Discussion
EGU
(3) the height-dependent regularization strength has been changed to allow for more sensitivity at lower and higher altitudes.
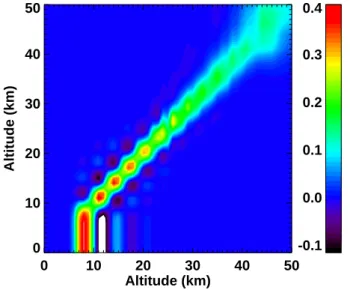
For characterisation of the altitude resolution of a typical ClONO2profile of the data version used in this paper, Fig.1shows as an example the averaging kernel matrixA of
a mid-latitude MIPAS measurement. This observation is validated against a MIPAS-B
5
observation below in Sect.3.1.1. The rows ofA represent the contributions of the real
profile to the retrieved profile whereas the columns are the response of the retrieval scheme to a delta function in the related altitude (Rodgers, 2000). The full width at half maximum of the columns ofA can be used as a measure for the vertical
resolu-tion which ranges from 3.2 to 8.5 km in the altitude region 8 to 40 km for our ClONO2
10
retrievals.
The linear error analysis of the previous example from mid-latitudes is given in Ta-ble1. It shows that the main error sources are the spectral noise of the instrument and the uncertainty of spectroscopic data. This is consistent with the error estimation of a polar profile discussed inH ¨opfner et al. (2004). For the comparisons with other
15
measurements we use the total estimated random error which we define as the total error given in Table1without the error due non-local thermodynamic equilibrium (non-LTE), which is anyway negligible, and due to spectroscopy. The spectroscopic error is neglected since most experiments use the same spectroscopic dataset byWagner and
Birk (2003) as will be described below.
20
3 Comparison with balloon- and airborne measurements: MIPAS-B, Mark IV,
FIRS, MIPAS-STR
In this chapter we discuss the comparison of single MIPAS ClONO2 altitude profiles with collocated ones obtained during field campaigns of one aircraft- and various balloon-borne instruments.
25
For the comparison, the correlative ClONO2 profiles xref, which, in general, have a better altitude resolution than MIPAS, are adjusted by application of the MIPAS
aver-ACPD
6, 9765–9821, 2006 MIPAS ClONO2 validation M. H ¨opfner et al. Title Page Abstract Introduction Conclusions References Tables Figures J I J I Back Close Full Screen / EscPrinter-friendly Version Interactive Discussion
EGU
aging kernelAMIPAS. Since the a-priori profile of MIPAS retrievals xa,MIPASis zero at all altitudes, Eq. (4) of Rodgers and Connor (2003) ˜xref=xa,MIPAS+AMIPAS(xref−xa,MIPAS) simplifies to
˜
xref= AMIPASxref. (1)
Here we assume that the content of the a-priori information in the better resolved
cor-5
relative profiles is negligibly small (von Clarmann and Grabowski,2006).
As some of the correlative measurements were not obtained during dedicated valida-tion campaigns with exact matches in time and space we have performed a correcvalida-tion for the profile coincidence error by use of the KASIMA (Karlsruhe Simulation model of the Middle Atmosphere) CTM (Chemical Transport Model) (Kouker et al.,1999). From
10
a multi-annual run with a horizontal resolution of approximately 2.6 × 2.6◦(T42), a ver-tical resolution of 0.75 km from 7 to 22 km and an exponential increase above with a resolution of about 2 km in the upper stratosphere, and a model time step of 6 min ClONO2 profiles were interpolated to the time and position of the measurements of the correlative instruments and of MIPAS: xCTMref and xCTMMIPAS. For the intercomparison,
15
the original MIPAS profiles xMIPAS were transformed to the time and position of the correlative measurements by adding the difference between the two model results:
xtransMIPAS= xMIPAS+ xCTMref − xCTM
MIPAS. (2)
The difference profiles xMIPAS− ˜xref and xtransMIPAS− ˜xref are analysed with regard to sys-tematic altitude dependent biases and the validity of the combined estimated errors.
20
Below, each instrument (see Table2for an overview) and the results of single mea-surement campaigns will be described in detail. This is followed by a summary of the mean difference profiles per instrument.
3.1 MIPAS-B
MIPAS-B (Table2) is a balloon-borne limb emission sounder with a similar spectral
cov-25
bet-ACPD
6, 9765–9821, 2006 MIPAS ClONO2 validation M. H ¨opfner et al. Title Page Abstract Introduction Conclusions References Tables Figures J I J I Back Close Full Screen / EscPrinter-friendly Version Interactive Discussion
EGU
ter vertical resolution (2–3 km below the flight level) compared to MIPAS (Friedl-Vallon
et al.,2004). The retrieval of ClONO2vertical profiles from MIPAS-B calibrated spectra is performed with an inversion code based on the same line-by-line radiative transfer model, (KOPRA, Karlsruhe Optimized and Precise Radiative transfer Algorithm,Stiller,
2000) as used in case of MIPAS data evaluation. For inversion of ClONO2profiles an
5
equivalent scheme as for MIPAS/Envisat with height-constant zero a-priori profile and the same spectroscopic database has been applied (Wetzel et al.,2006;H ¨opfner et al.,
2004).
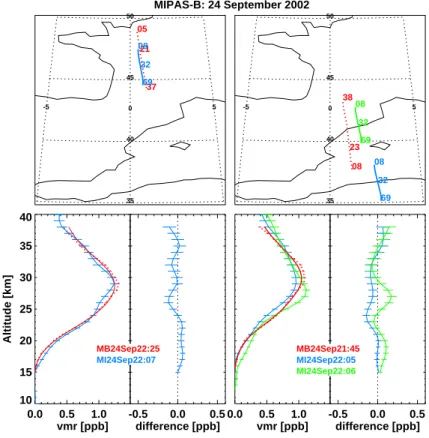
3.1.1 MIPAS-B: 24 September 2002
During the night 24–25 September 2002 a MIPAS-B balloon flight took place from Aire
10
sur l’Adour in southern France (Oelhaf et al., 2003). This flight was part of the En-visat validation activities and perfectly coincident in time and location to MIPAS mea-surements of Envisat orbit 2975. Table3 and Fig. 2show that the northward-looking MIPAS-B limb scan matches nearly perfectly with the MIPAS profile at 22:07 UT. The southward-looking balloon profile coincides not as perfectly as the northward-looking
15
one with two MIPAS scans: the MIPAS limb-scan at 22:05 is closer below about 24 km altitude while 22:06 is closer above. The bottom panels of Fig.2 show the compari-son of the MIPAS-B and MIPAS profiles. For MIPAS-B, both, the original profile and the profile smoothed with the MIPAS averaging kernel are given. The comparison of MIPAS with the northward-looking MIPAS-B measurement gives the best agreement
20
with maximum differences of 0.12 ppbv at 26 km altitude where MIPAS ClONO2 val-ues are smaller than those of MIPAS-B by about twice the estimated combined total errors. With smaller exceptions at 18 km and at 38 km, the differences are within the estimated error bars. The southern profile of MIPAS-B is within the combined estimated error bounds of either MIPAS scan 22:05 or scan 22:06 almost over the whole altitude
25
region. Only at around 27 km there exist slightly larger absolute differences. At these altitudes the vmr values of MIPAS-B are between those of the two MIPAS limb-scans 22:05 and 22:06.
ACPD
6, 9765–9821, 2006 MIPAS ClONO2 validation M. H ¨opfner et al. Title Page Abstract Introduction Conclusions References Tables Figures J I J I Back Close Full Screen / EscPrinter-friendly Version Interactive Discussion
EGU
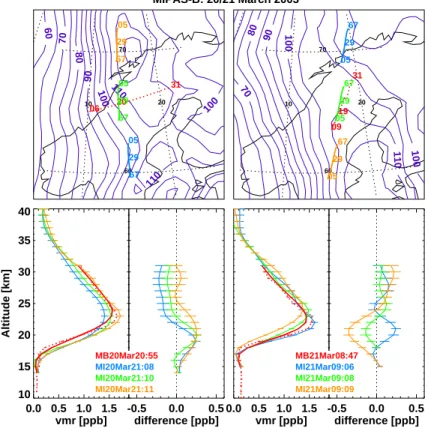
3.1.2 MIPAS-B: 20/21 March 2003
A further dedicated Envisat validation campaign with MIPAS-B took place above north-ern Scandinavia on 20/21 March 2003. In the evening of 20 March a coincidence with Envisat orbit 5508 and in the morning of 21 March with orbit 5515 was achieved. MIPAS and MIPAS-B tangent points at and above about 23 km (550 K potential temperature)
5
are located inside the polar vortex while at and below 20 km (475 K) the measurements are located in the vortex edge region. For the evening observation the upper part of the balloon profile (26–31 km) is within the estimated errors of the northern MIPAS scan 21:11, though this is at 30 km altitude about 230 km farther away than scan 21:10 (Fig.3 and Tab. 3). We attribute this to sampling of different airmasses by
MIPAS-10
B which are more similar to scan 21:11 as indicated by the difference in PV values at 850 K (about 30 km altitude). The PV difference is smallest between balloon and the northern MIPAS scan (Table3). We cannot prove this assumption by application of the CTM model correction Eq. (2) since this does not change the resulting di ffer-ences significantly. This might be due to the limited horizontal resolution of the CTM
15
model (2.6×2.6◦) which does not sufficiently resolve the gradients close to the vortex boundary.
From 25 to 22 km scan 21:10 fits the balloon observation within the combined errors. However, between 18 and 21 km the balloon values are up to 0.25 ppbv lower than those of MIPAS. The reason for this is not clear but might be due to the different
di-20
rection of the limb-observations at the vortex boundary at these altitudes: while MIPAS looked parallel to the boundary, MIPAS-B looked nearly orthogonal and thus, across stronger gradients in ClONO2.
The comparison on 21 March gives reasonable agreement between the balloon and the nearest MIPAS scan 09:08 above about 22 km. From 19–21 km the maximum
dif-25
ference of 0.14 ppbv is about twice the estimated error. However, in this altitude region a strong south-north gradient of the vmrs is visible in the three MIPAS observations and while MIPAS looked from south to north the viewing direction of MIPAS-B was vice
ACPD
6, 9765–9821, 2006 MIPAS ClONO2 validation M. H ¨opfner et al. Title Page Abstract Introduction Conclusions References Tables Figures J I J I Back Close Full Screen / EscPrinter-friendly Version Interactive Discussion
EGU
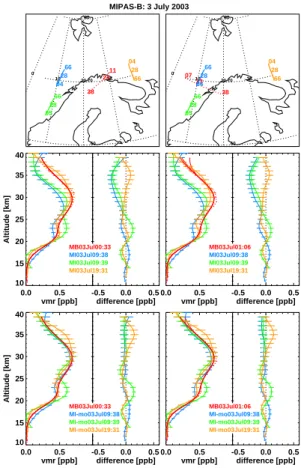
versa. We suppose that this could be the reason for the observed deviations. 3.1.3 MIPAS-B: 3 July 2003
Another MIPAS-B flight above northern Scandinavia was on 2/3 July. Figure4shows the results for two limb-scans measured in different directions with a time delay of about half an hour shortly after mid-night UTC. Both profiles are very similar since, compared
5
to wintertime, there is not much geographical variability of ClONO2 in Arctic summer. Unfortunately there have been no exact matches with MIPAS as shown in Table3. Best coincidences are in the morning (09:38, 09:39) and in the evening (19:31) of 3 July. Interestingly, MIPAS-B ClONO2 agrees best with the evening scan with differences very close to the combined total errors (Fig.4, middle). Especially above about 26 km
10
the MIPAS-B and MIPAS evening profiles are systematically higher than the morning measurements. This can be explained by a different exposure to sunlight, thus leading to a different degree of photolysis of ClONO2. While the solar zenith angle during the two MIPAS-B and the MIPAS scan 19:31 was nearly equal with 84–86◦, it was 50◦and 46◦for 09:38 and 09:39, respectively.
15
Application of the CTM correction led to a significant improvement of the comparison with the MIPAS morning scans (bottom panel of Fig.4): above about 25 km the large differences have disappeared and the agreement of MIPAS profiles 09:38 and 09:39 with the MIPAS-B observations has become nearly perfect. This result proves our assumption on the effect of ClONO2photolysis on the comparison.
20
3.2 Mark IV
The Jet Propulsion Laboratory Mark IV instrument (Toon, 1991) is a balloon-borne Fourier transform infrared interferometer with a very high spectral resolution (57 cm OPD). During sunrise or sunset it measures solar occultation spectra in limb geometry yielding a vertical resolution of about 2 km. Retrieval of trace gas profiles from Mark IV
25
ACPD
6, 9765–9821, 2006 MIPAS ClONO2 validation M. H ¨opfner et al. Title Page Abstract Introduction Conclusions References Tables Figures J I J I Back Close Full Screen / EscPrinter-friendly Version Interactive Discussion
EGU
the present study have been retrieved from the ν4 Q-branch at 780.2 cm−1 and the
ν2 Q-branch at 1292.6 cm−1. This is different from the MIPAS, MIPAS-B, MIPAS-STR and FIRS2 data evaluation where only the ν4 Q-branch region is used. Based on the commonly applied spectroscopic dataset byWagner and Birk(2003),Oelhaf et al.
(2001) have shown that MIPAS-B ClONO2profiles retrieved from the individual bands
5
agree to within 10%.
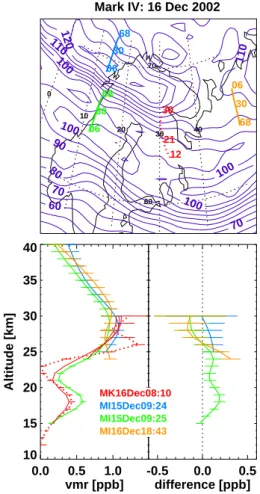
3.2.1 Mark IV: 16 December 2002
During the Mark IV flight on 16 December a ClONO2 profile has been obtained during sunrise. The location was inside the polar vortex at each tangent altitude. As shown in Table4 there was no exact coincidence with MIPAS. Nearest MIPAS profiles have
10
been obtained also inside the vortex in the morning of 15 December (09:24, 09:25) and in the evening of 16 December (18:43). As shown in Fig. 5 the balloon profile is strongly structured with a minimum at around 23 km altitude. This was caused by chlorine activation at polar stratospheric clouds (PSCs) which were abundant in the cold stratosphere in December 2002. Because of PSCs below 24 km MIPAS profiles
15
stop at that altitude for scans 09:24 and 18:43 due to the fact that spectra of PSC-contaminated tangent altitudes are excluded from the data analysis. However, scan 09:25 was PSC free. This scan also shows a ClONO2 minimum similar to Mark IV, which, however, is not as deep due to the worse altitude resolution of MIPAS. This can be seen from the balloon profile convolved with the averaging MIPAS kernel which
20
is much closer to the satellite observation. Somewhat larger differences exist in the regions between 17 and 20 km and 28–30 km. The latter one might be due to some instability of the Mark IV profile which is indicated by comparatively large error bars there. The differences below the minimum are likely due to the complex situation of chlorine activation in the polar vortex. Similar to the comparison with MIPAS-B in March
25
2003 near the vortex boundary, application of the CTM correction in this case had no significant effect on the comparison.
ACPD
6, 9765–9821, 2006 MIPAS ClONO2 validation M. H ¨opfner et al. Title Page Abstract Introduction Conclusions References Tables Figures J I J I Back Close Full Screen / EscPrinter-friendly Version Interactive Discussion
EGU
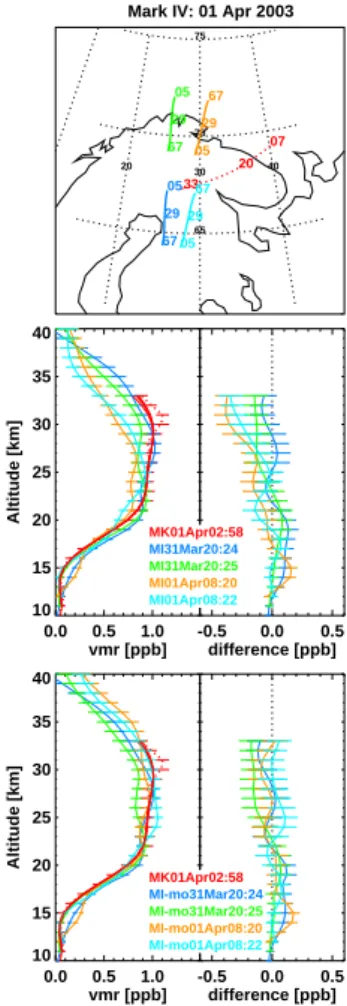
3.2.2 Mark IV: 1 April 2003
On 1 April 2003 Mark IV measured above northern Scandinavia outside the polar vor-tex during sunrise at about 03:00 UT. The polar vorvor-tex boundary was located about 10◦ further north. We compare this observation with four closely located MIPAS scans: two in the evening of 31 March (20:24, 20:25) and two in the morning of 1 April (08:20,
5
08:22) (see Table 4 and Fig. 6). The solar zenith angles were 106◦ and 102◦ for the evening observations and 68◦ and 64◦ for the morning observations of MIPAS. Pho-tolysis of ClONO2 during daytime is the reason for the better agreement of the bal-loon measurements with the evening observation (20:24) of MIPAS above about 26 km (middle panel in Fig.5). This is demonstrated by application of the CTM transformation
10
(bottom panel in Fig.6). The model correction reduces the differences between the MIPAS morning scans and the Mark IV observation such that the agreement is within the combined error estimates.
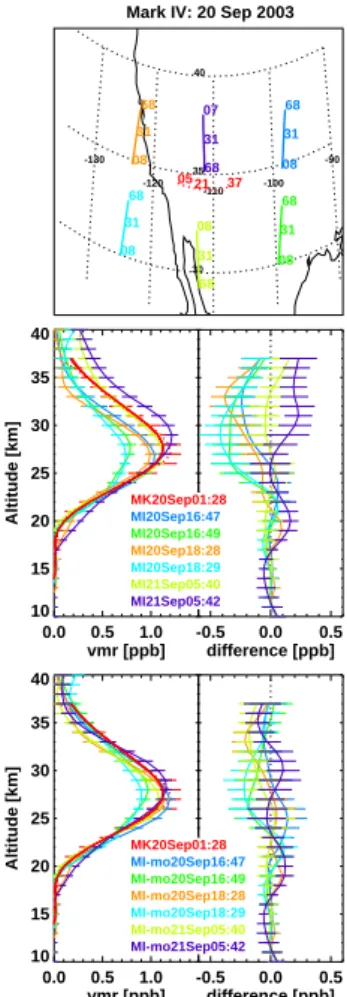
3.2.3 Mark IV: 19/20 September 2003
The last Mark IV ClONO2 profile which has been compared to MIPAS was obtained
15
during sunset over the United States on 20 September 2003, 01:28 UT. We compare this with the results from six surrounding limb-scans by MIPAS (Fig.7) which have been measured 15–17 h (16:47, 16:49, 18:28, 18:29) and 28 h (05:40, 05:42) later. While the profiles closer in time have been obtained during day (SZA: 39–42◦) the later ones were measured during night (SZA: 136–140◦). General features of the MIPAS profiles are,
20
first, the day-night differences above about 26 km and, second, a northward gradient in the region around the profile maximum during day (16:49 and 18:29 versus 16:47 and 18:28) and night (05:40 versus 05:42) (middle panel in Fig.7). This gradient and the strong diurnal variations together with the fact that there is no good match make the use of the CTM correction necessary. It results in a much more compact comparison
25
ACPD
6, 9765–9821, 2006 MIPAS ClONO2 validation M. H ¨opfner et al. Title Page Abstract Introduction Conclusions References Tables Figures J I J I Back Close Full Screen / EscPrinter-friendly Version Interactive Discussion
EGU
3.3 FIRS2
The FIRS-2 instrument is a thermal emission Fourier transform spectrometer operating in the far- (80–340 cm−1) and mid-infrared (330–1220 cm−1) spectral region. Interfer-ograms are recorded with 120 cm OPD. (Johnson et al., 1995). Vertical profiles of ClONO2 volume mixing ratios with an altitude resolution of about 3 km have been
de-5
rived from FIRS observations using the ν5Q-branch at 563 cm−1(Johnson et al.,1996) and the ν4Q-branch at 780.2 cm−1 (spectroscopic data byWagner and Birk(2003)). 3.3.1 FIRS2: 19/20 September 2003
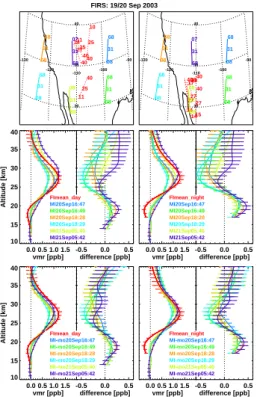
On 19/20 September 2003 the FIRS limb-emission instrument provided day- and night-time profiles of ClONO2. The time and location of these measurements are given in
10
Table5and plotted in the top row of Fig.8. The single balloon results (not shown here) reveal a strong scatter and, especially around 20 km, tend to show negative values. To illustrate the comparison with MIPAS we used the mean day- and nighttime balloon re-sult (red curves in middle row of Fig.8) which leads to a large scatter of the differences with respect to the single MIPAS profiles. This scatter is reduced by application of the
15
CTM correction (bottom row of Fig.8). Now, differences are often within the estimated error bars, however, a positive MIPAS bias at 20 km, caused by negative FIRS values there, and a negative bias between 25 and 30 km remain.
3.4 MIPAS-STR
MIPAS-STR is a Fourier transform emission instrument operating in the middle infrared
20
spectral region with similar instrumental specifications as MIPAS-B (see Table2). Dur-ing MIPAS validation campaigns MIPAS-STR has been operated from the high-altitude aircraft M55-Geophysica (Keim et al.,2004). One scan of MIPAS-STR consists of limb measurements to get profiles with high vertical resolution below the aircraft and upward observations to obtain limited information about the profile above. Retrieval of ClONO2
ACPD
6, 9765–9821, 2006 MIPAS ClONO2 validation M. H ¨opfner et al. Title Page Abstract Introduction Conclusions References Tables Figures J I J I Back Close Full Screen / EscPrinter-friendly Version Interactive Discussion
EGU
profiles from MIPAS-STR calibrated spectra is performed with the same inversion tool and radiative transfer model as used for MIPAS-B data analysis (see above) (H ¨opfner
et al.,2001).
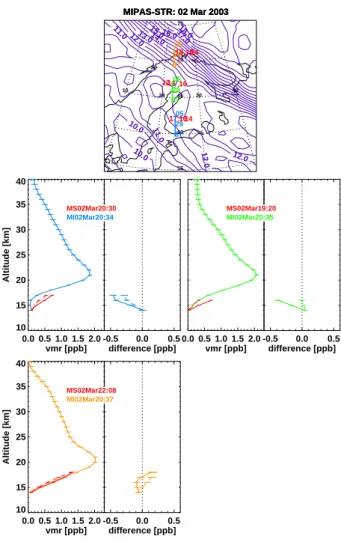
3.4.1 MIPAS-STR: 28 February, 2 and 12 March 2003
During end of February/beginning of March 2003 an Envisat validation campaign with
5
the Geophysica high-altitude aircraft took place from Kiruna in northern Sweden. The MIPAS-STR instrument on-board Geophysica provided measurements of ClONO2 be-low the aircraft in close coincidence with MIPAS on Envisat during three flights: on 28 February, 2 and 12 March (see Table6).
The locations of MIPAS-STR and MIPAS observations are given in the top of Figs.9–
10
11 together with potential vorticity at the 400 K potential temperature level (≈16 km). Following the criterion byNash et al.(1996), the vortex boundary at this level is about 14 pvu during the three days. Thus, on 28 February the Geophysica measurement corresponding to MIPAS scan 08:25 was inside, while 08:26 was at the inner vortex boundary at 400 K. On 2 March the two southern scans 20:34 and 20:35 were outside,
15
while 20:37 was at the boundary and on 12 March all observations have been inside the polar vortex.
Since a major error source in the MIPAS-STR data analysis is the assumption on the a-priori profile above the aircraft flight level, we show the comparison with MIPAS in Figs.9–11for the retrieval with a standard a-priori profile (solid lines) and also with
20
the coincident MIPAS ClONO2 profile as a priori (dashed lines). Using MIPAS results as a-priori leads to a large improvement of the comparison in 4 cases (28Feb08:26, 02Mar20:34, 02Mar20:35, 12Mar08:49), a degradation in one case (28Feb08:25) and no clear change in the other four observations.
ACPD
6, 9765–9821, 2006 MIPAS ClONO2 validation M. H ¨opfner et al. Title Page Abstract Introduction Conclusions References Tables Figures J I J I Back Close Full Screen / EscPrinter-friendly Version Interactive Discussion
EGU
3.5 Summary of balloon and airborne profile comparisons
In this section we analyse for each instrument the previously described set of com-parisons. For that purpose, mean difference profiles ¯δ have been determined from K single difference profiles:1
¯ δ= 1 K K X k=1 δk, (3) 5
where δk=xMIPAS,k− ˜xref,k in case of exactly matching observations and
δk=xtransMIPAS,k− ˜xref,k in case the CTM model correction has been applied. δ for¯
each instrument is given as solid black curves in the first column of Fig.12.
For diagnostics, we have calculated the altitude dependent 95% confidence interval of these mean values by
10 ± 2σδ,std¯ = ± v u u t 1 K (K − 1) K X k=1 (δk− ¯δ)2 t−1 cdf(0.975, K − 1) (4)
where t−1cdf(0.975, K −1) is the inverse of the cumulative Student’s t-distribution function for K −1 degrees of freedom at a value of 97.5% probability.
We have called this interval ±2σδ,std¯ since for large sample sizes its limit is ±2 times
the standard deviation of the sample divided by the square root of the number of sample
15
elements. The results are shown as dotted black curves in first column of Fig. 12. Green dotted curves in Fig.12 indicate the range of the estimated total random error of the mean differences (±2σδ,err¯ ) calculated from the combined error estimation of the
1
Mind that all variables here are vectors with as many elements as altitude grid points and that the expressions are given per altitude grid point. Thus, K in general is also altitude depen-dent. Introduction of a further index indicating the altitude dependence is omitted for clarity.
ACPD
6, 9765–9821, 2006 MIPAS ClONO2 validation M. H ¨opfner et al. Title Page Abstract Introduction Conclusions References Tables Figures J I J I Back Close Full Screen / EscPrinter-friendly Version Interactive Discussion
EGU
single difference profiles σδ,err,k¯ which have already been shown in the discussion of
the single profile comparison:
σδ,err¯ = 1 K v u u t K X k=1 σ2err,k. (5)
Here also the 95% interval is given. In the following we call a bias significant when it is outside these 95% confidence intervals.
5
For determination of an altitude dependent bias we compare the mean differences to
±2σδ,std¯ and ±2σδ,err¯ . The mean differences between MIPAS and the two instruments
MIPAS-B and Mark IV are consistent up to about 32 km altitude: at 15 km MIPAS over-estimates ClONO2vmrs by 0.02–0.03 ppb (up to 100%) and at 20 km by about 0.04– 0.05 ppb (up to 15%). From 25 to 32 km there is a slight underestimation of about
10
0.03 pb (3–4%) for MIPAS-B and a larger one (0.08 ppb, up to 10%) in case of Mark IV. Above, there is a tendency for an overestimation in case of MIPAS-B, but still a clear underestimation (up to 0.1 ppb or 25%) compared to Mark IV. For the MIPAS-B compar-isons differences are, however, all within the ±2σδ,std¯ interval and, thus, statistically not
significant while compared to the estimated errors ±2σδ,err¯ the positive MIPAS bias at
15
15 and 20 km might be real. In case of Mark IV the deviation at high altitudes is clearly significant and the 15 and 20 km differences are just at the limits of the confidence intervals.
Large biases exist in case of the MIPAS-FIRS comparison: from 15–22 km an over-estimation of MIPAS up to 0.25 ppb and an underover-estimation of up to 0.3 ppb in the
20
altitude region 25–31 km. The deviations around 20 km are significant with respect to
±2σδ,std¯ and ±2σδ,err¯ while at higher altitudes it is within the ±2σδ,std¯ interval. We
attribute these differences to the FIRS data (1) since these show negative vmrs in the order of 0.2 ppb around 20 km, (2) since during the same measurement campaign in September 2003 the agreement between MIPAS ClONO2profiles from the same limb
25
ACPD
6, 9765–9821, 2006 MIPAS ClONO2 validation M. H ¨opfner et al. Title Page Abstract Introduction Conclusions References Tables Figures J I J I Back Close Full Screen / EscPrinter-friendly Version Interactive Discussion
EGU
there is no indication from any other instrument that these deviations might be due to erroneous MIPAS data.
For the comparison with MIPAS-STR we have chosen those MIPAS-STR retrievals where MIPAS results have been used as a-priori since this seems to reduce the error due to unknown profile shape above the airplane (see Sect.3.4.1). Results are shown
5
in the bottom row of Fig.12. Largest differences of about 0.15 ppbv are found at 17 km altitude which are, however, not significant in terms of ±2σδ,std¯ . The differences are in
absolute units larger than in case of the comparison with MIPAS-B or Mark IV. However, in relative units the maximum positive bias is only 13% due to the large values of ClONO2 encountered in the lowermost stratosphere during the MIPAS-STR validation
10
campaign in February/March 2003.
To evaluate the given estimated precision of the measurements without depending on error covariances in the altitude domain, we have calculated χ2values of the di ffer-ences individually per altitude (von Clarmann,2006):
χ2= K X k=1 (δk− ¯δ)2 σerr,k2 . (6) 15
This is compared to the 95% confidence interval of the χ2 distribution function in the last column of Fig. 12. In this figure all χ2 values have been divided by K −1. In case of MIPAS-B the combined error seems to be underestimated from 16 to 24 km while at higher and lower altitudes it is within the 95% confidence interval. The com-bined Mark IV-MIPAS error estimation is, with an exception at around 15 km, always
20
at the lower edge of the confidence interval, thus, indicating a slight overestimation of the combined errors. For the comparison with FIRS there is an overestimation of the precision above 32 km and below 15 km while in a large region around 25 km errors seem underestimated. Finally in case of MIPAS-STR the combined random errors are underestimated at 16–17 km altitude while below actual χ2 values lie inside the 95%
25
ACPD
6, 9765–9821, 2006 MIPAS ClONO2 validation M. H ¨opfner et al. Title Page Abstract Introduction Conclusions References Tables Figures J I J I Back Close Full Screen / EscPrinter-friendly Version Interactive Discussion
EGU
4 Comparison with ground-based measurements: FTIR
We have compared MIPAS ClONO2observations with ground-based solar absorption FTIR measurements from various stations operating within the Network for the Detec-tion of Atmospheric ComposiDetec-tion Change (NDACC, formerly Network for the DetecDetec-tion of Stratospheric Change, NDSC) (see Table7). From these instruments total column
5
amounts of ClONO2 are available. These data have been derived on the basis of dif-ferent forward models/inversion schemes (Rinsland et al.,2003;Mellqvist et al.,2002). In the case of Thule observations, the retrieval code SFIT2 (Rinsland et al.,2003) and a two-microwindow approach similar toReisinger et al.(1995) has been applied. For Iza ˜na measurements PROFFIT (Hase et al.,2004) has been used. In contrast to the
10
scheme described inRinsland et al.(2003), for Kiruna the approach byReisinger et al.
(1995) has been adopted for the data shown in the present work. Common to the MI-PAS data analysis, all FTIR retrievals are performed in the region of the ν4Q-branch at 780.2 cm−1, using the spectroscopic data fromWagner and Birk(2003).
For the comparison we have calculated ClONO2 column amounts from the MIPAS
15
profiles using the pressures and temperatures which have been derived from the same spectra in a previous step of the retrieval chain (von Clarmann et al., 2003). These abundances are determined within the available altitude range of MIPAS, i.e. with a maximum coverage of 6–70 km. In the presence of clouds the lower limit is the cloud top derived from MIPAS. Thus, a part of the tropospheric ClONO2 column is missing
20
in the MIPAS derived data but present in the FTIR total columns. In standard profiles of ClONO2the tropospheric column (0–12 km) is about 1–3% of the total column. Fur-ther, some of the FTIR stations used in this intercomparison also derived tropospheric column amount of ClONO2. Mean tropospheric values from these stations lie in the range 0.3%(Wollongong)–2%(Thule) of the total column amount.
25
The comparisons cover most of the time period of the MIPAS operation discussed in this paper and range from 78.9◦N to 45◦S (see Fig.13). The collocated scans of MIPAS with the FTIR measurements have been selected on the basis of a maximum
ACPD
6, 9765–9821, 2006 MIPAS ClONO2 validation M. H ¨opfner et al. Title Page Abstract Introduction Conclusions References Tables Figures J I J I Back Close Full Screen / EscPrinter-friendly Version Interactive Discussion
EGU
distance∆dmax, time∆tmax, and potential vorticity (PV)∆pvmaxcriterion. These criteria have been applied to the locations where the line-of-sight of the FTIRs intersected the altitude of 20 km or the 475 K potential temperature level in case of the PV-criterion, respectively.
Figure13shows the comparison of daily mean values for∆dmax=800 km, ∆tmax=8 h,
5
and ∆pvmax=3×10⁻⁶Km2kg−1s−1. The data reflect well the annual variation of ClONO2 column amounts with large amplitudes at high-latitude stations (Spitsbergen, Thule, Kiruna, Harestua) in spring. These are due to the chlorine deactivation in strato-spheric vortex airmasses, which is even visible at mid-latitudes (Jungfraujoch) on dis-tinct days when vortex air extended far south. Also the annual variation at stations
10
which are rarely affected by vortex air, like Jungfraujoch, Iza˜na or Lauder, is well met. For a more detailed investigation, Fig. 14 shows scatter plots for each station and Fig. 15 the histogram of the differences between MIPAS and FTIR. In these Figures black symbols/bars denote the selection for ∆dmax=800 km, ∆tmax=8 h, and ∆pvmax=3×10
−6
Km2kg−1s−1and red symbols/bars the more stringent selection with
15
∆dmax=400 km, ∆tmax=4 h, and ∆pvmax=3×10 −6
Km2kg−1s−1. Additionally in Table8
and Table9some statistical quantities are listed for the two match cases.
In the following we first analyse the data for any significant bias by comparing the mean difference with their standard deviations. Then estimated errors are discussed with respect to the mean differences and with respect to the derived precision via a χ2
20
test.
To decide whether the mean difference δ between MIPAS and FTIR at each sta-tion is significant and, thus, might indicate some systematic error, we compare it to the 68% significance interval of the mean difference ±σδ,std¯ from the measurements in
Tables 8 and 9. For ∆dmax=800 km, ∆tmax=8 h, and ∆pvmax=3×10⁻⁶Km2kg−1s−1
25
one station is within 1σδ,std¯ (Spitsbergen: −0.37σδ,std¯ ), two are within or near 1–
2σδ,std¯ (Jungfraujoch: 1.75σδ,std¯ , Wollongong: −2.08σδ,std¯ ), four within or near 2–
3σδ,std¯ (Lauder: −2.33σδ,std¯ , Iza ˜na: 2.5σδ,std¯ Kiruna: 2.51σδ,std¯ , Thule: 3.07σδ,std¯ )
cri-ACPD
6, 9765–9821, 2006 MIPAS ClONO2 validation M. H ¨opfner et al. Title Page Abstract Introduction Conclusions References Tables Figures J I J I Back Close Full Screen / EscPrinter-friendly Version Interactive Discussion
EGU
terion (Table 9) the situation is similar, only that three stations are within 1–2σδ,std¯
(Iza ˜na: 1.49σδ,std¯ , Jungfraujoch: −1.91σδ,std¯ , Thule: −1.91σδ,std¯ ) and four within 2–
3σδ,std¯ (Lauder: −2.41σδ,std¯ , Harestua: −2.51σδ,std¯ , Kiruna: 2.61σδ,std¯ , Wollongong:
−2.86σδ,std¯ ) and no one outside 3σδ,std¯ .
The FTIR at Harestua has measured systematically higher values than MIPAS, but
5
only during the summer as indicated by the bi-modal structure of the histogram and the scatter plot. The wintertime data alone show no significant bias. This summertime offset is probably due to a strong dependence of the retrieved column amounts on the assumed a-priori profile in the FTIR retrieval.
In the following, we consider the combined estimated error of MIPAS and the various
10
FTIRs. To calculate the variance scol,noise of the MIPAS derived column amounts due to instrumental noise we applied the linear transformation
scol,noise = ρTSxρ (7)
whereSx is the covariance matrix of the profile retrieval of ClONO2volume mixing ra-tios due to instrumental noise and ρ the vector of the total air partial column amounts.
15
Unlike Sx, which is a regular outcome of the retrieval, an explicit calculation for the other error components is not available for each single ClONO2profile. To estimate the contribution of these errors we have used the total error calculations which were per-formed for the MIPAS profiles compared to the collocated profile measurements which have been discussed in Sect.3 of this paper. As in the case of the profile
compari-20
son, the error due to spectroscopic data has been disregarded since all ground-based column observations use the same data as MIPAS. The mean error, excluding noise and spectroscopy, for the vertical column amounts from the 32 single error estimates is 2% with a standard deviation of 2% compared to 5%±4% for the noise error com-ponent. Thus, for the total error estimate of MIPAS derived column amounts we have
25
assumed a constant 2% additional random error term for the non-noise and scol,noise for the individual noise error.
Since no specific CTM model results have been available for the MIPAS-FTIR in-tercomparison a coincidence error component has to be considered additionally (von
ACPD
6, 9765–9821, 2006 MIPAS ClONO2 validation M. H ¨opfner et al. Title Page Abstract Introduction Conclusions References Tables Figures J I J I Back Close Full Screen / EscPrinter-friendly Version Interactive Discussion
EGU
Clarmann,2006). For both coincident criteria we have calculated typical coincidence standard deviations per FTIR station on basis of two datasets: (1) by use of all MIPAS ClONO2profiles evaluated at IMK for 2002 until 2004 and, (2) by use of KASIMA CTM global fields. Coincidence standard deviations have been determined separately for ±10◦latitude bands around each station.
5
In Tables8and9we have given the estimated error σδ,err,comb¯ of the mean difference
calculated as combined estimated error of MIPAS σδ,err,mip¯ , FTIRs σδ,err,ftir¯ and the
coincidence error σδ,err,coi¯ under the assumption that all given error terms are of random
nature. For σδ,err,coi¯ two values resulting from the different underlying datasets are
shown. Since σδ,err,comb¯ values are comparable to σδ,std¯ our conclusions about the
10
mean bias at each station are also valid with regard to the combined estimated errors. A quantitative analysis of the validity of the precision estimates is gained by the χ2 -test (see Sect. 3.5) presented in the last two columns of Tables 8 and 9. Regarding both matching criteria and the different coincidence error estimates at least two (of four) χ2 values of Iza ˜na, Jungfraujoch, Thule, Kiruna and Wollongong are within the
15
95% confidence limit of χ2. There is indication that the errors for Spitsbergen and Harestua are underestimated while those of Lauder seem to be overestimated.
5 Comparison with spaceborne measurements: ACE-FTS
The Atmospheric Chemistry Experiment (ACE) has been launched into orbit on 13 Au-gust 2003 with the solar occultation sounder ACE-FTS (ACE-Fourier Transform
Spec-20
trometer) on board. ACE-FTS is a Michelson interferometer which covers the spectral region from 750 to 4400 cm−1 with a spectral resolution (maximum optical path di ffer-ence: 25 cm) (Bernath et al.,2005) slightly higher than that of MIPAS. The retrieval of trace gas profiles from ACE-FTS measurements has been described byBoone et al.
(2005).
25
ClONO2is derived from the ν4-Q branch at around 780.2 cm−1for altitudes between 12 and 20 km and from the ν2-Q branch at around 1292.6 cm−1for altitudes between 18
ACPD
6, 9765–9821, 2006 MIPAS ClONO2 validation M. H ¨opfner et al. Title Page Abstract Introduction Conclusions References Tables Figures J I J I Back Close Full Screen / EscPrinter-friendly Version Interactive Discussion
EGU
and 35 km. The spectroscopic data ofWagner and Birk(2003) are used. The vertical resolution of ACE-FTS vmr profiles defined by the field-of-view of the instrument and the tangent altitude spacing is about 3–4 km (Boone et al., 2005) – comparable to that of the MIPAS ClONO2 retrievals. A first comparison of ClONO2column amounts derived from ACE-FTS vertical profiles and from ground-based solar absorption FTIR
5
measurements in 2004 has been published byMahieu et al.(2005).
Here we compare ClONO2 profiles from ACE-FTS sunset observations (ACE-FTS level 2 Version 2.2) and MIPAS measurements in the overlapping time period from February 2004, when ACE-FTS regular data collection started, until end of March 2004, when MIPAS nominal mode data ended. For the comparisons we used as
10
match criterion a maximum time difference of 9 h, a maximum tangent point difference of 800 km, and a maximum difference of potential vorticity of 3×10⁻⁶Km2kg−1s−1 at an altitude of 475 K potential temperature. Over all matches, this resulted in a mean distance of 296 km (±154 km), a mean PV difference of −0.007 ×10⁻⁶Km2kg−1s−1 (±1.49×10⁻⁶Km2kg−1s−1) and a mean time difference of −0.2 h. However, the
dis-15
tribution of the time differences is bi-modal since MIPAS measurements are either at around late morning or early night while ACE-FTS observations are made during sunset. Thus, for comparison with nighttime MIPAS observations the time difference (MIPAS-ACE) is 4–5 h, while in the case of MIPAS daytime measurements it is about −8.1 h at latitudes between 30 and 60◦N and −5.6 h for 60–90◦N.
20
In the following, we compare data for these two latitude bands, since sufficient num-bers of co-incidences for other regions are not available. The first four rows of Fig.16
show the comparison for the two latitude bands and MIPAS day/night observations. In the fifth row the combination of all co-incidences is given. In this general case mean differences are less than 0.04 ppbv (less than 5%) up to altitudes of 27 km with MIPAS
25
measuring nearly at all levels higher values than ACE. Mean differences are within the 95% (±2σδ,std¯ ) confidence interval of the mean (black dotted in first column of Fig.16)
from 12.5 to 15 km and from 19 to 22 km with deviations of less than 0.01 ppbv. Above 27 km, differences increase up to nearly 0.15 ppbv or 30% at 34.5 km. Beside this
ACPD
6, 9765–9821, 2006 MIPAS ClONO2 validation M. H ¨opfner et al. Title Page Abstract Introduction Conclusions References Tables Figures J I J I Back Close Full Screen / EscPrinter-friendly Version Interactive Discussion
EGU
steady increase there are slightly enhanced differences up to 0.03 ppbv in the range 15–19 km.
The positive MIPAS bias increasing with altitude is present clearly during the night at all latitude bands. At mid-latitudes, however, MIPAS daytime observations are lower than ACE, while nearer to the pole (60–90◦N) differences cross from negative to
posi-5
tive values around 25 km and also increase upwards. To investigate, whether photolysis of ClONO2 is the reason for the upper altitude discrepancy we applied KASIMA CTM model simulations provided at all times/locations of MIPAS and ACE-FTS observations. Figure17presents the results where the MIPAS profiles have been transformed to the time and location of ACE-FTS by applying Eq. (2).
10
This transformation affects the comparison primarily at altitudes above about 25 km. In that range the positive MIPAS bias for nighttime observations has been reversed toward a negative bias. This is also the case for the daytime mean profiles at high latitudes above 30 km. For sunlit observations at mid-latitudes the negative bias is reversed to a positive one between 25 and 32 km. In the overall comparison (bottom
15
row in Fig. 17) there is no systematic bias any more up to altitudes of about 27 km. Above 27 km a negative bias of MIPAS with differences up to −0.1 ppbv is present. Thus, maximum absolute differences are reduced by application of the CTM. However, the model overcompensates the photochemically-induced high altitude bias.
The estimated random error ±2σδ,err¯ of the mean difference calculated as combined
20
errors from both instruments is given as dotted green curves in the first column of Figs. 16 and 17. While in the upper part of the profile ±2σδ,err¯ is comparable to
±2σδ,std¯ , in the lower part ±2σδ,err¯ is smaller. This is reflected in altitude dependent
χ2values plotted in the fourth column of Figs.16and17. Up to about 23 km χ2values are strongly enhanced compared to the 95% confidence interval of χ2. The fact that
25
there is no significant decrease of the χ2profiles when the CTM model correction was applied (Fig.17vs.16) seems to indicate that the observed χ2 values are not due to coincidence errors. However, (1) the region with high χ2 is located at altitudes where there are strongly enhanced values of ClONO2 in ACE-FTS and MIPAS profiles due
ACPD
6, 9765–9821, 2006 MIPAS ClONO2 validation M. H ¨opfner et al. Title Page Abstract Introduction Conclusions References Tables Figures J I J I Back Close Full Screen / EscPrinter-friendly Version Interactive Discussion
EGU
to chlorine deactivation in spring 2004 and (2) highest χ2 values are larger in the lati-tude band nearer to the pole. The CTM model run does not show such large values of ClONO2in vortex air in February/March 2004. Thus, we suspect that the high χ2values are caused by coincidence errors not accounted for by the applied CTM correction.
To test this assumption, as in the case for the ground-based analysis, we determined
5
altitude dependent coincidence errors from (1) MIPAS derived ClONO2fields in Febru-ary and March and from (2) KASIMA CTM runs. These have been incorporated in the
χ2 determination (red curves for (1) and green curves for (2) in Figs. 16 and 17). In case of (1) the large χ2 values disappeared while for (2) there is, on the one hand, a strong reduction above 20 km, but on the other hand, below 20 km χ2 values stay
10
large. This confirms the view that the underestimated errors are at least partly due to an underestimation of the real ClONO2variability by the CTM.
6 Conclusions
Vertical profiles of ClONO2retrieved with the MIPAS level 2 scientific processor at IMK have been validated by comparison with measurements from balloon and aircraft
cam-15
paigns, with ground-based FTIR data and with satellite observations. Between MIPAS and MIPAS-B observations from dedicated validation campaigns no significant bias has been detected over the whole altitude range from 12 to 39 km. Maximum absolute mean differences are about 0.05 ppbv. The χ2 test indicates a slight underestimation of the combined estimated error around 20 km altitude. Comparisons to Mark IV
obser-20
vations show no significant bias up to 29 km with absolute differences below 0.05 ppbv. However a slight negative bias between 30 and 35 km of up to −0.1 ppbv (MIPAS-Mark IV) is visible. There is no strong evidence for an error in the precision estimates between the two instruments. Large biases existing between MIPAS and ClONO2from the flight of the FIRS instrument are very probably caused by the FIRS profiles
show-25
ing a strong scatter and often negative vmr values. Regarding the dedicated validation measurements of ClONO obtained in the lower stratosphere with the airborne
MIPAS-ACPD
6, 9765–9821, 2006 MIPAS ClONO2 validation M. H ¨opfner et al. Title Page Abstract Introduction Conclusions References Tables Figures J I J I Back Close Full Screen / EscPrinter-friendly Version Interactive Discussion
EGU
STR, maximum differences are below 0.15 ppbv which are, however, not significant over the whole altitude range from 10–17 km. The combined random error analysis underestimates the precision only between 15 and 17 km.
Comparisons of ClONO2 column amounts from eight ground-based solar absorp-tion FTIR instruments with MIPAS show no evidence for a systematic bias in the
MI-5
PAS data. The mean difference (MIPAS-FTIR) at all stations is 0.11±0.12×1014cm−2 (1.0±1.1%) for a coincidence criterion of∆dmax=800 km, ∆tmax=8 h, and ∆pvmax=3 × 10⁻⁶Km2kg−1s−1 at 475 K. Application of the stricter criterion ∆dmax=400 km, ∆tmax=4 h, and ∆pvmax=3×10
−6
Km2kg−1s−1 at 475 K lead to an overall difference of −0.09±0.19×1014cm−2 (−0.8±1.7%). There is no clear evidence for deficiencies
10
in the MIPAS-FTIR combined precision estimates of five instruments while for two the random error seems underestimated and in one case overestimated.
MIPAS profiles of ClONO2in the period February–March 2003 have been compared to results from the ACE-FTS spaceborne instrument. Up to about 26 km absolute mean differences are below 0.03 ppbv and there is no evidence for a systematic bias between
15
the two datasets. Above this altitude the comparison is aggravated by the diurnal vari-ation of ClONO2 due to photochemistry. This has been shown by application of a chemical transport model which, however, led to an overcorrection of the bias by up to 0.1 ppbv. Such an overcompensation has not been observed in case of the balloon-borne observations of MIPAS-B on 3 July 2003 (Fig.4), Mark IV on 1 April 2003 (Fig.6),
20
and Mark IV on 20 September 2003 (Fig.7) where the CTM correction improved the comparison significantly. Whether the overcorrection in case of the MIPAS-ACE-FTS comparison is caused by a model deficiency or by a remaining bias between the two in-struments is an open question. With regard to precision validation, the χ2test revealed slight underestimation of the estimated combined precision between MIPAS and
ACE-25
FTS at altitudes above 25 km, but a large underestimation below, with maximum around 18 km. It has been shown that this is likely caused by the large variability of ClONO2in spring which is not fully reproduced in the CTM model results applied for coincidence error correction.
ACPD
6, 9765–9821, 2006 MIPAS ClONO2 validation M. H ¨opfner et al. Title Page Abstract Introduction Conclusions References Tables Figures J I J I Back Close Full Screen / EscPrinter-friendly Version Interactive Discussion
EGU
In summary, this study, which has considered most of the independent measure-ments of ClONO2from July 2002 until March 2004, has demonstrated the consistency and reliability of the IMK MIPAS ClONO2 dataset available at (http://www-imk.fzk.de/
asf/ame/envisat-data/).
Acknowledgements. Financial support for this project by ESA (contracts 10249/01/NL/SF and
5
16039/02/NL/SF), the European Union (APE-INFRA: EVR1-CT-1001-40020) and the German Federal Ministry of Education and Research (BMBF 01SF9953/8 and 50EE0203) is gratefully acknowledged. MIPAS spectra were provided by the European Space Agency. The ACE mis-sion is supported by the Canadian Space Agency and the Natural Sciences and Engineering Research Council of Canada. The Belgian contribution has been supported by the ACE and
10
CINAMON Prodex projects (ESA contracts C90207 and C90211, respectively). We also would like to acknowledge the Swedish Environmental Agency and the European Union for funding the measurements at Harestua.
References
Bernath, P. F., McElroy, C. T., Abrams, M. C., Boone, C. D., Butler, M., Camy-Peyret, C.,
15
Carleer, M., Clerbaux, C., Coheur, P.-F., Colin, R., DeCola, P., DeMazi `ere, M., Drummond, J. R., Dufour, D., Evans, W. F. J., Fast, H., Fussen, D., Gilbert, K., Jennings, D. E., Llewellyn, E. J., Lowe, R. P., Mahieu, E., McConnell, J. C., McHugh, M., McLeod, S. D., Michaud, R., Midwinter, C., Nassar, R., Nichitiu, F., Nowlan, C., Rinsland, C. P., Rochon, Y. J., Rowlands, N., Semeniuk, K., Simon, P., Skelton, R., Sloan, J. J., Soucy, M.-A., Strong, K., Tremblay,
20
P., Turnbull, D., Walker, K. A., Walkty, I., Wardle, D. A., Wehrle, V., Zander, R., and Zou, J.: Atmospheric Chemistry Experiment (ACE): Mission overview, Geophys. Res. Lett., 32,
L15S01, doi:10.1029/2005GL022386, 2005. 9785
Blom, C. E., Fischer, H., Glatthor, N., Gulde, T., H ¨opfner, M., and Piesch, C.: Spatial and
temporal variability of ClONO2, HNO3and O3in the Arctic winter of 1992/1993 as obtained
25
by airborne infrared emission spectroscopy, J. Geophys. Res., 100, 9101–9114, 1995. 9768
Boone, C. D., Nassar, R., Walker, K. A., Rochon, Y., McLeod, S. D., Rinsland, C. P., and Bernath, P. F.: Retrievals for the atmospheric chemistry experiment Fourier-transform
ACPD
6, 9765–9821, 2006 MIPAS ClONO2 validation M. H ¨opfner et al. Title Page Abstract Introduction Conclusions References Tables Figures J I J I Back Close Full Screen / EscPrinter-friendly Version Interactive Discussion
EGU
Farmer, C. B., Toon, G. C., Schaper, P. W., Blavier, J.-F., and Lowes, L. L.: Stratospheric trace
gases in the spring 1986 Antarctic atmosphere, Nature, 329, 126–130, 1987. 9768
Friedl-Vallon, F., Maucher, G., Kleinert, A., Lengel, A., Keim, C., Oelhaf, H., Fischer, H., Seefeldner, M., and Trieschmann, O.: Design and characterisation of the balloon–borne Michelson Interferometer for Passive Atmospheric Sounding (MIPAS–B2), Appl. Opt., 43,
5
3335–3355, 2004. 9772
Hase, F., Hannigan, J. W., Coffey, M. T., Goldman, A., H¨opfner, M., Jones, N. B., Rinsland,
C. P., and Wood, S. W.: Intercomparison of retrieval codes used for the analysis of high-resolution, ground-based FTIR measurements, J. Quant. Spectrosc. Radiat. Transfer, 25–52,
2004. 9782
10
H ¨opfner, M., Blom, C. E., von Clarmann, T., Fischer, H., Glatthor, N., Gulde, T., Hase, F., Keim, C., Kimmig, W., Lessenich, K., Piesch, C., Sartorius, C., and Stiller, G. P.: MIPAS–STR data analysis of APE–GAIA measurements, in IRS 2000: Current Problems in Atmospheric Radiation, edited by: Smith, W. L. and Timofeyev, Y. M., 1136–1139, A. Deepak Publishing,
Hampton, VA, USA, 2001. 9778
15
H ¨opfner, M., von Clarmann, T., Fischer, H., Glatthor, N., Grabowski, U., Kellmann, S., Kiefer, M., Linden, A., Mengistu Tsidu, G., Milz, M., Steck, T., Stiller, G. P., Wang, D.-Y., and Funke, B.:
First spaceborne observations of Antarctic stratospheric ClONO2 recovery: Austral spring
2002, J. Geophys. Res., 109, D11308, doi:10.1029/2004JD004609, 2004. 9769, 9770,
9772
20
Johnson, D. G., Jucks, K. W., Traub, W. A., and Chance, K. V.: Smithsonian stratospheric far-infrared spectrometer and data-reduction system, J. Geophys. Res., 100, 3091–3106, 1995. 9777
Johnson, D. G., Orphal, J., Toon, G. C., Chance, K. V., Traub, W. A., Jucks, K. W., Guelachvili, G., and Morillon-Chapey, M.: Measurement of chlorine nitrate in the stratosphere using the
25
ν4and ν5bands, Gephys. Res. Lett., 23, 1745–1748, 1996. 9777,9797
Keim, C., Blom, C. E., von der Gathen, P., Gulde, T., H ¨opfner, M., Liu, G. Y., Oulanovski, A., Piesch, C., Ravegnani, F., Sartorius, C., Schlager, H., and Volk, C. M.: Validation of MIPAS-ENVISAT by correlative measurements of MIPAS-STR, in Proc. ACVE-2 Validation Workshop, 3–7 May, 2004, ESRIN, Frascati, Italy, vol. SP-562, ESA Publications Division,
30
ESTEC, Postbus 299, 2200 AG Noordwijk, The Netherlands, 2004. 9777
Kouker, W., Langbein, I., Reddmann, T., and Ruhnke, R.: The Karlsruhe simulation model of the middle atmosphere (KASIMA), version 2, vol. FZKA 6278 of Wissenschaftliche Berichte,
ACPD
6, 9765–9821, 2006 MIPAS ClONO2 validation M. H ¨opfner et al. Title Page Abstract Introduction Conclusions References Tables Figures J I J I Back Close Full Screen / EscPrinter-friendly Version Interactive Discussion
EGU
Forschungszentrum Karlsruhe, 1999. 9771
Mahieu, E., Zander, R., Duchatelet, P., Hannigan, J. W., Coffey, M. T., Mikuteit, S., Hase, F.,
Blumenstock, T., Wiacek, A., Strong, K., Taylor, J. R., Mittermeier, R. L., Fast, H., Boone, C. D., McLeod, S. D., Walker, K. A., Bernath, P. F., and Rinsland, C. P.: Comparisons
be-tween ACE-FTS and ground-based measurements of stratospheric HCl and ClONO2
load-5
ings at northern latitudes, Geophys. Res. Lett., 32, L15S08, doi:10.1029/2005GL022396,
2005. 9786
Marcy, T. P., Gao, R., Northway, M. J., Popp, P. J., Stark, H., and Fahey, D.: Using chemical
ionization mass spectrometry for detection of HNO3, HCl, and ClONO2 in the atmosphere,
Int. J. Mass Spectrom., 243, 63–70, 2005. 9768
10
Mellqvist, J., Galle, B., Blumenstock, T., Hase, F., Yashcov, D., Notholt, J., Sen, B., Blavier, J.-F., Toon, G. C., and Chipperfield, M. P.: Ground-based FTIR observations of chlorine activation and ozone depletion inside the Arctic vortex during the winter of 1999/2000, J. Geophys.
Res. (Atmos.), 107, 6–1, 2002. 9782
Mergenthaler, J. L., Kumer, J. B., Roche, A. E., Nightingale, R. W., Potter, J. F., Gille, J. C.,
15
Massie, S. T., Bailey, P. L., Edwards, D., Connell, P. S., Kinnison, D. E., Gunson, M. R., Abrams, M. C., Toon, G. C., Sen, B., Blavier, J.-F., Murcray, D. G., Murcray, F. J., and
Goldman, A.: Validation of CLAES ClONO2 measurements, J. Geophys. Res., 101, 9603–
9620, 1996. 9768
Murcray, D. G., Goldman, A., Murcray, F. H., Murcray, F. J., and Williams, W. J.: Stratospheric
20
Distribution of ClONO2, Geophys. Res. Lett., 6, 857–859, 1979. 9768
Nash, E. R., Newmann, P. A., Rosenfield, J. E., and Schoeberl, M. R.: An objective determi-nation of the polar vortex using Ertel’s potential vorticity, J. Geophys. Res., 101, 9471–9478,
1996. 9778,9807,9809
Norton, H. and Beer, R.: New apodizing functions for Fourier spectrometry, J. Opt. Soc. Am.,
25
66, 259–264, (Errata J. Opt. Soc. Am., 67, 419, 1977), 1976. 9769
Oelhaf, H., Clarmann, T. V., Fischer, H., Friedl-Vallon, F., Fritzsche, C., Linden, A., Piesch, C.,
Seefeldner, M., and V ¨olker, W.: Stratospheric ClONO2and HNO3 profiles inside the Arctic
vortex from MIPAS-B limb emission spectra obtained during EASOE, Geophys. Res. Lett.,
21, 1263–1266, 1994. 9768
30
Oelhaf, H., Wetzel, G., H ¨opfner, M., Friedl-Vallon, F., Glatthor, N., Maucher, G., Stiller, G., Trieschmann, O., von Clarmann, T., Birk, M., and Wagner, G.: Interconsistency Checks