HAL Id: hal-01121226
https://hal.archives-ouvertes.fr/hal-01121226
Submitted on 12 Aug 2020
HAL is a multi-disciplinary open access
archive for the deposit and dissemination of
sci-entific research documents, whether they are
pub-lished or not. The documents may come from
teaching and research institutions in France or
abroad, or from public or private research centers.
L’archive ouverte pluridisciplinaire HAL, est
destinée au dépôt et à la diffusion de documents
scientifiques de niveau recherche, publiés ou non,
émanant des établissements d’enseignement et de
recherche français ou étrangers, des laboratoires
publics ou privés.
Ten years of Martian nitric oxide nightglow observations
Arnaud Stiepen, Jean-Claude Gérard, Marie-Ève Gagné, Franck Montmessin,
Jean-Loup Bertaux
To cite this version:
Arnaud Stiepen, Jean-Claude Gérard, Marie-Ève Gagné, Franck Montmessin, Jean-Loup Bertaux.
Ten years of Martian nitric oxide nightglow observations. Geophysical Research Letters, American
Geophysical Union, 2015, 42 (3), pp.720-725. �10.1002/2014GL062300�. �hal-01121226�
RESEARCH LETTER
10.1002/2014GL062300 Key Points:• We present 10 years of NO nightglow observation
• We show the hemispheric distribution of the emission
• We analyze the peak brightness and its variability
Correspondence to:
A. Stiepen,
Citation:
Stiepen, A., J.-C. Gérard, M.-È. Gagné, F. Montmessin, and J.-L. Bertaux (2015), Ten years of Martian nitric oxide nightglow observations,
Geo-phys. Res. Lett., 42, 720–725,
doi:10.1002/2014GL062300.
Received 22 OCT 2014 Accepted 18 JAN 2015
Accepted article online 24 JAN 2015 Published online 10 FEB 2015
Ten years of Martian nitric oxide nightglow observations
Arnaud Stiepen1, Jean-Claude Gérard1, Marie-Ève Gagné2,Franck Montmessin3, and Jean-Loup Bertaux3
1Laboratoire de Physique Atmosphérique et Planétaire, Université de Liège, Liège, Belgium,2Canadian Centre for Climate
Modelling and Analysis, University of Victoria, Victoria, British Columbia, Canada,3Laboratoire Atmosphères, Milieux,
Observations Spatiales, Université de Versailles Saint-Quentin en Yvelines, Versailles, France
Abstract
We present 10 years of Martian NO nightglow Spectroscopy for Investigation of Characteristics of the Atmosphere of Mars observations in limb and stellar occultation modes. The NO nightglow is used as a tracer of the summer-to-winter hemispherical circulation in the upper atmosphere of Mars. Its distribution roughly follows the curve latitude = −80 sin(solar longitude), with deviations. We find that the peak brightness is 5 ± 4.5 kR, situated at 72 ± 10.4 km. It ranges from 0.23 to 18.51 kR and from 42 to 97 km. These values are consistent with previous studies. We also present maps of the brightness of the NO emission peak and its variability, an important factor that can reach up to 50% of the emission and is not reproduced by average brightness model maps. The characteristics and factors that may control the emission are investigated. In particular, we show that the solar activity exerts a positive influence on the number of detections. It does not influence, on the contrary, the brightness or altitude of the peak of the NO nightglow emission. Results presented in this study lead to future comparisons with global Martian atmospheric models and observational targets for the Imaging Ultraviolet Sprectrograph Mars Atmosphere and Volatile Evolution.1. Introduction
The upper atmosphere of Mars dynamics, energy balance, structure, and composition depend on its multiple interactions with the lower atmosphere and the ionosphere. Its study enhances our understanding of its atmosphere and its coupling with the solar forcing. The upper atmosphere is the major target of present and future Martian missions as the NASA Mars Atmosphere and Volatile Evolution (MAVEN) spacecraft. The study of planetary airglow provides valuable information concerning the atmosphere where it is produced as these emissions remotely probe the composition, temperature, and dynamics of an atmosphere.
In the dayside thermosphere of Mars, the extreme ultraviolet solar radiations photodissociate CO2and N2 molecules. O(3P) and N(4S) atoms are then carried by the summer-to-winter hemispheric transport. They
recombine to form NO(C2Π) excited molecules that directly emit the UV𝛿 and 𝛾 bands (the 𝛿 bands are
emissions of the C2Π state, while the𝛾 bands are emissions of the A2Σ state, which has been populated by
cascading from the C2Π state): these emissions are indicators of the N and O atom fluxes transported by the
summer-to-winter dayside to nightside Hadley cell.
The first detection of the nitric oxide UV airglow on Mars nightside was reported by Bertaux et al. [2005] using the SPICAM (Spectroscopy for Investigation of Characteristics of the Atmosphere of Mars) spectrograph on board Mars Express. They observed an emission peak reaching 2.2 kR located at 70 km. The limiting factor for this emission is the nitrogen atom flux descending toward the atmospheric layer where N atoms recombine with O to produce NO*. They estimated this downward flux to be 2.5 × 10⁸atoms cm−2s−1, about a third of the production of N atoms by EUV photodissociation of N
2
molecules on the dayside.
Cox et al. [2008] looked for correlations between the emission peak brightness and altitude with several factors that may affect the emission rates, such as latitude, local time, magnetic field, and solar activity. They noticed that none of these factors seems to control the emission, which exhibit large variations. The data set used by Cox et al. [2008] included 21 airglow detections between August 2004 and May 2006. The characteristics (brightness and altitude) of the NO emission peak from the study of Cox et al. [2008]
Geophysical Research Letters
10.1002/2014GL062300
Table 1. NO Nightglow Peak Characteristics
Cox et al. [2008] Gagné et al. [2013] This Study
Mean peak brightness (kR) 1.2 4 5
Standard deviation (kR) 1.5 3.5 4.5
Peak brightness range (kR) 0.2–10.5 0.5–10 0.23–18.51
Mean peak altitude (km) 73 83 72
Standard deviation (km) 8.2 24 10.4
Peak altitude range (km) 55–92 40–130 42–97
are summarized in Table 1. Cox et al. [2008] compared observational emission profiles with the results of a one-dimensional chemical-diffusive model in which the continuity equations for O(3P) and N(4S) and NO
are used to determine the eddy diffusion, oxygen and nitrogen density profiles, and the vertical downward nitrogen flux.
Gagné et al. [2013] used 2275 SPICAM stellar occultations accumulated between June 2004 and September 2009 to analyze 128 detections of the NO nightglow. They noticed an interannual variability of the number of detection of the emission, linked to changes in the solar flux during that time period. The number of detections increases with the solar flux, in agreement with the paradigm of production of N(4S) on the
dayside. They analyzed the peak intensity and altitude of the NO emission; see Table 1. They explained that
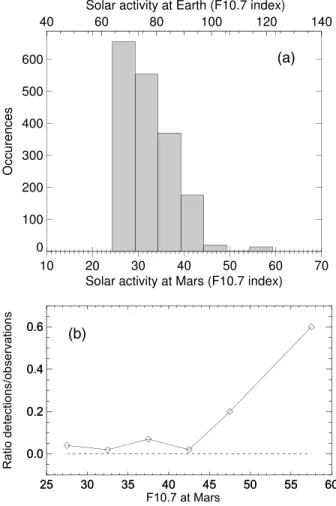
(a)
(b)
Figure 1. Distribution of the NO𝛿and𝛾bands detections as a function of solar activity. (a) The distribution SPICAM observations is shown. (b) Ratio between the positive detections of the NO emission and all SPICAM observations. Solar activity is represented by theF10.7index values at Earth and at Mars.
the mean brightness they observed is higher than the value found by Cox et al. [2008] as the result of two factors: the data set they used is larger than the data set of Cox et al. [2008] and it contains observations in various seasons covering three Martian years. The observations they analyzed were obtained in large part at higher solar activity. Gagné et al. [2013] also noticed that the peak altitude is statistically lower in the southern hemisphere. This hemispheric asymmetry was not reproduced by the LMD (Laboratoire de Météorologie Dynamique) model described by González-Galindo et al. [2009] and Lopez-Valverde et al. [2011]. No correlation was found between the altitude and the brightness of the peak. They explained that this is caused by the fact that the emission is localized in regions where downward fluxes of N and O atoms are important. In agreement with the LMD results, the detections of the NO𝛿 and 𝛾 bands are roughly located along the curve latitude = −80 sin(Ls), with outliers
(detections away from the curve) and nondetections along the curve. The LMD model also predicts a brightness at the winter poles exceeding 100 kR, which was never detected. Finally, Gagné et al. [2013] pointed out another discrepancy
(a)
(b)
Figure 2. Mapping of the nitric oxide detections. A latitude/solar
longitude map of the NO observations performed in limb scan and stellar occultation modes is presented. (a) The detections of the NO nightglow. Triangles are detections performed in stellar occultation mode and diamonds show the detection made in limb viewing mode. (b) The nondetections. Grey dots refer to the stellar occultation mode, and black dots show the nondetections in limb viewing mode. In both panels, the line represents the curve latitude =−80 sin(Ls). Less than 5% of the observations led to
detection of NO nightglow.
between the data and the model: the large variability for the altitude of the peak is not reproduced by the LMD model.
We here use detections and nondetections of the NO𝛿 and 𝛾 bands by SPICAM to investigate the dynamics of the nightside upper atmosphere of Mars. The data set used in this study covers the years 2003–2013, almost a full solar cycle. Results shown in this study will provide comparative information useful for the future observations of the Martian UV nightglow by the Imaging Ultraviolet Sprectrograph (IUVS) on board the MAVEN spacecraft and useful information for future improvements of general circulation models.
2. Observations
The Mars Express spacecraft travels along a nearly polar eccentric orbit with a period of 6.72 h, a periapsis of about 300 km, and an apoapsis of 10,100 km. The SPICAM instrument on board Mars Express is composed of both an UV and an infrared spectrometer. The UV spectrometer covers the range from 118 to 320 nm, which includes the totality of the NO𝛿 and 𝛾 bands, from 190 to 300 nm. We use measurements from the UV spectrometer SPICAM in limb profile mode, described by Bertaux et al. [2006] and Cox et al. [2008]. A typical observation lasts ∼20 min with one spectrum recorded every second in each of the five spatial bins (adjacent segments of the Charge-Coupled Device (CCD)) of the instrument. A spectrum can be collected after photons travel through either a small (50 μm) or a wide (500 μm) slit, providing a spectral resolution of 1.5 and 6 nm, respectively. The spatial vertical resolution depends on the distance between the spacecraft and the atmosphere of Mars and may be as small as a few kilometers when the spacecraft is close to the planet. The field of view of a single SPICAM pixel is 40 × 40 arc sec.
This study also includes the SPICAM observations performed in stellar occultation mode, as described by Bertaux et al. [2006] and Gagné et al. [2013]. During a stellar occultation observation, the spacecraft pointer is directed to a star, hence providing an absolute calibration of the emission by subtracting the known star brightness. The technique used to retrieve the NO emissions from stellar occultations was described by Royer et al. [2010] and developed to study the nitric oxide emissions in the upper nightside atmosphere of Venus.
These two techniques provide a large data set of 5000 observations among which more than 200 present identifiable NO emissions. In the limb viewing mode, 700 observations are contaminated by photons from the bright dayside, which is orders of magnitude brighter than the nitric oxide emission. These 700 observations have therefore been ignored in the data analysis. One hundred eleven observations do not
Geophysical Research Letters
10.1002/2014GL062300
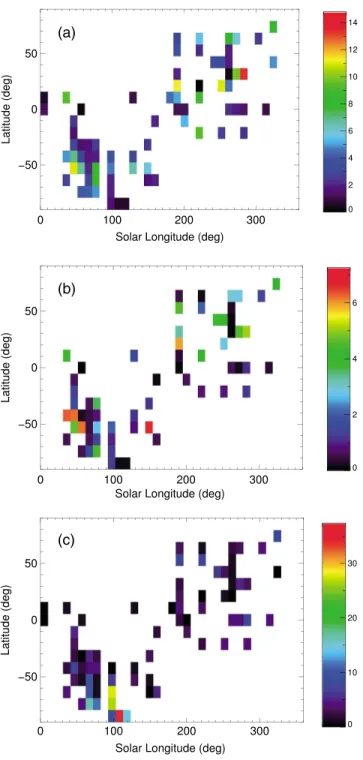
(b)
(a)
(c)
Figure 3. Mapping of the nitric oxide intensity and variability. (a) The
brightness of the peak averaged in 5◦latitude and 10◦solar longitude bins. (b) The 1 sigma standard deviation of these mean values. In Figures 3a and 3b, the color bar indicates the intensity in kR. (c) The number of observations within each bin. In this panel, the color code indicates the number of occurrences. All panels include NO nightglow observations from limb viewing and stellar occultation modes.
allow defining the peak brightness and altitude because of very low emissions, which are typically under 0.2 kR. The 1789 observations show no detectable NO emission.
3. Results
We here analyze correlations between the peak brightness and altitude and factors such as geographical location and solar flux influence. A large inhomogeneity appears in the detection of the nitric oxide𝛿 and𝛾 bands. Figure 1 shows the distribution of the observations (Figure 1a) and ratio of the number of positive detections by the number of observations (Figure 1b) performed by SPICAM in the limb viewing mode for different F10.7indices encountered
during the 2003–2013 period. We present two sets of F10.7values. The
upper axis shows the value of the F10.7
index recorded at the time of the observation at Earth. The lower axis shows the F10.7solar flux corrected
for the distance between the Sun and Mars and the solar longitude of Mars during the observations with respect to the solar longitude of the Earth. The latter values also take into account the eccentricity of the Martian orbit. Gagné et al. [2013] showed that the number of detections increases with the solar flux. This result was reproduced by the LMD simulations. We statistically confirm this long-term variability. Figure 1a shows a decrease in the number of observations as the solar flux increases. We show in Figure 1b the ratio between the number of positive detections of the NO airglow and the total number of detections, for increasing solar fluxes. This is an indicator of more numerous positive detections for higher solar activity conditions. No relation between the solar activity and the peak brightness was, however, found. The analysis of this unexpected result is beyond the scope of this paper and is a potential topic for future work.
Cox et al. [2008] showed the lack of correlation between the peak altitude and brightness. This result was then confirmed by Gagné et al. [2013]. Cox et al. [2008] found a mean peak brightness and altitude of the NO emission of 1.2 ± 1.5 kR at 73 ± 8.2 km. Gagné et al. [2013] found 4 ± 3.5 kR at 83 ± 24 km. Here we find
an average peak for the nitric oxide𝛿 and 𝛾 bands of 5 ± 4.5 kR located at 72 ± 10.4 km (see Table 1). We find identical results when using the same data set as Cox et al. [2008]. Our results are consistent with those from the study led by Gagné et al. [2013]. The altitude of the peak is consistent in the three studies. The peak brightness and altitudes range from 0.23 to 18.51 kR and from 42 to 97 km. The emission layer (from 40 to 100 km) is larger than the one (from 60 to 80 km) predicted by the LMD model [González-Galindo et al., 2009], but in good agreement with the results obtained from stellar occultations. One preliminary result found by Cox et al. [2008] is not reproduced in this extensive study: the altitude of the emission peak does not seem to be controlled by the planetocentric latitudinal position of the emission [Stiepen, 2014]. Finally, peaks in the emission profiles close to the winter poles are brighter than those near the equator.
Both SPICAM stellar occultations and limb viewing observations are represented in a latitude/solar longitude map in Figure 2. In Figure 2a, triangles represent the detections in stellar occultation mode, while diamonds are detections in limb viewing mode. In Figure 2b, grey dots show the locations of the nondetections in stellar occultation mode and black dots refer to nondetections in limb viewing mode. The analysis of the brightness at different latitudes and seasons is presented in Figure 3. In Figure 3, all observations are combined to construct an extensive data set of ∼200 detections. Figure 3a shows the mean brightness in each 5◦latitude/10◦solar longitude bin, Figure 3b shows the 1𝜎 variability of the brightness in each bin, and Figure 3c shows the number of observations in each bin.
Figures 2 and 3 summarize all observations and compare with the outputs from the LMD model [see Gagné et al., 2013, Figure 5]. The model roughly reproduces the location where the NO nightglow is detected. There are, however, many nondetections within regions where the NO airglow is predicted to be bright, and detections have been made in the equatorial region. Figure 3 shows an analysis of the variability of the emission. The LMD model reproduces well the mean brightness of the emission (Figure 3a). The mean number of observations in each bin is ∼10, as shown in Figure 3c. The standard deviation of the mean brightness illustrates the variability of the emission for similar conditions (Figure 3b). The variability can reach 8 kR, slightly less than 50% of the peak brightness of the brightest profiles. This variability cannot be reproduced in averaged simulations. The causes of this variability is unknown. Potential candidates to explain this variability include Eddy diffusion, wave drag, and changes in the global circulation. This variability is an important constraint for future developments of atmospheric models.
4. Conclusions
The SPICAM instrument on board Mars Express spacecraft has observed the nitric oxide emission in two different viewing modes: tangential limb and stellar occultations. We merged the two data sets to carry out an extensive survey of the nitric oxide𝛿 and 𝛾 bands nightglow for almost a full solar cycle (2003–2013). The nitric oxide nightglow is a tracer of the dynamics of the upper atmosphere of Mars, useful to constrain the summer-to-winter hemispherical transport. We show that the number of detections increases with the solar activity, despite a lack of correlation between the F10.7index and the brightness of the NO nightglow.
The detection rate is also higher in specific regions: they are more frequent closer to the winter pole. The detections seem to be roughly distributed along a latitude = −80 sin(Ls) curve, in agreement with LMD
simulations. The characteristics of the emission peak are analyzed, and no correlation with geographical or solar flux-related factors is found, in contradiction with conclusions from Cox et al. [2008]. We find the peak of the nitric oxide𝛿 and 𝛾 bands vertical profiles of 5 ± 4.5 kR situated at 72 ± 10.4 km. The peak brightness and altitudes range from 0.23 to 18.51 kR and from 42 to 97 km. We have constructed maps of the brightness of the nitric oxide emission and its variability, which show that the emission is highly variable, even for similar conditions, with variations that may reach 50% of the brightest profiles. This in an indicator of variations in the N fluxes at time scales shorter than a Martian year. Similarly, discrepancies in the regions of the detections between the data and the model are indicators of short-term variations of the N flux or the circulation pattern likely caused by changes in the Eddy diffusion, the wave drag, and the global circulation. These questions will be investigated in future comparisons between the data and the model. This study may also define future investigations using the IUVS-MAVEN measurements of the nitric oxide nightglow.
References
Bertaux, J.-L., et al. (2005), Nightglow in the upper atmosphere of Mars and implications for atmospheric transport, Science, 307, 566–569. Bertaux, J.-L., et al. (2006), SPICAM on Mars Express: Observing modes and overview of UV spectrometer data and scientific results,
J. Geophys. Res., 111, E10S90, doi:10.1029/2006JE002690. Acknowledgments
The authors thank the SPICAM and the Mars Express teams for the excellent quality of their work. A. Stiepen was supported by the PRODEX program of the European Space Agency (ESA) managed with the help of the Belgian Space Policy Office (BELSPO), Belgian American Education Foundation, and Rotary District 1630. Data used in this study are available from ESA planetary science archives (http://www.rssd.esa. int/index.php?project=MARSEXPRESS& page=file_tracker&reversed=on). The authors would also like to thank Jane Fox for her useful comments. The Editor thanks Stephen Bougher and Jane Fox for their assistance in evaluating this paper.
Geophysical Research Letters
10.1002/2014GL062300
Cox, C., A. Saglam, J.-C. Gérard, J.-L. Bertaux, F. Gonzalèz-Galindo, F. Leblanc, and A. Reberac (2008), Distribution of the ultraviolet nitricoxide Martian airglow: Observations from Mars Express and comparisons with a one-dimensional model, J. Geophys. Res., 113, E08012, doi:10.1029/2007JE003037.
Gagné, M.-E., J.-L. Bertaux, F. Gonzalèz-Galindo, S. Melo, F. Montmessin, and K. Strong (2013), New nitric oxide (NO) nightglow measurements with SPICAM/MEx as a tracer of Mars upper atmosphere circulation and comparison with LMD-MGCM model prediction: Evidence for asymmetric hemispheres, J. Geophys. Res. Planets, 118, 2172–2179, doi:10.1002/jgre.20165.
González-Galindo, F., F. Forget, M. A. López-Valverde, M. Angelats i Coll, and E. Millour (2009), A ground-to-exosphere Martian general circulation model: 1. Seasonal, diurnal and solar cycle variations of thermospheric temperature, J. Geophys. Res., 114, E04001, doi:10.1029/2008JE003246.
Lopez-Valverde, M. A., G. Sinnabend, M. Sornig, and P. Kroetz (2011), Modelling the atmospheric CO210𝜇m non-thermal emission in Mars and Venus at high spectral resolution, Planet. Space Sci., 59(10), 999–1009, doi:10.1016/j.pss.2010.11.011.
Royer, E., F. Montmessin, and J. L. Bertaux (2010), NO emissions as observed by SPICAV during stellar occultations, Planet. Space Sci., 58, 1314–1326.
Stiepen, A. (2014), Dynamics and composition of Mars and Venus upper atmospheres observed by the ultraviolet spectrographs on board Mars Express and Venus Express, PhD thesis, Laboratory for Planetary and Atmospheric Physics, Univ. of Liège, Belgium. [Available at http://bictel.ulg.ac.be/ETD-db/collection/available/ULgetd-03192014-163601/.]