Publisher’s version / Version de l'éditeur:
Journal of Applied Chemistry, 14, pp. 87-93, 1964-02
READ THESE TERMS AND CONDITIONS CAREFULLY BEFORE USING THIS WEBSITE. https://nrc-publications.canada.ca/eng/copyright
Vous avez des questions? Nous pouvons vous aider. Pour communiquer directement avec un auteur, consultez la
première page de la revue dans laquelle son article a été publié afin de trouver ses coordonnées. Si vous n’arrivez pas à les repérer, communiquez avec nous à PublicationsArchive-ArchivesPublications@nrc-cnrc.gc.ca.
Questions? Contact the NRC Publications Archive team at
PublicationsArchive-ArchivesPublications@nrc-cnrc.gc.ca. If you wish to email the authors directly, please see the first page of the publication for their contact information.
NRC Publications Archive
Archives des publications du CNRC
This publication could be one of several versions: author’s original, accepted manuscript or the publisher’s version. / La version de cette publication peut être l’une des suivantes : la version prépublication de l’auteur, la version acceptée du manuscrit ou la version de l’éditeur.
For the publisher’s version, please access the DOI link below./ Pour consulter la version de l’éditeur, utilisez le lien DOI ci-dessous.
https://doi.org/10.1002/jctb.5010140206
Access and use of this website and the material on it are subject to the Terms and Conditions set forth at
Sorption of water on compacts of bottle-hydrated cement. I. The
sorption and and length-change isotherms.
Feldman, R. F.; Sereda, P. J.
https://publications-cnrc.canada.ca/fra/droits
L’accès à ce site Web et l’utilisation de son contenu sont assujettis aux conditions présentées dans le site LISEZ CES CONDITIONS ATTENTIVEMENT AVANT D’UTILISER CE SITE WEB.
NRC Publications Record / Notice d'Archives des publications de CNRC:
https://nrc-publications.canada.ca/eng/view/object/?id=75cb641b-4506-4d09-bcca-ab3670a527d4 https://publications-cnrc.canada.ca/fra/voir/objet/?id=75cb641b-4506-4d09-bcca-ab3670a527d4,
Ser TH.1 N21r2no.
218 c . 2-
r.9
NATIONAL
RESEARCH
COUNCIL
bkl
k: b A.C A N A D A
DIVISION O F BUILDING RESEARCH
SORPTION OF WATER
ON COMPACTS O F BOTTLE
-
HYDRATED CEMENT
I. THE SORPTION A N D LENGTH
-
CHANGE ISOTHERMS
11.
THERMODYNAMIC CONSIDERATIONS AND THEORY O F
VOLUME CHANGE
R. F. FELDMAN AND P. J. SEREDA
"
REPRINTED FROM
JOURNAL O F APPLIED CHEMISTRY, VOL. 14, FEBRUARY 1964, P. 87
-
104RESEARCH PAPER NO. 218 O F THE
DIVISION O F BUILDING RESEARCH
PRICE 2 5 CENTS
OTTAWA
This p u b l i c a t i o n
i s
bein8 d i s t r i b u t e d by
t h e Divieion of Building Research of t h e N a t i o n a l
Research Council as a c o n t r i b u t i o n towards b e t t e r
b u i l d i n g i n Canada.
I t
should not be reproduced
i n whole o r i n part, without permission of t h e o r i -
g i n a l p u b l i s h e r .
The D p r i s i o n would be glad t o be
of a s s i s t a n c e i n o b t a i n i n p such permission.
P u b l i c a t i o n s
oft h e Division of Building
Resear-ch may be obtained by m a i l i n g t h e a p p r o p r i a t e
remittance,
( a3ank, Lxpress, o r Post Office Money
Order o r a cheque
rr.ade7aya.ble a t par i n Ottawa,
t o t h e Receiver General of Canada, c r a d i t N a t i o n a l
Research c o u n c i l ) t o +,he K a t i o r a l Research Council,
Ottawa.
S t m . p are not acceptnbl-e.
A
coupon system has been introduced
t o
make payments f
01-p u b l i c a t ions r e l a t i v e l y simple.
Coupons a r e a v a i l a b l e i n denominations of
5,
25,
and
c a n t s ,
and may be obtained by making a re-
mittance a3 i n d i c a t e d above.
These coupons may be
used f o r t h e purchase of
a l l N a t i o n a l Research
Council p u b l i c a t i o n s i n c l u d i n g s p e c i f i c a t i o n s o f
t h o
Canadian Government S p e c i f i c a t i o n s Board.
Reprinted frsni the Jo~crnal o f Applied Chernistly, 1964, V o l . 14, pp. 87-93
SORPTION OF WATER ON COMPACTS OF BOTTLE-HYDRATED
CEMENT. I. THE SORPTION AND LENGTH-CHANGE ISOTHERMS
By R. F. FELDMAN and P. J. SEREDA
To obtain information wit11 regard to the porous structure of hyclratcd ccmcnt and the cstcnt o[ its intcraction with watcr, sorption and Icngtli-changc isotherms wcrc dcterl~unccl for this material. Compacts of bottlc-hydrated ccmcnt wcrc brought to cq~lilibriuln in a high-vacuum system a t various l~umiclitics, and mcasurcmcnts of thc changcs in length and wcight during this process, were made to draw thc isothcrms.
Rcsults showed t h a t this systcm is basically similar to systems composcd of othcr porous materials, although complicated by a discontinuity in the adsorption part of the cyclc and a scconclary hysteresis. I t is considered t h a t thcsc charactcristics are related and arc thc result of watcr associated with thc systcm by a proccss othcr than physical adsorption.
I t is also sho\vn t h a t menisci cxist in the system on dcsorption to as low as 31% 11.1-1. and cause considerable contraction. A surface-arca calculation by a new method for estimating t h c zcro ad- sorbed water yield a value of 80.6 m.2/g.
Introduction
In the past, sorption isotherms determined for a great variety of porous materials have yielded invaluable information about the physical state, surface area ancl pore sizes.1 The usefulness of such isotllerms needs no emphasis, especially when water is used as the adsorbate. Similarly length-change isotherms have becn determined for a number of porous systemst-4 ancl these have been used to provide additional illformation concerning the interaction betweell adsorbent and adsorbate.
Although the shape of tlie isotherms gives some indication regarding the possible inter- action between a d s o r b e ~ ~ t ancl adsorbate, in cases such as the hydrated-cement-water system, the hydrates of cement begin to decompose as tlle water-vapour pressure is decreased to zeio, so that it has not been possible by measuring weight loss alone to differentiate accurately between sorbed water and hydration water. Recently, however, i t has beell sllown,Vhat by incor- porating length-cllange measurements rvitll the sorption measurements at low vapour pressures, i t is possible to locate the transition point between sorbed and hydration water.
Although a number of ~vorlters have reported results of sorption ancl length-change measure- ments on the hydrated-cement-water syste111,~-~ their results for the complete isotherm arc difficult to interpret because oi the rather arbitrary cletern~ination of the datum point (zero adsorbed water). Where length-change measurements mere conclucted, these usually involved only the first drying from the saturated state and seldom included the conlplete range of relative humidities for the adsorption and desorption cycle.
In the present ~vorlt, results were obtained for the sorption ancl length-change isother~ns
~ J J taking equilibrium points from relative vapour pressures (PIP,) of 0.072 to 0.0982 on
adsorption and 0.742 to 0.079 on desorption. Experimental
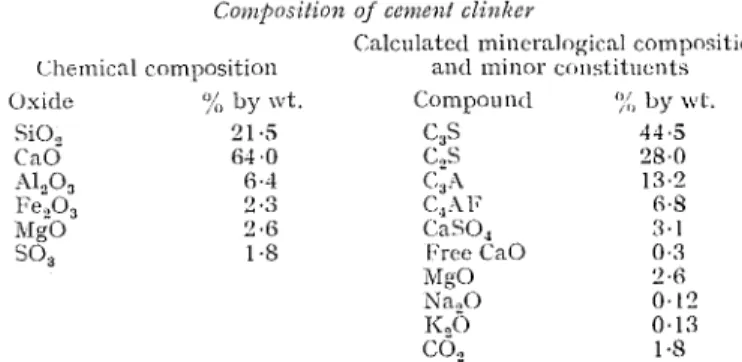
Compacts formed at a load of 5000 lb. in a moulcl 1.25 in. dia. froin bottle-llyclratecl cement paste were used to make the samples for these experiments. The procedure for malting tlie compacts and the sanlples has been clescribecl p r e v i ~ u s l y . ~ The sample of bottle-hydrated cement pastel0 was obtained througli the courtesy of the laboratories of the Portland Cement Association. The composition of the clinker is shown in Table I: it is a Type I cement. \Vl~en hydrated in this way the cement paste remains as polvcler of less than I p particle size; S-ray diffraction results on similar samples of bottle-hydrated ceillents indicatecl, within the accrlracy possible, that after 90 days' hydration, the clinlter was completely hydrated11
Previous work with compacts of different materials has show11 that these can be rnadc reproducible (void fraction) ancl as they are no more than in. thick they attain equilibrium cluickly. I t is these desirable cllaracteristics that prompted the use of compacts in the study of the properties of hydrated Portland cement paste. Results obtained with coinpacts of othcr materials also confirm that coillpacts of hydrated cement will be reasonably represcntntive of normal hydrated paste having the same void fraction and similar pore sizes.
Apparatus
The high-vacuum apparatus used for this work was designed to expose 12 samples simulta- ncously for long periods to the same vapour pressure conditions, with exclusion of air. Six of these samples were mounted in individual tubes on quartz spirals of the McBain-Bakr type
FEIIDd6AN 6 SERBDA-SORPTION O F TYATEI? ON CRlldBNI'. 1
Table I
Calculatctl mincmlogicnl composition (Ihc-rnil:nl composition mitl minor co~~st.itucnts Oxitlo %, by wt. C:ornpou ntl ';:, by \vL. SiOI 21.5 C,S 41.5 CaO G l .0 C,S 28.0 Xl,O, 6.1 C,.4 13.2 l:e,O, "3 C,X 1: 6 . 3 hIgO 9.6 (:aSO,, 3.1
SO, 1.8 I'rc.e CaO 0.3
&IgO 2.6
Na,O 0. lil
T<?O 0.13
C 0, 1.8
:uicl gave valncs of the mcigllt changes to a sensitivity oi 2.6 X lo-" g. Thc remaining sis samples wcr-e niouiltccl on mo(lificd Tuc1;erm:ul optic:~l cstc~isorncters ant1 placccl in individual cells q u i p p e d wit11 optical nrindo\vs.12 This dctrrminccl the din~cnsioilnl changcs with cliangcs in vapour prcssur c to a scniitivity of 2 x 10-'I in./in.
A thrcc-stage oil tlillusion pump 11acl;ed by a rotary vacunm pump was used to obtaiil lxcssurcs oi lo-" 111111. 'I'hc atlsorbatr was iritrocluccd into the systein from a bull) immcrscd in a bat11 that conlcl be controllccl at tcmr~craturcs l~etwcen O0 ancl 7 0 " ~ lvithin 0 . 1 " ~ . The saillules wcrc maintained at 70'1; 11y immersing thc lower ends of the tuhcs ancl cells containing the samples to a depth of 12 in. in a controlled 1)ath. 1'Cooin tenlperatnre was coiltrollccl at 7 3 & 1 ° ~ . Procedure
The samples measuring about 1; X;
x
T', in. were cut from the coinpact ancl mounted, onc on the extensometer ancl the other 011 the quartz spiral. Degassing of t h e samples wasachievecl by evacuating simultaneousl~~ through a manifold. A clrp-ice trap was used together with the thrce-stage diftusion ancl rotary punips and the degassing continued for 8 days.
Adsorption was effected by allowing the manifold to attain a R.H. of 7.2% by the control of the temperature of the bath in which tlie water source was immersed, and esposii~g th c samples sinlultaneously to this humidity. This procedure was continued for equilibrium points up to 98.2% R.H. Three days were allowecl for equilibriunl to be attained betlveen points below 225% 1i.H. ancl up to 7 days for points a t higher humiclities. Fifteen 11. of constant weight always elapsed before the system was co~lsiclered to be in equilibrium. The desorption pro- cedure follolved in the saine manner, approsi~natelp 7 days being allolvecl for equilibrium between points. X total time of 4 months was taken for the cleternlinatiorl of the whole iso- therm.
Results
.4 dsor)tio?t
Fig. 1 sholvs the complete isotherm. Actual rcsults arc given in Table 11. Point A
rcprcxnts the point to \vhich the sa~nple hacl been dried aiter 8 day's evacuation; point I3 Table I1
Letzgll~ chrct~ges rozd ~~aoastuve c o ~ ~ t e t z l s L J Z cnlcz~lr~l~orz of arlsovpilo~z isollrevrrz
Adsorption Desorption
- - -- --
hloisture, Length hloisturc, Lengtll
p/po
'i6
change, % PIPo % change,7;
0.0723 1.12 0.0808 0.742 10.25 0.341 0.0882 1 GO 0.0892 0.608 9.30 0.313 0.137 1.91 0.111 0.492 8.35 0.280 0.176 2.15 0.123 0.419 7.70 0.27 1 0 210 2.36 0.13G 0.358 6.97 0.261 0.255 2 69 0.151 0.329 5.87 0.26 1 0.316 5.21 0.183 0.316 5.19 0.261 0.371 3.67 0.215 0.284 4.82 0.256 0.437 4.17 0.243 0.177 4.10 0.234 0.494 4.52 0.261 0.122 3.64 0.210 0.57 1 5.28 0.285 0.093 3.16 0.186 0.709 6.71 0.317 0.079 2.99 0.177 0.873 9.75 0.349 0 2.10 0.132 0.982 12.55 0.366
represents the datum point,%nd is consitlered henceforth as tlle true point for zero adsorbccl water. The aclsorption curve is smooth ancl concavc to the pressure asis until point C is reached; l ~ e r c a distinct discontinuity occurs, and this is at 1I.I-I. between 23 and 25%. The curvc then 1)ecomes concave again until 50();, R.H. is reached, when the isothern behaves like a uormal '1-ypc-I1 or Type-IV isot11erm.l
Fig. 2 presents the results for the dimensional change as a function of relative hunliclity.
1.1,
R,
C , ctc. represent the equivalent points as on Fig. I . The curve is again concavc to tlle p e s w r e axis betn~ecn Ti and C, ancl a tC
the tliscontinuity again occurs in an eve11 more distinct form than is shown in the sorption curve. Above. ;~pprosimnlcly 35'); R.I.I., the curve co~ltinucs concave to the pressure axis up to 95.2% R.1-I.0 0 2 0.4 0.6 1.0
P I P , P I P ,
Pig. 1. .70)1p6ioti i s o t h ~ ~ t ) ~ joy C O I I I / J N C / oj Fig. 2. L e t ~ g / l ~ clln)2gc i s o / l ~ e t . ~ ~ i for I~~~t/i.cr/ctI coirc?l/ cotxpnct o j I ~ ~ y r l ~ n l e d cettlc.~tt 0 adsorption points @ clesorption points 0 adsorption points @ desorption points
I)esorl)tio.~t
On Fig. 1, a gradual weight loss is s1ion:n from D to E for the clcsorption curvc, a large primary hysteresis being apparent. Reyoncl T5, horvever, a t R.H. 35-84:, a large weight loss occurs; this continues until
F
is reached between 30 ancl 31") R.H. Desorption continues at lower humidities between F ancl C; in a similar manner as the corre4ponding adsorption part of the loop RC.G
is the datum point, the point for zero aclsorbed water located for the dcsorption curve. -4 secondary hysteresis, the non-rejoining ot the loop after priinary hysteresis, is apparent. Continuecl degassing produces fil~ally point J, rvl~ich is slightly below l3, the zero point for the adsorption part of the cycle. T,ength changes (Fig. 2) show a continual contraction betweenI) ancl
E,
but between E and F where a large weight loss occurrecl, there was no change in lengtll. From F to C; contraction again occurrecl, producillg a curve similar to the aclsorptio~l curve, concave to the pressure asis. Point J is considerably belon7 point B. In this length- change isotherm then, the primary and seconclary hysteresis are again exhibited ancl the points(; ancl B are apart.
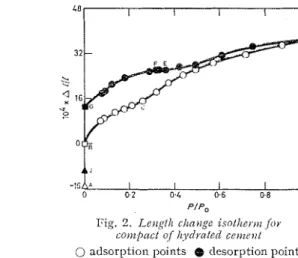
Once the length change ancl sorption ecluilibriuill points with respect to vapour pressure are establidlecl, the most useful relationship in terms of interpreting data is the weight change (4WIU') vs length change (4111) plot, shown in Figs. 3(a) and 3(b). Again A , B and C represent the same points as on Figs. I ancl 2. I-Iere AB is dra~vn linear, as cliscussecl in a previous paper." Continuing from
R,
it is observed that the plot is linear beyond C. This linearity occurs up to. approsimately 30% R.1-I., after which an increase of slope occurs. This increase in slope is \vcll illustrated in Fig. 3(b), \vl~ich is an enlarged section of Fig. 3(a). I t is observed t h a t this region is where the discontinuity and change in slope occurred (Figs. I and 2). After approximately 5QC)/:, R.H., the slope of the curve decreases continually as D is approached. The region Dl<, \vhere weight loss occurs somewhat gradually with relative pressure, sho~vs a very great con- traction for unit weight loss. This is the region of primary hysteresis and is greatly emphasisccl by this plot. E F , the region where the primary hysteresis is completed, shows no length change.'h
careful study of the primary hysteresis in other inaterials2~ 3 9 l5 has producecl similar results. ,.
1 he large contraction in the prinlary hysteresis region DTi is esplaiiled by the forniation of ~nerrisci in the pores n~hich inlposes a compressive stress on the material. TVheii these nlenisci
FELDlMA N & SEREDA -SORPTION OF TTA T E R ON CEIMENT. I
Fig. 3(a). Plot of leizgth change C L I , L S L J L ~ f i ~ i r z S O ) ) ~ L O J Z or1 cor)~pnct
of
I~ytlrntr~tl cc.~iier~t (b). Eizlr,boetE s e c t ~ o r ~ of plot lrr I71gnre 3(a)0 adsorption equilibrium points @ dcsorptio~l cquihbrium points
e desorption dynamic points
empty, the stress is released and the sharp rate of contraction halted. In some materials an cs- pansioll actually occur^.^^
"
l3 I n this systcm there is a constant length as sl~own along EF.Along F G surface desorption continues; between 20:/, R.H. ancl zero adsorbecl water at G , t h e cur1.e is linear, the slope of tlic line being only slightly less than RC for adsorption. Thus in t l ~ e region EF there is a balance of forces: contraction clue to a recluction in spreading piessure of the adsorbeel film anrl expansion clue to the rclief of the conlpressive stress of tllc menisci. Thc lrleasurements of length change thus vcrify that the loss of water bctween EF is tlle emptying of pores and that this process finisl~cs betrvecn 30 ancl 31% R.H.
Despite the large secondary h~stercsis as observecl in Figs. I and 2, the plot of (Al/Z) 1,s
(Aw/w)
in Figs. 3(a) and 3(b) inigllt be misleading ancl taliell to inclicate t h a t the loop is re-joined. This is not the case; the two zero points R ancl G, for the respective aclsorption ancl clesorption regions of the loop, are consiclcrably clisplaced, as shown in Figs. 1 and 2. When the desorption is continued, ho~ve~rer, until the (ATVlTV) is equal to that a t B, approsimately a t point J, i t is seen that the length is considerably below that a t point B, b y 0.094%. Thus, cluring this aclsorption--clesorption cycle, or first rc~vetting-seconcl drying cyclc, an irreversible shrinkage has taken place. The slopc of thc curvc (ill/l)/(AW/TV) during clesorption from G to J is greater tllail the slope from F to G ancl both curvcs have linear portions."
Surface area cnlculatio?z
Computation of thc surface area b y tllc E.E.T. mctl~ocl,~ assuming the watcr moleculc t o occupy an area of 10.8 b3, yields a valuc of 80.6 ~ n . ~ / g . T/m, thc weight of adsorbaic requirecl t o complete one monolaycr, was a t 1I.H. 18.5':{,. T avoid using t h e part ol tlle sorption isothcrin in the region wherc the clisconCiuuity occurreil, thc R.I<.'I', calculation was only applied in t h e R.H. range up to 21.0%.
Pore-size distribution cnlcuZatio?z
FELDll/IAN 6 SEREDA-SORPTION OF VVATElt ON CEll/IBNT. I 91 where it is assumed that the adsorbate completely wets the solid and that on any point on the clesorption isotherm all pores have an adsorbed film of thicliness t, which inay vary with pressure of adsorbate $. G is the surface tension of water ancl ill its nlolecular ~veigl~t. All pores smaller than radius Xi arc completely filled by adsorbed water, ancl for a filled pore with a radius of
R i ,
the meiliscus is assumed to have a radius of (Xi-t). The value of the thickness of the ad- sorbed layer t as a function of pressure was estimated from the adsorption isotherm ancl it was assumed that the tllicliness of the strongly adsorbed layer does not esceed two ~nolecular diameters. Equation (1) was applied to the desorption curve irom the isotlierm for R.H. values between 30 and 95%. This distribution is shown in Fig. 4, a cumulative plot of pore volume vs pore radius. All pores smaller than radius Xi are completely filled by aclsorbecl water. This pore distribution extends clown to a pore radius oi 12.2X,
with 650,; of the pore volume being coinposed of pores smaller than 30.P
radius.40 80 120 160
R;, f
Fig. 4. Plot of ~ O Y E - s i z e dist~ibz~tioiz
Discussion
I t should be cmphasised that the results presented l ~ e r e apply to one sample ol bottle- hycll-atecl cemeilt iormecl into rigid samples by compaction. Direct comparison o i these results of other worlcers who have used normally liyclratecl cement paste is not: possible because the two systems are different. I t is consiclerecl, however, that any of the fundamental conclusions will apply to both systems.
The results of this work show that tlle sorption length change relationships are basically similar to those of other porous materials; a large proportion of the length changes occur ill the low vapour-pressure region of the isotherm. The (Alll) vs (ATVIW) plot for adsorption is linear for 1-2 molecular layers ancl can be estrapolated through zero; a decrease in slope occurs a t higher humidities. These results were also observed for the adsorption oi water on Vycor glass,2 'Cab-0-Sil' silica ancl precipitated calcium c a ~ b o n a t e , ~ and calcium sulphate llemil~yclrate.~ 'This indicates that volu~ne change in the system of hydrated cement is associated with the sorbed water and is not due solely to movement of water in to or out of the crystal lattice as has been s~~ggestecl.~
The adsorption part of the loop is complicatecl by the discontinuity at C. Beyond C, which occurs a t approximately 25% R.H., the increase in slope of the (Alll) vs (AWIW) plot indicates that another process is talcing place by which sorption has occurred, producing a different relationship between (Alll) and (AWIW).
The points representing zero adsorbed water, G and B, (Figs. 1, 2 and 3a) for the de- sorption and adsorption parts of the loop do not coincide, although the (Alll) vs (AWIW) plot for the desorption below 20% R.H. is again linear, and its slope is only slightly less steep than that for the corresponding adsorption region. The separation of G and B illustrates the secondary hysteresis, where the adsorption and desorption parts of the loop clo not coirlcicle in the region
below 30% R.H. ~vhcre the primary hysteresis encls. In order that point B nlay again be attained to coinplete the cycle (Figs. I and 2) further degassing of the system is requireel. Tllis is shown as GJ on Figs. 1, 2 ancl 3(a). The (A1/1) vs (AW/T*V) plot of (;J indicates a linear path but of steeper slope than that of BC or
GF.
Point C;, the transition point bctween the two linear portions, has been consiclered as the point of zcro aclsorbecl water for the clesorption part of thc cycle. Thus the water representecl by GI? (Fig. 1) has been irreversibly sorbed cluring the sorption cycle. I t is consiclered that there is a relation between the water lost bet~vecn GI? ancl the sorbet1 water wllich resultcd in the cliscontinuity a t C. This nlill be cliscussed further in a later papcr.1)esorption along DB (Pigs. 1, 2 ailcl 3a) gives evidence of coutraction clue to compressive menisci forces, whcre a large primary hystercsis is obser~~ecl. Along EF these menisci are emptying; fro111 Fig. 3, it is seen that all the capillaries have not emptied until approximately
30--31(x, 1i.H. has bee11 reachccl. Tllc porc-size distribution calc~~latccl from this dcsorptiou isotlicrnl yiclcls a result that places most of the pores betwcen 12 ant1 14
b
raclil~s. As yet it has not bccn ol~scr\~ctl tllnt the prinlary hysteresis cstencls to sucll a low relative hlunidity for normally hydratetl cement. Thus the computed pore radius for this system is somcwhat smaller tllan has previonsly bcc11 reported for nor~nnlly hyclratecl cei~lent,~" where it was suggestetl that tllc prinlary hysteresis estcnclcd to 40--45% R.H. I t was also consiclerecl that a water column under tcnsion in n capillary c:~llnot esist u11c1cr a tcnsion greater than approsimately 1000 at~nosl)llcrcs. 'This conclitio~l is sulpassetl at 4,5'%, 1C.H. Worli 011 thc aclsorptiorl of water 011 othcr p o r o ~ ~ s ma.tc:rials, l~o~vc\:cr, has sho\vn capillnry contlcnsatio~l a t clrcn lo~ver relativeh i u r n i ~ l i t i e s . ~ ~ ~ Conclusions
( I ) Surfacc al-ca calculations I)\? thc l3.E.T. mctllod from r c s ~ ~ l t s obtainecl with thc new nlithod for determining adsorbed \vatel- has yielcled a figure of 80.6 n ~ y g . , but when the value for evaporablc water determined by the conventional lnethocl of drying a powdered sample is usecl, a surface area of 141 m."g. nns founcl. This clifference is large and points out the sig- nificance of the llerv lnetllocl for clcterminine adsorbed water. I t is evident t h a t the bottle- "
hy[lratecl cement used in this ~vorli is in fact clifferent, from the stanclpoiilt of surface area a t Icast, from normal hyclratcd paste for which other workers have given a surface area of about 220 m.Vie. , u
(2) A cliscontinuity in the adsorption part of the loop oE the isotherm is observed at approsi- mately 2576 R.H. I t is concluclcd that this is rflatecl to the secondary hystcrcsis, which is present in the adsorption clesorption cycle.
(3) A "rimary hysteresis esists clown to approsimately 30-31':/0 R.H. ancl this produces n sharp contraction in the region ~vhei-e it exists clue to compressive menisci forces.
(4) For both aclsorption ancl clesorption, a linear curve is obtainecl for the (illll) vs (ATV/TV) plot a t low humidities, and can be cstrapolated through zero. This is similar to results for othcr polous materials ancl is considered clue to physical adsorption.
(5) A significant portion of the cspansion during sorption takes placc in the low relative pressure region. X total of appiosimately 0.36'2, occurs betwcen 1i.H. 0 and 9S.Z0,.
Summary
A compact of bottlc-hyclratcd cement was fabricatccl a t a load of 5000 1b. in a moulcl 1.250 in. dia., ancl sorption and length change isothern~s werc obtainccl by measuring eqiii- librium points betwcen 7.2 ancl 98.2% R.H.
,
.
l h e results show that the sorption-length changc relationship, i.e., the (illll) vs (AWIW) plot, is linear for one to two molcc~~lar layers and call hc extrapolated tl~rougb mro; at higher l~umidities a clecrcasc in slope is observccl. This is basically similar to the results for othcr porous materials ant1 sho~vs that \~olunlc change in the hyclratcd-cement-water system is associa- tecl with the sorbed water ancl not due solel57 to movement of water in to or out of the crystal lattice.
The adsorption part of the isotberm is complicatec1 by a cliscontinuity a t approx. 25'j{, R.l-I. This discontinuity is consiclcretl to bc thc result of watcr associated lvith thc systenl by a process othcr than physical adsorption. I t is also tllought to bc related to thc large sccondary hysteresis observecl on the clesorption part of tllc isotherm. Supporting evidence for illis is shown in the
I;ELDII,~AN G SEREDA-SORP'l'ION OF W A T E R OAT CEMENT. I1 93
Evidence is shown in both the length change ancl sorption isotherms that a primary llys- tercsis esists to as low a humidity as 31%). Contraction in the region wliere this hysteresis is ;~pparent is esplained by compressive menisci forces.
i\ surface area calculation by the B.E.T. method using a datum point locaictl froill the
(ill14 vs (4W/MT) plot as the point for zero adsorbetl \\later yicltlctl a figure of 80.6 m.?/g.
Acknowledgments
The authors are grateful to Mr. N. R. Grecning of thc Portlancl Cement Association \\rho supplied the sample of bottlc-hyclratetl Portland cement and also wish to acknowledge tlie valuable assistance of hlessrs. H. I;. Slatle ancl S.
IS.
1)otls in setting u p tllc apparatus ant1 recording the information. This paper is publishetl with tllc approval of the Director of the T)ivision of Building Research, National Research Council, Canada.National Research Council,
Di\,ision of I3uilclirlg Research,
Ottawa, 2,
Canada
Received 35 hlarch, 1963; amended manuscript 19 Septcmbcr, I963
References
'
Brunauer, S., 'Thc Adsorption of Gascs ancl Powers, T. C., J . . / I P I I c ~ . C E Y C Z J J I . .COG., 1958, 41, 14 Vapors', Val. 1, 'PhJ'sicnl Aclsorption', 1913, I<alousclr, G. T2., J . f11tr~r.Coucr. I ~ s t . , 1954,26,233 5 l 1 p p (Princeton University Press) lo Brunaucr, S., I<antro, D. L., & Copeland, L. I.;., :\mberg, C. H., & i\iIcIntosl~, Ti., Cnlznrl. J . C k e ~ ~ r . , J . Aillei.. C ~ E I J I . Soc., 1958, 80, 7611952, 30, 1012
2 Sereda, p, J., L9c l;cld,,lau, 1;. F., J , Rpp/. C]reI Greening, N., prilratc cOmnl~llicatiOn
1963, 13, 150 Feldman, R. I;., R3 Sercda, P . J., J . I ~ . I I ~ P Y . COJIC).. b'cldman, R. l:., ~ 9 c Sereda, P. J., J . nfipl. C l t e ~ i ~ . , I I I S ~ . PYOC., 1961, 58, 203
1963, 13, 158 l3 W i g , E. O., & Juhola, A. J., J . A I I I E Y . c11ei11. Soc.,
l'cldman, R . IT., & Sereda, P. J., J . a$pI C ~ I F I I I . , 1919, 71, 561
1963, 13. 375 l 4 Powers, T. C.. 3rd Int. Congr. of Precast Tn-
"Iutron, li., Awir. 7'1/(4v. p1~1~1. 13eZg., 1931, 35, dustry: 171undamcntal i\spccts o i the Sl~rinlcage
213, 317 of Concrctc (Stockholm), June, 1960
'
TTallcr, P., Eitlg. l l I ( ~ t . Priif. :1~11stnlt (IC.!lY.P.A.), l"l~il~ara, M . , & Nalcatsu, I<., Urtll. chent. Soc. Ziirick, IIi.shu.~.sioi~sheu., 1940, KO. 124 J n p n ~ ~ , 1959, 32, 903Rcprintetl fro111 the Jolrmnl oj Appliecl Chatlistry, 1964, Vol. 14, pp. 93-104
SORPTION OF WATER ON COMPACTS
OF BOTTLE-HYDRATED
CEMENT.
IT.*
THERMODYNAMIC CONSIDERATIONS AND THEORY
OF VOLUME CHANGE
By R. I?. FELDMAN atid P. J. SEREDA
I n order t h a t t h e hydrated-cement-\vater sorption m a y b e adequately analysed, t w o tllernlo- dynamic processes connected wit11 t h e material, encountered i n adsorption, arc discussed.
T h c B.E.T. surface arca computed b y t h e use o f a moclilicd l o r m o f t h e Gibbs adsorption equation, is found t o b e i n close agreement w i t h t h e valuc obtained b y a n expcrirnental ~nctliod o f determining zero adsorbed water. T h e surface area calculated f r o m t h e pore-size distribution is also i n agreement w i t h these values. I t is found t h a t over t h e range o f vapour pressures f r o m 0 t o 25% t h e Gibbs adsorption and E a n g h a m equations are obeyed.
Eeyond 25% 12.1-1. physical adsorption and t h e rcadnlittailce o f t h e interlayer h y d r a t e water o f tricalcium silicate occur simultaneously. T h e secondary llysteresis observed i n t h e sorption isothcrnl ant1 other anomalies previously observed i n t h e s y s t e m are cxplainecl w i t h these data.
hlechanisms o f volume changes for t h e whole e x t e n t o f t h e isotherm are presented; thermo- dynamic equations arc applied t o different regions o f t h e isothcrin t o express t h c volunle changc and spreading force developed i n t h e system during sorption. These are compared xvith those used i n other volume-change mechanisms described for t h i s s y s t e m and t h c tl~errnodynamic collsistency of these is discussed. Calculations o f Y o u n g ' s modulus f r o m t h e above equations lead t o t h e conclusion t h a t t h c values obtained arc o r t h c individual elements o f t h c b o d y and t h a t as such t h e y will yield values larger t h a n thosc obtained lor t h e b o d y as a whole.
*
Part I : preceding paper.94 FELDMAN 6% SEREDA-SORPTIOAT OF W A T E R OAT CEMENT. I I
Introduction
Sorption and lcngth change isotherms for this system have been presented and discussecl in the preceding paper., Tl~ermoclynamically clcrivecl equations are no\\? applied to thcsc rcsults ancl their significance discussecl \\lit11 respect to the fundamental theory.
In the interpretation of the rcsults obtainecl it is recognisecl that ccinent gel as adsorbcnt is conlposed ol very f nely divicled crystals. This finely divided system represents a state of unstablc eq~~ilibrium, ancl it is apparent that the only tl~erinodynamic stable state of the system is that ol minimurn surface energy in \vllich t11e small particles ha17e recrystallisecl to a single large unit. 7.
I hc tl~crrnodynamics of finely clividcd crystals is complicated by the fact that parts of eve11 a single crystal are not, in general, in cquilibrium with the \vhole; the rigidity of a crystal, \\rllich prevents the recrystallisation of the system, may also prevent internal adjustments essential to the equilibrium of the crystal.
In describing the thermodynamics of adsorption of a illonodisperse liquid as adsorbent wherc the esistence of complete cquilibrium of the adsorbent in all parts of the system can 11c assumecl, Copcland & Young+vere able to ignore the non-equilibrium state inherent in a ~owderecl adsorbent. A furthcr work3 showecl t h a t an aclequate understanding ol a particular system involving a powdered aclsorbent coulcl be achieved when the thermodynamic functions lor this systcm \\rere defined as being cqual t o those in n process involving a monodisperse adsorbent in ~vhich truc equilibrium coultl be achic\ied.
Analysis of the adsorption process
Two thennoclynamic processes arc considcrcd: Thc integral process
it, A
-t
4z2 B -> (system composcd on iz, molcs of B adsorbcd on iz, rnoles of A)...
(1)Thc differential proccss
n, B (gas) -t (12, moles of B adsorbed on A, where iz,/iz, is concentration of R on A and
remains constant)
...
(2)In the integral process n, moles of adsorbate B are aclsorbed on a finite amount iz, of
adsorbcnt A; thc composition ol the systcm is thus cllanging.
In thc differential process, ho\vever, 12, moles of R , the adsorbate, aclsorb on an infinite
aillouilt of adsorbent A. The concentration is already iz, moles ol adsorbate for eacll 11, mole of
adsorbent. Thus the composition ol B on A \\rill remain constant.
If 13 is n nearly perlcct gas, thc free-energy change ior the differential process is
h G = n, R T 111 PIP,
...
(3)ivhcrc
I J , is thc saturated vnpour pressure of the adsorbate
B
a t thc temperature Tand
P is thc vapour pressure of the aclsorbate B in the differential process.
I n this differential process, it is noted that ivith coilstant conlposition ol molcs ol 73 on A,
P
must also of course rcinain constant. This point \\rill be brought up later.For t11c intcgral process the Gibbs adsorption equation represents thc decrcasc ol surface frcc energy (Ay) (luring thc proccss. In this cquation, \\illere o is tllc surfncc area of thc adsorbcnt,
I t is assumcd that thc adsorbate is a perlect gas ancl that there is no alteratioil in surface area tluring thc proccss, but t11c aclsoi-bent-aclsorl~ate surface energy chal~ges during the process. 'Tlius in the lundarncntal equatioil an extra term appears for the variation of t h e free energy of the "surface-phase" (that portion \\~hich comes under the influeilce ol surface lorces) compared \\~ith the equation for a homogeneo~~s bulk phase. 'The coilcentration ol aclsorbate is given wit11 rcspcct t o the surface area of the adsorbent.
Ilydrated-cement-water system
,
.
I h c process of adsorption ol watcr vapour on thc surlace ol l~\~drntccl ccment is an integral
FELDMAN & SEREDA-SORPTION OF W A T E R ON CElWENT. 11 95
l z l jhyclratcd cement]
+
n, [water] -> [system of nl moles hydrated cement*+
7 1 ,...
moles of adsoi-lxd water] ( 5 )
Figs. 1 and 2 of an earlier paper1 represent this process, sho~ving sorbed water and lcngth change as a function of the relative vapour pressure. By use of the Gibbs equation the decrease in free cnergy inay be computed for the process as a function of coverage. For this calculation, ho~vevcr, the absolute values for the adsorbed water, i.e., the zero point for the adsorbed water vcrsus relative vapour pressure plot, and the surface area are required. In another paper,4 an
csperimental method of determining the zero is described, and thus a surface area calculatcd by the R.E.T. method can be obtained.
The point for zero aclsorbed water and the surface area can be predicted from the AWIW- All1 relationslli~s (Fig. I) on primarily theoretical grounds. This method5 is based on the Gibbs equation and the Bangham e q ~ a t i o n . ~ The latter considers the length change of an adsorbcnt during the adsorption process to be a measure of the surface free energy change.
All1 = lil A y
...
(6)A y is thc surface energy change as determined b y the Gibbs equation, All1 the length change, and k is a constant related to the Young's modulus of a basic unit or crystal of the adsorbent. Thc relation is in effect an expression of Hoolie's law as applied t o tangential forces that h a w been imposecl by thc surface tension of the adsorbent. Because of the adsorption process the surface free energlr is reduced and an expansion of the body that was subjected to the tangential stress occurs. \Vhen A y is calculated b y graphical integration for various poiilts along the ndsorptioli isotherm, and plotted against the corresponding lengtll change, A1/1, a straight line through the origin should result. The equation has bcen shown t o apply for other adsorbent s y ~ t e n l s . " ~ ~ ~
l o 2 , A W I W
Fig. 1. Plot of length chngzge versus zontev sovbed
The metliod of deternlining the zero point of hydrated cement for aclsorbecl water recogniscs the fact that a t low humidities the processes of desorption ancl dellyclration are liliely to take place simultaneously. This malies it impossible on first consideration to estimate what portion of the water talicil off is physically aclsorbed; until this can be deteril~inecl, the smface area of the hydrated cement cannot be calculated by the B.E.T. method.
Hydrated cement samples a t approvimatcly 774,
R.H.
may be considered as adsorbent with some adsorbed water present. If it were possible to remove this adsorbed water without clecomposition of the hydrated cement, then the lengtll change Al/l(A) resulting from the desorption of water A W / W ( A ) and the length change A l / l ( H ) from hyclrated cement decomposition A W / W ( H ) would be lino\vn. Considering these length aucl weight changes as independent of one another we have the equations*
A mole of hydrated cement is a hypotlletical quantity conccivcd nlainly for usc in the equations i o achieve consistent use of units.96 FELDilfa-lAT & SERED.1-SORPTION OF WATER ON CEMENT. II
~vhel-e Al/l(T) and ATV/TV(T) are the actual weight ancl length changes observed.
Since no decomposition of the hydrated cement talws placc between approsinlately 7 and
25% R.H , this region, which is observed as linear on the AT11 vs 4W/W plot (Fig. I), is a relationship between 4l/l(A) ancl AW/I.V(A). This same plot for other adsorbents, Vycor glass,' precipitated CaC0,,8 Cab-0-Sil silica,* a i d calcium sulphate heinihydrate5 for low coverages from no adsorbed water to one or two n~olecular layers, shows a linear portion through the origin. I t niay thus bc concludecl that if the linear portioil is estrapolated bacli~vards, this line will pass tlthrough the point where both AW/W(A) and Al/l(A) are zero. The residual AW/W(T) and Al/l(T) will be cqual to AT/V/W(H) and Al/l(H) as may be seen from equations (7) and (8). Linearity niay hc espressccl by the equation
Al/l(A) =- b A W/TV(A)
...
where b is a constant. (9)
The zero point for AW/TV(A) and Al/l(A) may then be found by a solution ol equations (4),
(6) and (9).
Thesc equations result in
Here o ( ~ m . ~ / g . ) , the surface area of the adsorbent, is also a function of AW/T.V(A) ancl thus of the pressure P of the adsorbate.
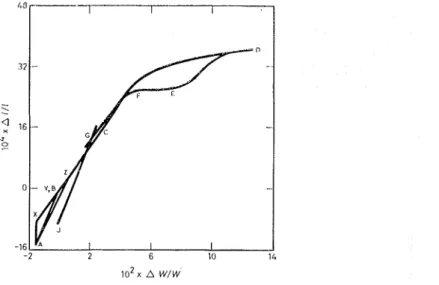
Equation (10) may be solved by a trial and error procedure; a point X on the estrapolated linc (Fig. 1) is taken as zero and the B.E.T. area calculated. From this Ay can be calculated for several values of P ancl a plot against All1 (or AW/TIV) made; this did yield a straight line, but as shown in Figs. 2 and 3 i t did not pass through the origin. The procedure was repeated until a straight line through the origin was obtained. Figs. 2 and 3 show plots of All1 versus Ay ancl ATV/T/V versus Ay, respectively, for three cases in which the above calculation has been clone. These three cases are located on Fig. 1 as X, Y and Z ancl are as follows:
Fig. 3. Plot cl/c,vpnsisio~z (1s fttnclio~z. oJ tlec~cnse Fig. 3. Plot of decrease i,)z surface free epievgy a s
Z,IL srl~y?ticrce fiec c1~etb.y fz~nctiotl o/ covcrcbge
C) plot with S as zcro point (Fig. 1) 0 plot with X as zero point (Fig. 1)
@ plot wit11 Y a s zcro point (Fig. 1) @ plot u i t h Y as zero point (Fig. 1) plot with % a s zero point (Fig. 1). plot with Z as zcro point (Fig. 1)
FEI,DfMAN & SEREDA-SORPTION OF WATER ON CEiMENT. 11 97
Case
(i)
where the zero point, X, is taken such that the AWI1.V is greater than the practically obtained values by 1.54 x 10-Q./g. This, as shown in Table I , results in a surface arca of118.8 in."g. and
I.V,
is located a t a P I p 0 ratio of 0.05. Figs. 2 a i d 3 show that a straight linc up to l'/IJO 0.25 is formecl, but it cuts the All1 and AT;I'/TV axes respectively a t a considera1)lc distance from zero.Case (ii) where the zero point, Y, is talten at the experimentally obtaiilecl zero point. 'I'his results in a straight line that again cuts the axes, although i~iucli closer to the zero than ill tlle last plot. The surface area value obtainecl is 80.6 i r ~ . ~ / g . , FVI, occllrriilg a t "/F', 0 . 185. Case (iii) where the zero point,
Z,
is taken such that ATVlW is less by 0.46x
lo-' g./g. than the experinlentally obtained values. This results in a straight line through tlic origin, antl tlie R.E.1:. calcu1;ltion yields a snrface area of 73.1 in."/fi, I+',,, occurring a t 1'/1', 0.222.Table I
S ~ r r f a c c a r e n s ~ O ~ I L ~ Z ~ ~ P ~ ~ U Y d l ] / e ~ l ' i ~ t :('YO p o i i i t ~
Zcro point A 11'/11' x 100 from
transition point 117,, O C C T I ~ S a t PIP, Surface arca, m.'/g.
Thus the theoretical zero point for adsorbed water is located a t -t0.46
x
lo-". of adsorbed water with respect to the experinlentally obtained zero point ancl tlie surface area compares well with tlie experimentally obtainecl valuc. I t may be observed tliat on moving the zero from X toZ
(Fig. 1) the straiglit linc plot in Figs. 2 and 3 tends t o cut tlic axis wit11 decreasing intercepts until a t Z it passes tlirough zero. IF the zero liacl becn talcen eve11 further along line XZ, the resultant line would cut the other axis. I'oint Z gives the ulliclue solution for equation (10). I t is true, however, that values for zero, cleterilliilcd both esperimeiltally and theoretically, are not esactly the same; when tlie approximations in the whole procedure are considered, ancl as integration a t low pressures cannot be too accurate unless adsorption data arc obtained at very low pressure, the agreement must be coilsidered excellent. The sorption curve between 0 and 7 . 2 % R.H. was extrapolated ancl the value of AWITV for R.H. 2.5(y0 talten from it, but the All1 vs Ay plot was relatively insensitive to small changes in this extrapolation. I t may thus be concluded tliat the beliaviour of tlie l~yclrated-cement-lvater sorption system for the region of R.H. below 25%) can be desciibed by tlie Gibbs adsorption equation ancl ccluations (7), (8) 311~1 (10).Sorption beyond the PIP, value of 0.25
When the plot of All1 versus Ay (Fig. 2) is exteilcled beyoncl250/:, R.1-1. a surprising iilcreasc in slope may be observed. This coincides with the region wlierc tlic cliscontinuity occurred in the sorption and length change isotl~erins,~ ancl it is consiclerecl to be related to the seconclarj~ hysteresis observed in the desorption part of the loop. I t has also been pointed out tliat if this water (sorbed beyond 25% R.H. ancl causing the cliscontinuity) is associatccl with the secondary hysteresis, then this water is sorbed irreversibly. I t is also shown that on reinoval of this water a
All1 vs AWjW relationship shows a linear plot with a slope greater than that of the previously sorbed water.
If the B.E.T. parameter [PIPo]/ [(ATV/W)(l-PIP,)] is plotted beyond 25, to 330i;, R.H., it may be observecl (Fig. 4) that the linear plot deviates sharply after 25% R.1-I. This indicates that the value of AWIW is too large to obey the B.E.T. equation, which usually applies up to 33% R.H. I t is corisidered that beyond 25% R.H. two processes are occurring: (I) physical adsorption, and (2) a secondary process that yields a greater expailsion per unit weight changc than the physical adsorption.1 This explains the increase in slope of the All1 vs Ay curve. Two points remain unexplained: that this sorption is irreversible, and that the slope of the All1 vs AW/T/V curve is greater for this secondary sorption. The existence of an activation step in chemi-sorption is well recognised,%s is the fact that the activation energy required to surmount the barrier between the gas molecule and the surface is supplied entirely by the adsorbent. In this case, as the adsorbate talies a position on the surlace, changes occur in the adsorbent. This
0 plot \\,it11 S as zcro point (I.'ig. 1) @ plot with 1- as zero point (I:ig. 1)
U plot with % as zcro point (Fig. 1)
can be well understood as the adsorbent is by no meails iilert and there is co~lsidcrable interaction between the adsorbent and aclsorbate. In eHcct, an increasc ol thc area available for adsorptioll is generated during coverage of the aclsorbent by the aclsorbate. I t is uncertain whether this is achieved by modiicatioll
df
the lattice spacing, allo\ving greater penetration of the adsorbent, or by a change in interaction energies, malting more sites available for sorption. This type of sorption, however, shoulcl not be of a reversible nature ancl will account for thc seconclar!~ hysteresis in the isotherm. Water sorbcd ab0i.c 25% R.H. on nclv llig.11-energy sites crcateclby
the modification in the aclsorbent cluring sorption below 25% R.H., is liltely to bc rcmolrcd a t a consiclerably lower value.
Bernallo viewed tober~noritc gel as an ortl~osilicate ~vitll t~ v o h~-clrogens on turo of tllc osygcn ions in thc S i 0 4 tetrahedra. Accorcling t o his structul-a1 formula, Ca,~SiO,(OH),],,Ca(OI-I),,
two of the water molecules, in hydrosylic forms arc in the tobcrmol-ite layel-s-or in the H,SiO,,"- chains, constituting parts of the layers. T c third \vatel- molecule, lil;:~\visc in hydrosylic form, is between the lavers.
Brunauern and his co-worl;ers considcrecl the interlayer n-atcr to be molecular, Bernal's formula being moclifiecl to Ca2[Si0,(OH),]2,Ca0,H,0 u~hich includes the esisterlce of 02- ancl Ca2- ions and H,O in the same compound. However, wit11 drying of increasing severity, tlie water is lost colltinuously until one molecule is remoi-cd; clcnsity ~ncasurcmcllts inclicatccl t h a t the c spacing is reduced cluring drying; they considered that when toberrnorite gel was clriccl over the vapour pressure of ice a t -78", all tlie interlayer hydrate water was removed ancl thc minimum distance between tlie laj~ers was attained. When 1-cwetted, the tobermoritc dicl not readily swell.
If adsorption of water moclifies the system in soine way, alloiviilg re-entry of water into the lattice at a specilic relative humidity, a discontinuity in the isotherm is observed; as this water cannot be removed until low vapour pressure conditions occur, a secondary hysteresis should b e expected.
The water, inside the lattice, interacts with the inaterial as shoivn by the All1 vs AW/T.T' relations1lip3 in a way that is different from that of t l ~ e water adsorbed. This difference provides a basis for dilferentiating between the t ~ v o types of water."
Once this explanation for the discontinuity and secondary hysteresis has been acceptecl some explanations for previous results can be made. Tomes et a1.12 found that, when specimens
of hyclratcd cenlellt \vei-c dried for different periods of time, all of the water removed in the later stages of drj~ing was not rcsorbed when sainples lverc re-esposccl to R.H. of up to 2 5 3 . Also, the glcater the drying time, the greater was the computcd suilace area of the hydrated cement. This is here esplaiiled by the fact that a large portion oi thc water talren oft during drying a t the vapour pressure of ice at -78" is iiltcrlayer hydrate water and that oilly a portion of it returns to the original sites a t R.H. below 25%. Tlle longer the drying period, horvever, the greater is the absolute quantity of water resorbed. I t is apparent that if this interlayer hydrate n-ater is included as pllysicallj7 adsorbed water in a calculation 01 the surface area of the 11)-drated cement, an crroneous result will be obtained Results for nitrogen sorptioil on hydrated cement have bccil reported;le*l3 these show values for the surface area as low as 20% of tlle result con~putecl from water aclsorption. The value obtained by tlie esperin~eiltal lnetllod of separating adsorbcd and interlayer hydrate water yields a value approsiinately 60% of that computed for bottlc- hydrated cement from water adsorption deteriniiled by the conventional method of drying.
I t may now be seen that the B.E.T. plot, nornially applicable betrveen PIP, values of 0.05 and 0.33, may not be applied in this case beyond 0.25. Beyond this value, it is now considered that some admittance of interlayer llydrate water occurs. In Fig. 4 the plots of the B.E.T. parameter beyond 25% R.H. that sho~v evidence of the interlayer hydrate water are presented lor the three cases. When a large quantity of interlayer hydrate nater is talten as adsorbed water, the deviation in the curve is not as great as for the other cases. For eve11 greater degrees of dehydration, the deviation observed in the B.E.T. plot will becoinc negligible. This may indicate rvl~y in previous work the deviation has not been observed.
Surface area from the pore-size distribution
This may be calculated by a numerical integration of the area of all the pores from the pore-size distribution curve sho~vn in a previous papei-.l Assumiilg cylindrical pores, then,
h A i = 2 AVi/Ri
. . .
..
..
. . .
.. . .. .. . .
.. . . .
. .... .. ... . .
(11)rvllere Alli and AVi are the area and volullle per g. of sample for each group of capillaries taken to have Ri as a mean pore radius. Pierce's methodl"vas used in this calculation; a correction is inade for clesorption that occms fronl tlle adsorbed fill11 of larger pores which have already lost their menisci, as well as for the fact that the area obtained is that of the fill11 and not of the pore walls. Fig. 5 shows a cum~zlative plot of pore radius versus surface area. At any point on the curve the surface area is provided by pores larger than Xi. Thus it can be seen that 95% of the surface area is provided by pores smaller tlian 50 in radius or 70% by pores smaller than 19 X in radius. The total area is computed to be 101 ni."g. Considering the approsimations, this is in escellent agreement with the values obtained by the B.E.T. method, using the experimental and theoretical methods respectively for cletern~iiling the zero for adsoi-becl water. It nlust be stressecl that the pore-size distribution has been calculated by applying a modified form of the I<elvin equation to the desorption loop of the sorptioil isotherm. The close agreement of areas seeills to indicate that menisci do esist down to R.1-I. of approximately 31
%.
100 FELDMAN
G
SEREDA-SORPTION OF W A T E R ON CBfIEA'T. 11Theory of volume change and calculations of Young's modulus
As has alreacly been indicated, volume changes at different regions of the isotherm will be
7.
the result ol cliffcrent processes ancl slloulcl thus be descril)ccl by cliffercnt mcclianisn~s. Illese regions will be treated separately here.
( I ) I<eg,.iol~ ofpl~ysical ndso:,jtio+z oltly
This regiorl i, co~liidcrecl to esist lroin a relative vapour pressure value ol 0 . 2 5 to just short ol zero .i.apour preszurc. In this i egion it has been obscrvetl that tlie length change data obey the Bangham relation equation (6) ~vlicre the change in surface free cncrggr ib reprcsciltcd by the Gi11bs equation. Thus, tlle process of espansion is due to the release of the surface tension force.; ol the adsorbent which ac<tangentiall$ TT1llen the adsorption process takes place, interactioli between the adsorbate and surface causes a clecrease in surface free energy. The volume cllange ol elelllents in contact with each otllcr n~ithin the body is transmitted through eacli, and results npprosimately in the total volunle change of tlie body. The illagnitucle of the effect, if any, of t l ~ c l~orosity or packing of tlie sanlplc on the transmissioil of the volume changes will be consiclcretl 1;1tcr. Tllus, the change in surface free energy Ay is talten to represent the spreacling pressure in~posccl on the svstcm by the adsorbate and can be calculated by the Gibbs equation.
- I t is possible~t1~erefo1'c. to calculate a value for Young's modulus of the hyc1;atecl cement. I t
is cmpllasisecl that this value is for the basic unit ol tlie llydrated ccinent and will not necessaril~. be sinlilar to the value o1)tairlccl 1)y nlecliallical 1ilc;lns. Fronl anotl~er relation dcsivccl by
Banghain L% MaggsG
E = pc/l<,
....
.
.
.
...
..
.
..
. .
. ..
.
.
. . .
. .
...
. ..
. . . ...
....
..
.
(12)where
E is tlie Young's moclulus of the material,
p (g.1c.c.) the density,
o the surface area ( ~ r n . ~ / g . )
and lt, the constant obtained from equation (6).
This equation was derived for an infinitely long cylinder, where the surface area is taken to be composed only of the curved surface of the cylinder.
Assuming tlle density of the solid material in hydrated cement as 2 . 7 g./c.c., the surface area as 73.1
x
lo4 ~ m . ~ / g . , and the value of I<, talten from Fig. 2 as 1.96x
10-%in./dyne, the value of B was computed as 1-01x
1011 d y n e s / c n ~ . ~ or 1.47 x loG lb./in.2( 2 ) Adsor9tion rcgiolz beyofzd 25% R.H.
In this region physical adsorption is complicated by water that enters between the layers
of the crystal and alters the lattice spacing. Froin results discussecl previously, i t is now k1101~11 that the length change for unit weight change is greater for this interlayer hydrate water than for physically adsorbed water. Lengtli clianges are affected by both processes, and it is not possible to differentiate between them.
The physical adsorption process, however, will continue t o develop the spreading pressurc according to the Gibbs equation. At some relative pressure, another factor, the formation of n~enisci within the pores, will tend to reduce observed expansions; but where this process first occurs is not possible to estimate accurately, altliougll it is probably beyond
R.H.
GO%,.(3) I)esor$tiol~ rzgiolz dozolz to 36% R.H.
This region L)E in Fig. 1 is within the area of primary hysteresis, and concave menisci forces
arc operative. The contraction of the adsorbent is due to the increased value of tlie n e g a t i ~ ~ e pressure as the radii of the menisci decrease, as well as to the reduced spreading pressure of the tilm, which hacl adsorbed on the walls before filling of pores took place; both of these processes occur as tlic equilibrium pressure is reduced. The system under consideration can thus be cli\~itlcd into two parts, one consisting of that portion ~i~llicll comes under the influence of surface forces, and the other, the remainder of the adsorbate uncler tlle influence of menisci. Althoug11 tlicsc parts are considered separately it is not meant that any abrupt bounclary beti\rccn them exists, ancl the aclsorbecl film must always have the same chelnical potential a t equilibriuin as thc capillary liquid and the vapour in equilibrium with the system.
For the aclsorbed film tlle Gibbs equation (4) may still be used to represent the change in surface iree energy, but tlie surface concentration w2/1z1 of the adsorbate on the aclsorbeiit is
consitlerecl a constant a t approximately the value at 35% R.H. Thus the equation may be written
FELDMAN & SEREDA-SORPTION OF WATER ON CElWENT. II 101
Integrating and combining with equation (6), we obtain R T n
Al/lf = k,
-
-,
'In
p 2-
...
a1 Pl (14)
where Al/ln is the contraction caused by the adsorbed film due to the lowei-ing of vapour pressure from P, to PI.
For the capillary water the process can be considered in some ways equivalent to the differential process; in effect a change in concentration with respect to the adsorbent is not taking place, since this water was defined as that not being influenced by surface forces. The capillary water inaintains equilibrium with different vapour pressures by changing the radius of its meniscus. This in turn imposes a tension on the water. Thus the equation used to express the negative pressure in this water is similar to that derived for the pressure developed in the phenomenon of osmosis.15 Assuming that the length change, Al/lc, in this case contraction, is proportional to the pressure due to menisci p, we obtain
Thus, the total length change All1 between D and E (Fig. 1) may be represented by the equation
where
p is the density of tlie capillary water and is take11 equal to that of bulk water and M the n~olecular weight.
From equation (16) it may be seen that tlie contraction between D and E must be proportional to the logaritl~m of the relative vapour pressure. This is shown in Fig. G to be true for R.13. between 74 and 49%.
The calculation of Young's modulus from these data has been attempted b e f ~ r e . ~ ~ ~ ~ I n one case, a cylindrical capillary was considered separately and subjected to a negative hydrostatic pressure from within; the tl~eory for a thin walled tube, where the thicltness of the wall t is small compared with the radius a, was used. This resulted in the equation
where again Al/lc is the contraction produced only by the negative stress
Ap
produced by the change in radius of the menisci. I t is not possible, however, to nlalte an accurate estimate of the ratio (nlt). I t seems probable that tlie walls of the cylindrical capillary are rather thick for hydrated cement, which maltes the theory inapplicable.If the porous body ol hydrated cement is considered to be under hydrostatic pressure due to the hydrostatic tension in the water, the bulk modulus of the material can be determined. Thus
3 A1/Zc = Ap/IC
...
( 18) where I< is the bulk modulus of the hydrated cement.Al/lc is obtained from equations (14) and (16) using k, and cr as already determined from the 0-25% R.H. region of the curve and n,/n, as the value obtained a t approximately 35% R.H. on the sorption curve.l By assuming a Poisson's ratio of 0.25, the value obtained for Young's modulus was 1.54
x
1012 d y n e s l ~ m . ~ or 22.4x
lo6 lb./in.,(4) the
Desorption region of constant lengtlz
I n the region EF (Fig. 1) the pores are emptying and the contractive force imposed upon material is being removed. At the same time, the relative pressure has decreased from 35.8 to 31% and some desorption from adsorbed films may talte place from pores that have already lost their menisci, these latter two effects causing contraction. The opposing effects balance in this case, giving a region of constant length.
(5) Desorption region below 31
%
R.H.The region FG (Fig. 1) is similar to the region of 0-25% R.H. for the adsorption p a t of the
cycle, and the c1esorption process is accompanied by contraction clue to an increase in the surface energy of the material. Contraction causeel by removal ol water in the region GJ is clue to tlcllydration of the ccmcnt; the iiltei-laj~er l~yclrate water is being witl~clra\\rn, giving a greater cc~nti-action per unit weight of \vatel- 1-einoveci than for the aclsorbecl water.
I t is observect that t l ~ e sainplc at the completioll of the cycle has sufferetl n permanent coi~traction. This is cviclcilt by the l o c a t i o ~ ~ ol tllc point J (Fig.
I).
Attention should be dran.11 again to tllc statement macle earlier in this paper, where it was stressed that a finely cli~~iclccls!. ..;tern rcprcscnts a state of unstable ecluilibrium. The preclominance of the surlace forces o17er ill(% elastic forces becomes eviclent \:it11 time anel is acceleratecl ~ J J a wetting anel drying cycle.
'Illc reduction of the surface in this way will result in this forill of irreversible sllrinliage.
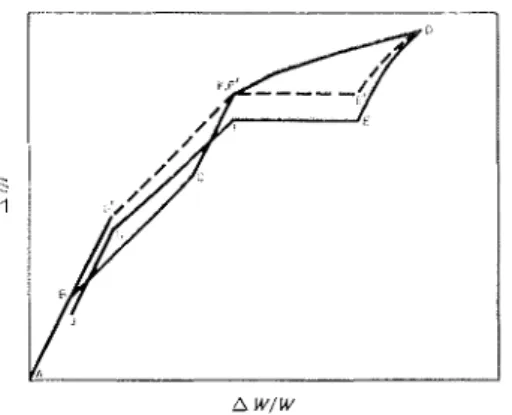
Fig. 7 is a simplified cliagram for the Aljl vs ilWil,br relationship t o illustrate clearly the tliflcrcilt types ol volume changcs occurring in the h~~clratecl-cement-bvater sorption system; it is not intcntlccl to show the precise mecha~iisn~ or order in whicli processes occur. AB represents rcntlmitting oC interlayer hyclrate watei- during sorption.
BC
represents physical adsorption ;mtl CI< the readmittance of interlayer hydrate water that occurrecl b e t w e n 25% R.1-I. and saturation, n.llilc I<D represents tllc physical adsorption tliat occurrecl in that same region. I t is notetl tint LiC is drawn linear, as nTas observeel for the frst1-
t o ",molecular layers for other niaterials, while I<D is ol clccreasing slope. DE' represents the region of hysteresis, E'F' the elnptying of the pores, d?G' is thc clcsorption of the physical adsorbed water. C;'B represents the dcllydration of the sample, by the withc1r;lwing ol the interlayer liydrate water. This plot cmpllasiscs the similarity bctn~ccn CI< and Gin, and llo\v this causes the esistence ol tlie sccontlary hysteresis. Throughout tlle cycle, irreversible ageing or recrystallisation superimposes itself on the \vhole process; D, E', I;', C' becoille line D, E ,I?,
G , J, which is clisplaced bj7 tlie amountE'E, representing irreversible shrinkage. I-Iere the irreversible shrinliage is incluclccl u~itll DE' only for convenience in the represent- '1 t ' lon.
Fig. 6. Plot of lelzgllb cl~arlge agair~st log,, 1'1 ,'L fou clesouptio)~ i?z the prirlzauy I~ysteres~s
regiol~ of the isothevlr~
a w/w
Fig. 7. Diaguailr~lratic represe?~tation of dir~teilsiorzal cl~aib,nes arisi?zg fro))z sorptiorz
1)iscussion
To clcscribc the mechanism ol vol~inlc change of liyclratecl cement lor physical adsorption, previous a ~ t l i o r s ~ ~ , utilisecl an equation to compute swelling pressures similar t o that dcrivecl for the potential prcssure ol an osinotic process, soinctinles relerrecl t o as the I<atz cquation. In the derivation of the latter equation the f~inclainental tl~ermoclj~namic equation of a bull; pllasc is utilisecl. Thus, lor this ancl other reasons described previously, the use of the I<atz c.cluation lor the integral process equation
(I)
is thei-modynamically inconsistent.The espansion of the hyclrated ccment clue t o physical adsorption mas attributeel to a process tlescribccl in a serics of papcrslG,ls,l%auc! relcrrecl to as 'restricted aclsorption'. Expansion due to the clccrcasc in the surlacc tension force \\'as helcl negligible. Results in this paper, llonlevcr, s l ~ o ~ v that thc sorption-length change relationships obey the Gibbs ancl Bangllam ecluations, and with their use a surface area is predicted very close t o t h a t louncl esperimentally. The value of B calculated to be 1.47 x