Challenges and Strategies for increasing Adoption of Small
Wind Turbines in Urban Areas
by
Kevin Ferrigno
S.B. Mechanical Engineering
Massachusetts Institute of Technology
Submitted to the System Design and Management Program in partial fulfillment
of the requirements for the degree of
Master of Science in Engineering and Management
at the
Massachusetts Institute of Technology
May 2010
@
Kevin Ferrigno. All Rights Reserved.
ARCHNIES
MAssACeUIrSfIS TER
OF TECHNOLOGY
JUN 16 2010
LIBRARIES
The author hereby grants to MIT to permission to reproduce and
to distribute publicly paper and electronic copies of this thesis
document in whole or in part in any medium now known or
hereafter created.
Signature of Author:
System Design and Management Program
May 2010
Certified By:
Stephen R. Connors
Director, Anal
isroup for Regional Energy Alternatives
T esi phvisor
Pat Hale
Director, System Design and Management Program
Accepted By:
Challenges and Strategies for Increasing Adoption of Small
Wind Turbines in Urban Areas
by
Kevin Ferrigno
Submitted to the System Design and Management Program on May 14, 2010 in
partial fulfillment of the requirements for the degree of Master of Science in
Engineering and Management.
Abstract
A student group at MIT in cooperation with the MIT Department of Facilities is currently working to
install a Skystream 3.7 wind turbine on MIT's campus. This has raised several questions about how to best develop small wind projects in urban environments. The best wind resources in the country exist in relatively remote locations and require large investments in electricity transmission infrastructure to be effectively utilized. In the meantime, several large and small projects have been developed in the Boston area. The urban environment presents many challenges to development including the interaction of urban buildings with wind flow, concerns from neighbors and government over the aesthetics and safety of turbines that are installed near human populations, environmental effects including wildlife, noise, and shadows. There are also many opportunities including the ability to use net metering, little or no transmission infrastructure costs, and the ability to build on existing wind resource data and project assessments to develop a large number of installations.
This document presents an overview of how the challenges of small wind turbine development in urban, suburban, and rural neighborhoods are currently being addressed by research in new and improved technology for turbines and siting, business strategies of existing companies, financing, and government policy. It looks at the strategy options available to businesses involved development of small wind turbines and evaluates the relative strengths and weaknesses of these strategies in a rapidly changing marketplace.
Thesis Supervisor: Stephen R. Connors
Acknowledgements
I would like to thank the many classmates, faculty, staff, and others that have contributed to my work
on this thesis and to my experience in the MIT System Design and Management Program.
To the many students I have met through the MIT Energy Club and interns at the US Department of Energy whose dedication to the energy industry helped motivate me in my own work.
To the members of the MIT Energy Club Wind Energy Sub-community, Renewable Energy Projects in Action, and Project Full Breeze. You provided the inspiration for my effort to examine the small wind turbine industry. Working with you on the MIT Wind Turbine Project has been an outstanding experience.
To Pat Hale and the rest of the SDM staff for continually improving the SDM program, making it an excellent example of how Engineering and Management education should be addressed, and assembling the outstanding cohorts I have had the pleasure of working with.
To Steve Connors, who provided encouragement, direction, feedback, and support through several potential thesis topics over the last 16 months.
To all of my colleagues in the SDM cohorts of 2008, 2009, and 2010, who shared their vast experience and knowledge in classes, hallway discussions, and the SDM January session.
To my wife Angie for her feedback, support, and motivation that she provided throughout my participation in the SDM program.
To my dad, whose support, encouragement, and guidance have been invaluable in helping me achieve my goals and set ever higher new ones.
Finally, I would like dedicate this thesis to the memory of my mother. She provided me with so much guidance over the years and I would never have been able to accomplish this without her years of support and guidance.
Table of Contents
Abstract...---...3
Acknow ledgem ents... ---.. --- --- --- ---...5
List of Figures ...-- - - -...---- 9
List of Tables ...---... 11
Chapter 1: Introduction and Motivation...12
Chapter 2: Overview of the W ind Industry ... - - - - -... 17
2.1 Characteristics of Wind Energy ... 17
2.2 M odern W ind Turbines...- . ---... 20
2.3 Turbine Performance ...-- ... .. . - ---... 21
2.4 W ind Farm Development...---... 23
Chapter 3: A Screening Model for Small Wind Turbine Performance ... 25
3.1 Overview ...-...---... 25
3.2 Turbine Performance Screening Model ... ... 26
3.3 Cost Model ...---.---... 28
3.4 Sum m ary ...---... 30
Chapter 4: Selection of Applications for Small Wind Turbines Technology in Populated Areas...31
4.1 Urban Wind Resources ...---.- -... 33
4.2 Environmental Effects of Urban Wind ... 38
4.3 Urban Wind Turbine Technology ... 38
4.4 The Urban Wind Market and the Small Wind Industry ... ... 40
4.5 Policy and Incentives...--- . . ---... 43
4.6 Evaluation of Applications ... ...45
4.7 Evaluation of Savings for Wind Combined with Emergency Power ... 47
4.8 Challenges and Strategies for Application Selection ... 48
Chapter 5: Strategy for Technology Improvements in Small Wind Turbine Technology ... 50
5.1 Evaluation of Low Wind Speed Turbines ...-... 50
5.2 Evaluation of Efficiency Performance Improvements ... 52
5.3 Challenges and Strategies for Technology Improvement ... 55
Chapter 6: Challenges and Business Strategies for Accelerating Diffusion and Adoption of Small Wind T urbines ...--...----....--.---... 56
6.2 Evaluation of Sm all W ind Turbines on the Technology and M arket S curves ... 58
6.3 Challenges and Strategies for Turbine Im plem entation ... 65
6.4 Strategies for Acceleration Adoption of Sm all W ind ... 66
6.5 Allowing for Turbine Upgrade... 69
6.6 Advanced Assessm ent Techniques ... 72
6.7 Challenges and Strategies for Turbine M anufacturers and Installers ... 73
Chapter 7: Conclusions ... 75 R e fe re n ce s ... ... 7 7
List of Figures
Figure 1-1: Estimates for levelized cost of energy (LCOE) for renewable and conventional generation
sources after government incentives (Lazard 2008)...13
Figure 1-2: United States wind resource map (Wind Powering America 2010) ... 14
Figure 1-3: United States population density map (US Census Bureau 2009)...14
Figure 2-1: Wiebull distributions and energy output distribution ... 18
Figure 2-2: Wind speed as a function of height above different surface features (Wizleius 2007) ... 20
Figure 2-3: Wind turbine efficiency as a function of wind speed for a Siemens 1300 (Wizelius 2007) ... 22
Figure 2-4: Power curve of Skystream 3.7 (Southwest 2010)... 23
Figure 3-1: Model for turbine efficiency and power curve ... 27
Figure 4-1: Wind flow over an isolated house (Heath et al. 2007) ... 34
Figure 4-2: Flow over a flat roof building (M ertens 2002)... 34
Figure 4-3: Effect of buildings on w ind (Gipe 2009)... 35
Figure 4-4: Overhead view of wind flow through an array of buildings (Heath et al. 2007)...36
Figure 4-5: Actual installation and installed capacity through 2008 and projected installations through 20 13 (A W EA 2009)...4 3 Figure 4-6: Willingness to pay based on wind speed and retail price without incentives ... 45
Figure 4-7: Willingness to pay based on wind speed and retail price with incentives ... 46
Figure 5-1: Effect of changing cut in speed on turbine performance...53
Figure 5-2: Effect of changing rotor size to achieve lower cut-in and rated speed...53
Figure 5-3: Effect of changing rotor size on willingness to pay per swept area...54
Figure 5-4: W illingness to pay for efficiency changes... 55
Figure 6-1: S-Curve frameworks for market adoption and technological progress...59 Figure 6-2: Trends for installed cost per capacity of large wind turbine projects (Wiser and Bollinger
2 0 0 8 )...5 9
Figure 6-4: Capacity factor improvement for large turbine from 1998 to 2006
(W ise r and Bo linge r 2008)...60
Figure 6-5: US market growth in small wind turbines (AWEA 2008, 2009)...61
Figure 6-6: Transisiton from off-grid to grid tied systems in US (AWEA 2008, 2009)...62
Figure 6-7: Assesment of small wind turbine industry on the market and technology s-curves...62
Figure 6-8: Framework for first mover market advantage (Suarez and Lanzolla 2005)...64
Figure 6-9: Com mercialization strategy (Gans and Stern 2003)... 64
List of Tables
Table 2-1: Tower costs increase for turbine size increase (Khatri 2010)... 19
Table 4-1: Typical applications for urban wind turbine installations...33
Table 4-2: Pricing for selected small wind turbines before installation (Windspire 2010, Southwest 2010, Proven 2010, Ampair 2010, Bergey 2010, Turby 2010) ... 39
Table 4-3: Currently available small turbines with example installed costs (Cace et al. 2007, Bailey 2010)...40
Table 4-4: Large urban turbines (>=l0OkW) in or near Boston, MA (AWEA 2010)...41
Table 4-5: Selected smaller turbine installed around the Boston area ... 41
Table 4-6: W illingness to pay for applications... 47
Table 4-7: Reduction in effective capital cost for wind turbine providing emergency power...48
Table 5-1: Available small wind turbines advertising low cut-in speeds... 50
Table 5-2: Normalized swept area and turbine rated speed for cut-in speed changes...52
Table 5-3: Turbine rated speed and normalized swept area for efficiency changes ... 54
Table 6-1: Cost breakdown for large wind turbines, HAWT's, and VAWT's... 56
Table 6-2: Issues and tradeoffs between turbine sizes...57
Table 6-3: Recent venture capital funding in small wind turbine companies (Ampair 2010, Southwest 2010, VenturewW ire 2010, Sharman 2010)... 65
Chapter 1: Introduction
and
Motivation
MIT has received the donation of a Skystream 3.7 wind turbine that is scheduled to be installed in 2010 on MIT's campus. The turbine will be installed in the middle of an urban landscape where it will be surrounded by tall buildings which will likely have significant impacts on the wind that the turbine uses to generate electricity. The MIT student center is topped with an array of solar panels, and proposals for
other energy efficiency and renewable energy projects are ongoing or have been proposed for MIT's campus. While development of renewable energy, and specifically wind energy, in the US has grown at a rapid pace in recent years, most development has been in rural areas and development of wind power in cities and suburbs has seen only small growth. While growing the development of wind power in urban areas is challenging, this paper aims to determine if there are specific applications or conditions that lend themselves to faster rates of adoption of small wind turbines in urban areas.
In general, public attention and policy towards developing larger amounts of renewable energy sources has been increasing. There is growing concern over the human contributions to global climate change. In December 2009, the international meeting in Copenhagen to discuss international policy towards global climate change that is the latest political event bringing attention to this problem. In the US, electricity generation is responsible for 2.4 Billion Metric Tons of carbon dioxide emissions, or 41% of all carbon dioxide released into the atmosphere in the United States. (EIA 2009a) This has stimulated
development of technologies that have low carbon dioxide emission footprints. In addition to issues around climate change, the US and other countries without sufficient domestic supplies of the fossil fuels to meet their energy demand face security risks associated with importing large quantities of fuel. These concerns are encouraging the development of alternative energy sources which have no direct
C02 emissions and low lifecycle C02 emissions. The primary technologies for electricity generation with
low C02 emissions are nuclear fission and renewable sources such as wind, solar, hydro, biomass, and geothermal energy sources.
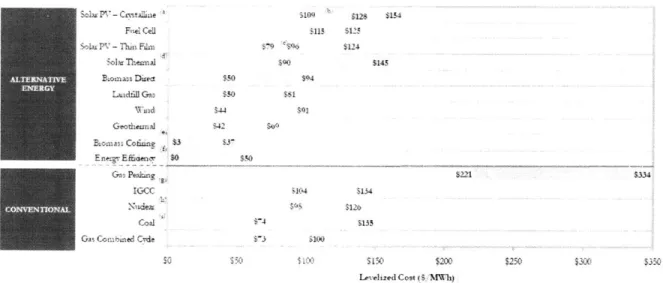
When considering renewable energy for significant production of electricity, the cost and potential capacity are important factors in determining which renewable technologies can be implemented economically and on a large scale. Figure 1-1 shows costs comparisons for several electricity generation sources including both renewable and conventional generation sources. (Lazard 2008) Wind is among the most cost effective of the renewable options.
Sohr P12 - C$te104 412$ $154 Fiel Cell $115 $125
Soiu PV - Thmr Film s-9 c3% $U24 S14
Sohr Theral M0 5145
A .EAV Biomass D±ed $50$9
dflSG $50 Wad $44 $91 Geth~ennral $42 $4 EelwvEffiaenle S0 50 $221 33 K24 \12o coal ;4$135
Gas Combme C Cee S3 S100
50 0D150 $250 $30 $350
Levlized Cost XS MWh)
Figure 1-1: Estimates for levelized cost of energy (LCOE) for renewable and conventional generation sources after government incentives (Lazard 2008)
The availability of wind resources varies across different geographic regions. Figrue 1-2 is a map
provided by NREL that illustrates the wind resource available across the United States. Figure 1-3 shows the population density of the United States by county. A quick comparison of the two figures shows that the best wind resources, and therefore the most economic wind generation, exist in different areas than the population. In order to achieve significant expansion of wind power in the United States, the
Department of Energy estimates an investment in new electricity transmission infrastructure of over $15 Billion would be required. Assuming wind farms would be responsible for half of this cost, this would increase the capital costs of a new wind farm by an estimated 7%. (DOE 2008)
Because of the difficulties in developing large amounts of wind power in wind rich areas, there are opportunities to take advantage of the unique characteristics of urban areas to promote wind
development. Urban wind projects do not need to rely on transmission and distribution infrastructure, so it will not require the same extensive investment in the electric grid infrastructure to develop. These projects can also take advantage of offsetting retail electricity use; the electricity generated can be valued at the retail electricity rate instead of the lower wholesale electricity rate. Further, there is increasing marketing power for individuals and businesses to appear green. Wind turbines are now a common element in advertising, even among companies with no presence in the energy industry. The presence of a wind turbine on one's property makes a statement about the owner's commitment to being environmentally responsible.
United Stlates -Annua Average Wind Speed at 80 m
Figure 1-2 United States wind resource map (Wind Powering America 2010)
t . I.. 3 3 2.2 LW ~4t ... 2 * '33 '3
Figure 1-3: United States population density map (US Census Bureau 2009)
'#3%,
Urban wind power projects present difficulties in economies of scale. Large turbines on tall towers can produce electricity more cost effectively but are impractical in many locations. Even when practical, they may be met with local opposition to their environmental, aesthetic, and public safety impact. However, urban wind projects have the potential benefits of requiring no transmission investment and the potential to offset retail electricity use. This reduces the capital cost and increases the value of the electricity produced. It is still a challenge to identify projects where these benefits offset the economies of scale that make larger turbines competitive in the electric power industry.
Worldwide electricity generation in 2006 totaled just over 18,000 TWh with a total genearation capacity of 4 TW. World Capacity is expected to grow to 5.5 TW by 2020 and 6.5 TW by 2030. The US accounted for 4,100 TWh of electricity use and Europe 3,500 TWh of Electricity Use. The total electric generation
capacity in the United States and Canada is about 1087 GW and capacity in Europe is 810 GW. (EIA
2009b) In the United States, wind capacity increased by 10 GW of installed power capacity in 2009 and
increased the total installed wind capactity to 35 GW, or about 3 % of the overall capacity and results in wind generation of 2 % of electricity generation. (AWEA 2010) Worldwide, almost 40 GW of wind power was installed in 2009, and the total capacity worldwide is over 160 GW. (GWEC 201) Most of this capacity has been installed in rural areas in large wind farms.
AWEA has estimated the US market for small wind turbines to consist of about 13 Million US residences and about 835,000 commercial and public buildings. The estimated potential installed capacity from these markets is about 138 GW and AWEA has set a long term goal of 50 GW for installed small wind turbine capacity in the US. (AWEA 2005) This is slightly more than the current installed capacity of large wind turbines in the US and would represent about 3% of the total projected energy generation in 2020. While these numbers are optimistic and the market has not grown as rapidly as projected in 2005, the targets illustrate the potential of small wind to play a minor but significant role in the electricity generation mix.
The focus of this paper is to examine the potential for growth of small wind turbine installations in urban, suburban, and rural areas. Urban will be considered any area where the built environment puts specific constraints on turbine height, visibility, allowable noise, and impact of shadow flicker. These constraints limit the size of turbines that may be installed at many urban locations. This requires the analysis to consider smaller wind turbines or alternative turbine designs that can be installed where these constraints make the installation of larger turbines impractical. This will be accomplished by
understanding what conditions are optimal for wind turbine development and what improvements in
turbine cost, technology, business strategy, city planning, and regulatory policy are needed to realize the benefits that small wind turbines can provide. Specific applications where the value of electricity can be considered greater than the retail price will also be considered.
Chapter 2: Overview of the Wind Industry
Wind power has been in use for at least 2000 years, with various sources recording use as early as 200 B.C. Unusual applications have been recorded for wind energy including powering an organ and driving Buddhist prayer wheels. (Tester et al. 2005) However, its primary historic uses were to drive mechanical equipment-mainly to pump water and grind wheat. (Stankovic et al. 2009) Today, in industrialized nations where a large portion of energy needs are met through electricity use, wind is used primarily for electricity generation.
2.1 Characteristics of Wind Energy
The amount of energy in a mass wind can be calculated from the mass of the air and the wind speed. More practically, the power of the wind moving through a cross sectional area can be found from the air density and wind speed. The power in the air increases with the cube of increases in wind speed (Wizelius 2007, Stancovic et al. 2009, Gipe 2009):
=
1pv3 (2-1)A 2
Where P is the power, A is the cross sectional area of the wind turbine, pis the density, and v is the wind speed. Thus, turbines with large cross sectional area in locations with high wind speed can produce the
most power. But wind turbines sited in areas of high wind speeds are more important. If the wind speed doubles, the power content in that wind increases by eight times.
It is also important to note that because of the cube relationship between wind speed and power, the average wind speed at a single location may not be sufficient to characterize the energy potential of a wind turbine sited at that location. Sites with larger variation in wind speed may have more power potential than sites with less variation but the same average wind speed.
Wind speed measured at a particular location tends to follow a Wiebull probability distribution (Wizelius
2007, Stancovic et al. 2009). The Wiebull distribution is usually characterized by a scale parameter and a
shape parameter. Alternatively, the distribution can be defined by its mean value and scale parameter. The Wiebull probability distribution has several properties that make it useful to model wind speeds. Most importantly, it has no possibility of negative values and has a long tail indicating low probability over a large range of high wind speeds. The shape of the distribution and tail is determined by the scale factor. However, since the power of the wind varies with the cube of the wind speed, the power that can be captured from the wind in the tail of the Wiebull distribution can be more significant. Two
Wiebull distributions with the same average wind speed but different shape parameters, k, are shown in Figure 2-1. Also shown is the relative total energy that can be captured over the distribution of wind speeds. Note the relative importance of the higher wind speeds in energy production of the blue
distribution representing a shape factor of 2. The area under the blue dashed curve is much greater than that of the red dashed curve indicating that the energy potential in wind speeds following the blue distribution is greater than that under the red distribution.
Weibull Distributions and Same Mean Wind Speed with Potential
Energy Distribution by Wind Speed
0 0
- Pobaihty ort Mean=-5m/s and K=3 nryForMen5msadK= -o n r FaMean=3. Smi/s anld K=2
0.
Wind Sped m
Figure 2-1: Wiebull distributions and energy output distribution
Wind speed also increases as height above ground increases (Wizelius 2007). Thus, a wind turbine placed on a taller tower will typically generate more energy than a turbine on a smaller tower at the same location. The rate of change of wind speed with height called the wind shear and knowing the wind speed at all heights at a location allow the generation of a wind profile. Placing turbines at higher altitudes to capture stronger winds must be balanced against the increased costs of taller tower heights. However, taller towers allow also allow larger rotors to be used and fewer turbines can produce the same output. (Khatri 2010) Estimates of tower costs for two different wind turbines are shown in Table 2-1. These costs show one aspect of the economies of scale of larger and taller turbines. Even if the cost/MW of the turbine itself does not scale well, increased output from being in higher and steadier wind coupled with savings in capital investment can greatly reduce the cost of energy generated from wind turbines.
Table 2-1: Tower costs increase for turbine size increase (Khatri 2010)
The strength and pattern of wind speeds both in a single location and over large areas have a significant impact on the development of wind projects. Wind turbines operate best when the wind reaching the turbine blades is not affected by natural or manmade obstacles. These obstacles tend to slow the wind
down and increase turbulence. Both of these changes to incoming wind reduce the potential
performance of a wind turbine. The features found in urban areas have significant impact on the wind patterns in and around the built environment. Urban areas present additional challenges in siting wind turbine projects over rural wind farms. (Stancovic et al. 2009)
Of particular importance to urban wind installations, in addition to variations of wind speed with height,
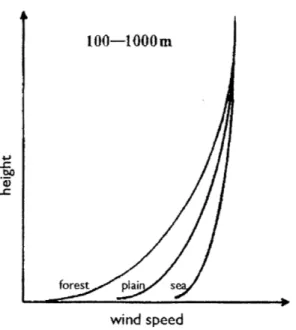
wind speed varies with the type of terrain over which the wind blows. Smooth surfaces such as the ocean or flat land with no vegetation or buildings produce the fastest wind speeds at the lowest elevations. As discussed previously, trees, buildings, and hills all disrupt wind flow, create wind shear, and decrease the wind speed at a particular location. Figure 2-2 shows this idea qualitatively by showing how wind speed changes with altitude over 3 different surfaces: flat water, a smooth plain, and a forest. These obstacles also create turbulence, which reduces the performance of wind turbine blades and increases the wear on turbine and it's supporting structure. In general, the best wind speeds exist above the tree canopy or building roofs in the area where the wind turbine will be placed. (Stankovic et al.
2007, AWEA 2010a) However, within an urban area, wind can be funneled around buildings creating
100-1000m
forest plai s
wind speed
Figure 2-2: Wind speed as a function of height above different surface features (Wizelius 2007)
A wind turbine cannot extract all of the kinetic energy out of the wind, as this would require reducing
the wind speed to 0. The maximum amount of energy that can be captured is known as the Betz limit. It is about 59%. (Wizelius2007 )
While wind power is a clean source of energy, it is also an intermittent resource. Thus, the power generated from a wind turbine is dependent on the current conditions of the wind. When the wind is not blowing, power must be provided from other sources. When the wind is blowing, its speed often varies, such that other generation sources must adjust their output to compensate for changes in the wind.
Wind turbines are available from as small as a few hundred watts up to a few Megawatts with at least one 10 MW wind turbine in development (SWAY 2010). Though no official standard for rating wind turbines exists, turbines are usually rated by their potential peak power output and this is referred to as nameplate capacity. This also roughly indicates the size of the turbine in terms of cross-sectional area, since most wind turbines are designed to achieve their rated power at around 13 m/s wind speed. Two wind turbines of the same rated nameplate capacity and similar efficiencies will likely have very similar cross-sectional areas and overall size.
A 1 MW turbine will typically have a maximum sustained power output of 1 MW. If it produced this
output continuously for an entire year, it would produce 8760 MWh of energy. Specific installations are described by a capacity factor, which is the percentage of theoretical output a specific installation is expected to achieve over the long term. Thus, a 1 MW Turbine with a capacity factor of 30 % would be expected to produce 2628 MWh/year (8760 hours/year x 1 MW x 30%) on average. The capacity factor depends on both the characteristics of the turbine and the wind conditions for a specific installation. For a wind farm, capacity factor would also include the effects of upstream turbines on the performance of downstream turbines. It could also include reductions in capacity from routine maintenance or other service interruptions. Turbines are also described by their efficiency, which is the maximum percentage of wind energy that can be converted to electrical energy.
The wind turbine industry often groups the turbines into several categories. Large turbines are those with a nameplate capacity of over 1 MW. Medium Turbines are those from 100kW to 1MW. Small Turbines are those less than 100 kW. Some discussions of turbines also separate Micro Turbines, those under 10 kW, from small turbines. (Sharman 2010)
Wind turbines achieve significant economies of scale at their current sizes. Wizelius notes that
increasing returns to scale is not an obvious property of wind turbines since weight of the turbine could be expected to increase by the cube of the turbine size, while it's swept area, the diameter of the turbine blades, would only increase by the square of the size. However, design optimization and increased height of the turbines has improved performance so that bigger turbines are still cost effective. (Wizelius 2007) The installed cost of large wind turbines in rural farms is typically $1500 to $2000 per Watt of capacity. For small wind turbines, the installed costs range from $3500 to $10,000 per Watt. (AWEA 2009)
2.3 TFurbine Performance
A turbines performance can be stated as the maximum percent of total energy extracted by the turbine
at its rated wind speed. This is known as the turbine's efficiency and is below the Betz limit of 59%. Commercially available turbines operate with maximum Cp values up to 45%. (Wizelius 2007) Figure 2-3 illustrates the typical efficiency of a turbine over a range of wind speeds.
Turbine Efficiency vs. Wind Speed
0.5 0 .4 ... .... ... . ... . 0.3 2 LU 0.1 . 0 0 5 10 15 20 Wind Speed (m/s)Figure 2-3: Wind turbine efficiency as a function of wind speed for a Siemens 1300 (Wizelius 2007) Because efficiency varies with wind speed, wind turbine performance is represented by a power curve, which indicates the power output of the wind turbine as a function of the incoming wind speed. The power curve has several important characteristics, the cut-in speed, the rated speed, and the cut-out speed. The cut-in speed is the minimum wind speed at which the turbine produces power. The rated speed is the minimum wind speed where the turbine produces its rated output. The output power from the turbine rises gradually and the wind speed increases from the cut in speed to the rated speed. Above the rated speed, output power is limited to the rated power. (Wizelius 2007, Gipe 2009) The extra power in the wind because of the higher wind speeds is not able to be captured. Above the cut-out speed, the turbine stops for safety reasons and no power is produced at extremely high wind speeds. Turbines also have a survival wind speed, which is the maximum wind speed the turbine can withstand without being damaged. The power curve for the 2.4 KW Skystream 3.7 wind turbine is shown in Figure 2-4.
Design of a turbine to have an efficient power curve is important. There is a tradeoff between increasing the cost of the turbine in order to lower the cut-in speed or increase the turbine's rating and rated speed, both of which offer potential to increase the output of the turbine. Since turbines are installed at different locations with different wind speeds, the optimal design of the turbine must consider the range of wind profiles likely to be seen at different installations.
Most wind turbines installed today contain three blades connected to a central hub mounted on top of a tall tower. The potential efficiency of the turbine increases as more blades are used, but so does the cost
of the turbine. The central hub connects through a gearbox to an electric generator, and power is converted from the generator's output to match the AC properties of the electric grid where it connects. The generator of a typical wind turbine operates asynchronously from the frequency of the electric grid, so power electronics are needed to condition the power from the wind turbine and send that power to the electric grid. These electronics also allow the turbine to meet other regulatory requirements
required by grid operators.
POWER
2 2800 2400 2000 1600 3 1200 0 Ct 800 400 0 nph 0 11 22.3 335 44.75 60 67.1 m 0 5 10 15 20 25 30 Wind SpeedFigure 2-4: Power curve of Skystream 3.7 (Southwest 2010)
Large wind turbines utilize active control systems to control the orientation of the wind turbine to align it with changing wind directions. The pitch of the turbine blades is used to control the aerodynamics and the amount of power transferred from the wind to the rotor-to maximize the power transfer at low wind speeds, and to limit it to the safe operating range of the generator and electronics at high wind speeds. (Wright 2009)
2.4 Wind Farm Developmenit
With the recent scale up in large wind turbine installations worldwide totaling 10's of GW in nameplate capacity per year and corresponding investments in the 10's of billions of dollars, the process of large wind turbine and wind farm development is well documented. A brief summary based on Wizelius' Wind
Project Development follows.
The process of commercial wind farm development begins by identifying areas with high average wind speeds, and therefore large amounts of energy conversion potential. Wind resource maps such as those in figure 1-2 are readily available. More detailed maps are available from NREL that allow specific site
selection. From the map, it is easily determined where the wind is strongest, and consequently, where a wind turbine can generate the most electricity. (Wizelius 2007)
When considering a site, however, the importance of transmission must also be considered. Transmission lines are not only a potential significant expense, but can take longer to site, permit, and build than generation resources. Once a suitable site is located and development rights obtained, several concurrent tasks are begun. First, detailed wind measurements at the site are obtained to verify with accuracy of the wind conditions at the site. Second, a detailed plan for developing the site is
developed. Third, an environmental impact study is performed. Finally, an integration study on connecting the wind turbines to the power grid must also be done. (Wizelius 2007)
Wind Farms generally do a detailed measurement of the wind resource at a specific site which is used to demonstrate how much power will be generated. The power is usually sold via a Power Purchase Agreement (PPA) to a utility company. Once the amount of electricity to be generated and the purchase terms are determined, financing for the project will be finalized. Assuming that the environmental
impact and permitting are completed, the wind farm can then be built. Building the wind farm involves building roads and other infrastructure for construction and maintenance equipment, building foundations for each turbine, erecting the towers, placing the nacelle (which contains the generator and
control equipment) on the tower, and finally attaching the blades. (Wizelius 2007)The electrical infrastructure must also be installed, including connecting to the transmission grid.
For large wind farms, this review can take several years and cost in the hundreds of thousands of dollars. In some cases where opposition to development is higher, those costs can increase substantially. However, for most standard development cases, the capital cost of wind turbines is about $1.5 Million to $2 Million per MW of capacity, and the upfront assessment and review costs are relatively small for a large wind farm of 100 MW or more.
Chapter 3: A Screening Model for Small Wind Turbine Performance
3.1 Overview
A screening model for a small wind turbine is developed to help understand what cost and performance
characteristics are required to make small wind turbines economically attractive in the applications discussed in Chapter 3. After the cost performance requirements are established, the value of technology improvements is evaluated in terms of meeting the required cost and performance characteristics.
The inputs to the model, along with the assumed baseline values, will be: Wind characteristics typical of application
Wiebull Distribution Mean Wind Speed, vaverage, 5.5 m/s Wiebull Distribution Shape factor, k = 2
Turbine Performance characteristics Turbine Efficiency, Cp
Peak Turbine Efficiency, Cpmax = 35%
Cut In Speed, vet.;n = 3.5 m/s (7.8 mph) Rated Speed, Vrated = 13 m/s (29.1 mph) Cut Out Wind Speed, vc tc,= 25 m/s (56 mph)
Peak Efficiency Wind Speed, vcpmax = veut-in + 1 m/s
Turbine Capital Costs, Co
Operation and Maintneance Costs as a Percent of Capital Costs/Year, a0
m = 3%
Retail Price of Electricity, Ecost, $0.04/kWh to $0.20/kWh Annual Increase in Electricity Cost = 2%
Discount Rate, rd = 10%
Cost of Capital, re = 7.8%
Incentives, rt, US Federal Tax Credit of 30%
From the model, we will be able to determine:
Target capital cost for a project that has 0 NPV. This will be referred to as the customer's willingness to pay for a wind turbine given a specific set of inputs. Reducing costs below the willingness
to pay will result in a positive NPV and make wind turbine installations economically attractive to customers facing the specific wind conditions and turbine costs used.
Levelized Cost of Energy, LCOE. This measure is commonly used to compare the cost of different generation sources as in Figure 1-1. It is a secondary consideration here, our main goal is to identify capital cost limitations. If a project is to have positive NPV, it's levelized cost of electricity will fall below the avoided cost or sale price for electricity.
The willingness to pay helps determine which applications should be a higher priority market for turbine manufacturers. The LCOE is useful in determining comparisons to other forms of electricity generation, including rooftop solar and conventional electricity. The assumptions used for values made above are described in more detail when the model is explained.
The model will be separated into 2 parts. The first part will use the turbine performance characteristics to determine the turbine's capacity factor. The second part will use the turbine performance and economic parameters to either find the Net Present Value of a turbine project, determine the retail price of electricity needed to achieve a zero NPV project, or determine the capital costs required to achieve a zero NPV project.
The impact of design choices to both the performance and costs can be considered by combining the two models.
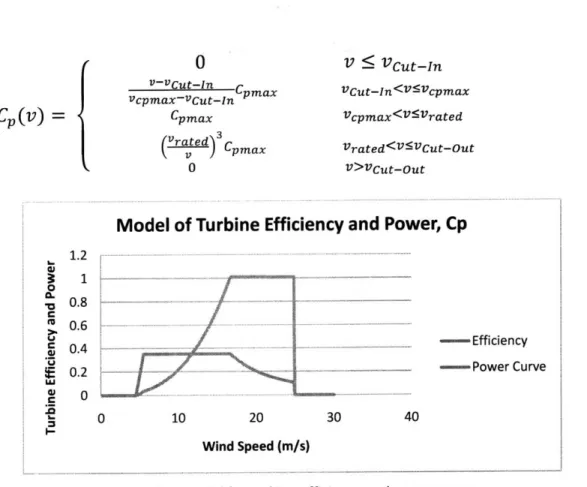
As was shown in Chapter 2, the performance of a turbine can be determined from the turbine's power curve and the wind speeds at the point of installation. Turbine power curves are usually described in terms of the performance characteristics listed above. We have also added a peak efficiency wind speed to allow for gradually increasing performance of the turbine at low wind speeds. The result is that the efficiency of the turbine will be assumed to follow the pattern described mathematically in equation
(3-1) and shown graphically in figure 3-1. This gives an approximation of the C, that was shown previously
in figure 2-3. This efficiency represents the complete system efficiency of the turbine. While this model is a simplification of real turbine efficiencies and power curves, it captures the major features and allows the model to be used to easily value turbine performance changes.
0
V VCut-Invc vcut-In Cpmax VCut-In<VsVcpmax vcpmax-vcut-In
CC(V)
CP~~~v)=te
Cpmax 0 3'V~t~~ Vcmax<V5Vrated (3-1) Vrated Cpmax Vrated<V5VCut-Out0 V>vcut-out
Model of Turbine Efficiency and Power, Cp
1.2 r S1 - --0 0.2 -. - ' 0.4 ---- ---Efficiency a) t 0.2 - - --- -Power Curve 0 10 20 30 40 Wind Speed (m/s)Figure 3-1: Model for turbine efficiency and power curve For the current analysis, the vcpmax will be assumed to be 1 m/s above the cut in speed.
The swept area of the turbine, A, can be implied by the rated speed and the peak efficiency of the turbine with this approach since we assume the turbine operates at peak efficiency and outputs the rated power at the rated wind speed.
A
= 2XPrated (3-2)
CpmaxxP XVrated
The power curve of the turbine can be found by multiplying Cp by the Power in the wind from equation 2-1.
P=
Cp (v)pAv
3 (3-3)Combining the previous 2 equations gives us the power curve for the turbine:
P(v)
= Cp(v)xPratedXV 3This equation only holds for conditions for which the rated power applies and neglects for example changes in air temperature, pressure, and density which may affect turbine performance.
The mean expected power output can be found from the power curve and the wind speed probability distribution by:
E[P]
=f
(v)P(v)dv
(3-5)And the expected capacity factor of the turbine is:
CF
E[P] (3-6)Prated
The capacity factor will be used as an input to the cost model.
3.3 Cost Model
The cost model will be based on determining a turbine's Net Present Value, NPV. The NPV analysis will be done using real dollars at the present time. The model will use as inputs the capital costs, yearly revenue, and expenses.
For this analysis, it is assumed that the typical customer is a home owner or small business owner who can obtain financing through a home equity loan. This will be used to determine the cost of capital. The current average rate as of April 2010 is 7.8%. (Bankrate.com 2010) The installation of a wind turbine
involves several risks, but early adopters of the technology will be likely willing to assume those risks at relatively low, or possibly even no increase in expected return. However, to have a significant market to develop a specific application, a positive level of return must be available to encourage adoption. The discount rate was chosen to slightly exceed the cost of capital. For this analysis 10% is used. For simplicity, it is assumed that capital costs will be repaid over the typical turbine lifetime of 20 years. Capital costs will be assumed to be obtained by borrowing on a home equity line of credit. The yearly payment is given by the annuity formula of:
rex(1-rt)Co = CAXCO CA rc(1-rt) (3-7)
A 1 = C 1
1
-(1+rc)T
We will assume that capital costs are paid at time 0 and revenue and maintenance costs for a full year is realized at the end of each year. The turbine lifetime will be assumed to be 20 years.
NPV = 1 (Rt-OM cAC) (3-8)
Capital costs, Co, will include the full cost of acquiring and installing, and commissioning a turbine. The capital cost less any incentives that are available for installation, such as the US Investment Tax Credit. The revenue turbine is simply the value of the electricity generated in terms of sale price or avoided cost. For small wind installations with net metering it is the retail value of the electricity replaced by the turbine which is given by:
Rt =
CF
x8760
XPrated
X(Ecost(t))
(3-9)The cost of electricity will be adjusted by any available incentives on electricity production. If we want to determine the capital costs assuming that the operation and maintenance costs are a constant fraction,
coM, of the capital costs:
20 (CFX8760XPratedXEcost(t)-(COM+CA)Co)
(1+rd)t (3-10)
If cA and com are constant over the lifetime of the turbine, zero NPV occurs for Co such that:
(CFx8760XPrated ) E2 0 (Ecost(t))
COt1 (1+r) (3-11)
(co+cA) 1(
1+rd)t
If the capital costs are normalized by the turbine's rated power the capital costs become:
(CFx8760) t= s(E cos(t))
C0 - )1-rt t
(3-12)
Prated (COM+CA)
~t1(+rd)t
20 1We can find the levelized cost of energy, LCOE, by setting the price of energy, Ecost, constant over the turbine's lifetime.
LCOE
= CO (COM+CA) (3-13)Prated (CFx8760)
Yearly power production is assumed constant over the lifetime of the turbine and annual operation and maintenance costs will be assumed to be 3% of the capital costs.
3.4 Summary
This model will enable the evaluation of cost and performance that is required to make small wind turbine installations economically desirable with and without government incentives. It does not consider other factors that might be considered in wind turbine performance including price premiums that customers are willing to pay for clean energy or the public relations value to commercial firms utilizing clean energy systems.
The model enables two calculations. The target cost for a turbines installed into a know wind speed and electricity rate can be determined. The levelized cost of electricity, LCOE, for a turbine installation can also be found. This allows the model to be used to determine the comparative advantage of
technologies with different cost and performance features, applications with different wind speed and electricity prices, and comparison with other technologies, most notably solar photovoltaic.
Chapter 4: Selection of Applications for Small Wind Turbines Technology
in Populated Areas
This chapter focuses on the various applications that have been considered for small wind turbines in populated areas. Wind turbines, even small turbines, have historically been used in rural applications or off grid applications. In this chapter the challenges and opportunities involved in selecting applications for installing wind turbines in the populated and built environments will be examined.
There are three advantages to generating electricity in urban wind installations instead of rural wind farms:
1. Can be offset or sold at the retail electricity price instead of the wholesale price
2. Avoids transmission losses
3. Does not require investment in new transmission
While wholesale electricity prices are often as low as $0.04/kWh, retail electricity prices can be as high as $0.20 cents/kWh in the US (EIA). Small urban wind installations can be designed to offset retail electricity use when installed taking advantage of net-metering or when developed using a PPA arrangement.
Transmission losses are responsible for 6.5% of the total electricity generated in the US in 2007. (EIA
2009b) These losses are part of the increased cost of retail electricity prices. Small wind installations
installed where electric load is used will not be subject to transmission losses.
Urban wind installations are a form of distributed electricity generation. In distributed electricity
generation, electricity is generated where it is used instead of at large centralized power plants and does not need to be connected into a transmission line with limited capacity on the electric grid or have new transmission lines built to integrate that wind power. It connects directly to user's loads and can feed
back to the grid when excess electricity is being generated.
There are several challenges to building mounted and building integrated wind turbines. (Dutton et al. 2002).
1. Assessment and understanding of wind turbines
2. Effects of noise and vibration on building and occupants
4. Non-technical issues such as permitting, financing, safety, and insurance.
Additional challenges in the industry were outlined in a 2002 industry roadmap for the small wind turbine industry. They include (AWEA 2002):
1. High capital costs 2. Insufficient reliability 3. Lack of standards
4. Lack of sustained incentives
Many other aspects identified in the AWEA industry roadmap have been improved at least partially, including issues with power electronics, state incentives, interconnection standards, and undervaluation of renewable energy.
With the exception of the effect of turbine vibration on buildings, those challenges generally apply to freestanding turbines in urban areas as well. There are also four distinct market segments for small urban wind turbines. (Stankovic et al. 2009)
1. Building mounted or building integrated wind turbines 2. Small stand alone wind turbines
3. Large wind turbines sited in populated areas 4. Off grid wind turbine systems
The type of turbine is somewhat dependent on the location and application of the installation. Table 4-1 Illustrates four typical applications that will be focus of the remainder of this paper. The analysis will determine the requirements for success in each application. The wind speed ranges were estimated from the Warwick Wind Trials report which studied several building mounted urban wind turbine installations. (Encraft 2009)
Where the previous chapter provided an overview of the wind power industry in general, in this chapter the focus is on issues and challenges that must be overcome when developing urban wind installations from technological, economic, and societal aspects.
Table 4-1: Typical applications for urban wind turbine installations
Location Application Wind Speed Reference Wind Capacity Factor Technologies
(% of Wind Speed for 7 m/s for 7 m/s Wind Used Atlas Speed) Wind Atlas Atlas Speed.
Speed
Rural/ Big Backyard 80-90% 6.0 m/s 21.1% X
Suburban
Suburban/ Tall Rooftop 70-80% 5.0 m/s 12.9% X X
Urban
Suburban/ Roof Edge 55-70% 4.0 m/s 6.3% X X
Urban
Suburban/ Low Rooftop 50-60% 3.5 m/s 3.9% X X
Urban
4.1. Urban Wind Resources
As discussed in Chapter 2, the best wind for generating electricity is a strong undisturbed wind blowing over a smooth, flat landscape. Urban areas consist of buildings, roads, bridges, signs, towers, trees and other objects which disrupt the wind flow and increase turbulence.
The result of these obstacles to wind in the urban and suburban landscape is to raise the effective ground level for wind to the height of the surrounding structures. (Sharman 2010) Taking this view, wind turbines in the built environment need to be installed above rooftops, trees, and other significant structures in a specific area. (Heath et al. 2007) This results in two obvious locations for wind turbines. The first is to build on and above the rooftops of existing structures and the second utilizes pole mounted turbines with their own foundations away from buildings.
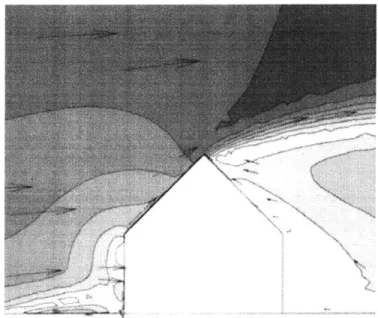
Figure 4-1 shows the results of a computational fluid dynamics, CFD, model of how wind flow changes as wind passes over a typical house. (Heath et al. 2007)This figure illustrates some of the technical
challenges associated with harnessing the wind flow over a building through a roof mounted turbine. The wind flow appears to vary greatly and is generally not horizontal which will tend to reduce the
wind direction changes. The higher above the roof the turbine is mounted, the cleaner the wind appears to be.
Figure 4-1: Wind flow over an isolated house (Heath et al. 2007)
Figure 4-2 is a similar model for wind flow over a typical commercial office building. Mertens has done extensive analysis of wind flow over buildings and predictes that properly sited turbines mounted on the roofs of typical buildings could double the energy output of a free standing wind turbine in the same environment. If mounted on spherical buildings the output could be 4 times as much as a free standing turbine. However, Mertens considers only the flow only a single building with the surrounding
environment approximated by adjusting the surface roughness of the surrounding terrain.
K]
Figure 4-3 shows the overall flow further from the house describing the area impacted by the wind obstruction created by a building. (Gipe 2009) From this diagram, which might be more typical of suburban or rural installations, it can be noted that a building disrupts the wind flow at heights up to twice the building height and up to 20 times the building height away from the building. This figure
illustrates the importance of installing wind turbines above nearby obstacles and a sufficient distance away from buildings whenever possible.
REIN Of HIGHtY
PREYMLIMIND DISTURBED FOW
Figure 4-3: Effect of buildings on wind (Gipe 2009)
There is considerable understanding of how wind affects pedestrian comfort in cities. However, this work is only just starting to be adapted to wind turbine siting and performance. It has been suggested that urban wind tunnel effects can be used to increase the capacity factor of urban wind turbines. (Dutton et al. 2002, Heath et al. 2007) Air flow accelerates in the vicinity of buildings as the air passes by the building. It is likely that this stronger wind has increased turbulence. Figure 4-4 is a CFD model of flow around an array of buildings. It is clear there is some wind tunnel effect on the perimeter of the buildings, but the middle and trailing buildings see less of an acceleration effect. The cost of modeling and measuring an urban area to identify where urban wind tunnels are usable by wind turbines is not known. Companies such as Meteodyne are selling software to model wind flow in urban areas for wind turbine siting. (Meteodyne 2010) However, no success stories using CFD modeling were identified. While CFD models of individual building geometries can be used to identify wind tunnel effects, when the view is expanded to involve a cluster of buildings, the applicability of the results on a single building may no longer be valid. In addition, in areas where new construction is likely, there is also a risk of a good wind location being blocked by the construction of a new building.
Figure 4-4: Overhead view of wind flow through an array of buildings. (Heath et al. 2007) Adobe systems placed 20 vertical axis wind turbines each capable of 1.2 kW output on an outdoor sixth floor terrace at its headquarters in San Jose, CA. One reason noted for the location was wind tunnel effect created by the building's 3 towers that surround the terrace. Published reports indicate that the turbines experience average wind speeds of 13-14 mph or about 6 meters per second and the 20 turbines each rated at 1.2 kW are cumulatively expected to produce 50 MWh/year of energy. Although the cost of the installation is not disclosed, the turbines typically cost $9,000 to $12,000 installed. (Bailey 2010) Using this information, the installation cost is between $7/Watt and $10/Watt. Sam's Club in Palmdale, CA recently installed 17 2.4 kW wind turbines on top of parking lot light poles. This installation is expected to generate 76 MWh/year of energy.
Using this data, the predicted capacity factor for the site can be calculated. It is found by the following equation (Wizelius 2007):
kWh
Energy Produced
(
)
Capacity Factor
= earPower Capacity (kW)x8760 year
year
For the Adobe installation, the expected Capacity Factor, CF, is 24% and the Sam's club installation it is 21%. The Adobe installation is designed to specifically take advantage of wind tunnel effects of
surrounding buildings. The Sam's club installation uses turbines that appear to be above the roofline to take advantage of the strong winds in the Palmdale, CA area. These values are much larger than the results of obtained in the Warwick Wind Trials or a study done for the Massachusetts Tehcnology Collaborative (Shaw 2008). Both Warwick Wind Trials and the MTC study determined an average capacity factor of 4% for the systems they studied. The Warwick study figure notes that its capacity factor is only for times when the turbines were in operation. If downtime of turbines is also considered, the warwick wind trials capacity factor was was below 1 % (Encraft 2009, Shaw 2008)
The Warwick Wind Trials performed an extensive testing of small wind turbine installations, including comparisons of actual wind conditions at turbine installation against the reference wind speeds provided by the UK's NOABL database at each turbine location. The results indicate significant
adjustments downward to mapped wind speed data estimates provided by the UK's NOABL database. Only the single rural site and two of three high rise mounted turbines fell within 10% of speed estimates. (Encraft 2009)
The Energy Savings Trust also performed a series of small wind turbine trials. They conclude that location is very important for small wind turbines, and that building mounted turbines perform much less efficiently than pole mounted turbines. (Energy Saving Trust 2009)
Finally, a Cadmus study for the Massachusetts Technology Collaborative illustrates the difficulty of estimating wind speed and energy output for a typical wind installation in the urban environment. Among 19 systems installed under a program developed by the Massachusetts Technology
Collaborative, in only 1 case did the system energy output reach even 50% of the installer's predicted output. And in 9 of the 19 cases, the system output less than 20% of the installer's predicted energy output. This is true even if the wind turbines were sited at least 30 ft above surrounding obstacles. Cadmus notes several reasons for the discrepancies including uncertainty in published wind resource data, surrounding obstacles, inverter efficiency, and wind turbulence effects. (Shaw 2008)
The results indicate that those turbines mounted on high rise buildings above other nearby obstructions generally saw better wind speeds than those on lower buildings and those turbines installed that were nearby significant obstructions at the turbine height.
4.2 Environmental Effects of Urban Wind
The environmental impact of rural wind farms includes determining impact on the natural environment, plant life, animal life, wetlands, the effects of noise and shadows on any nearby inhabitants, and
possible impacts on aviation. For suburban and urban installations, the effects of noise and shadow are increased while the effects on an already developed landscape may be less important in many
circumstances.
The impact of noise on an inhabited area may place practical limits on the design or size of turbines located in an urban area. Smaller turbines typically produce less noise. Potential impacts of flicker may limit the size and the height of the turbine, since increases both factors impact how much shadow flicker will affect nearby inhabitants.
Wind turbine vibration issues make building mounted turbines potentially unsafe. (Gipe 2009, Stancovic et al. 2009) Additionally, even when the building structure is safe, noise and vibration may prove
disruptive a building's occupants. In Warwick Wind Trials of building mounted wind turbines, 7 of the 26 turbines, including all of the best performing building mounted turbines were turned off either part of the time or full time because of noise or vibration issues disturbing the building occupants. (Encraft
2009) Others have noted that rooftop mounting typically results in noise and vibration issues and that
the savings from eliminating the tower and foundation of the turbine are not as significant as perceived. (Gipe 2009) However, the Boston Museum of Science has five building mounted turbines successfully installed for six months, Aerovironment turbines are successfully installed on 2 buildings in the Boston area, and Boston city hall has a roof mounted Skystream 3.7. One significant consideration might be to consider whether the building is residential, as in the Warwick Wind Trials, or commercial as in the other examples noted above.
Other environmental concerns, including those about effects on the natural environment and about wildlife, particularly birds, are of less importance in urban wind where the urban environment already has significant impact.
43',' UJrbanr WindlTurbine
The design used for large wind turbines is primarily a three bladed Horizontal Axis Wind Turbine, or HAWT. In attempts to reduce cost and improve the performance of small turbines in much more uncertain and variable urban environments, a large number of different designs are already on the
A number of vertical axis wind turbines, or VAWT's, and some HAWT's that are based on similar concepts to VAWT's are on the market. Proponents of VAWT designs claim that these units are more tolerant of the turbulent and variable wind conditions that are found in urban environments and discussed above. However, there is no historical data available to confirm this claims (Stankovic et. al
2009)
Several currently available turbine designs are discussed in Table 4-2 and 4-3. Table 4-2 shows list price for turbines including the turbine's tower but before any further site preparation and installation costs. Table 4-3 shows a sample of published installed turbine costs.
A datapoint on the Proven 6 kW turbine installed by Cace has been excluded from the list in Table 4-3. The installed cost (C20,000) given was lower than the list price of the 6 KW turbine obtained from
Proven's website and resulted in a cost in US dollars per watt of $4.50, significantly lower than other installations listed. Further information on how this data point was obtained was not available so it will not be considered for determining a low point for installed cost per kW.
Table 4-2: Pricing for selected small wind turbines before installation
(Windspire 2010, Southwest 2010, Proven 2010, Ampair 2010, Bergey 2010, Turby 2010) Manufacturer Model Capacity Uninstalled Price Cost ($/Watt)
(kW) (w/Tower)
Windspire Energy Windspire 1.2 $6,500 $5.42
Turby Turby 1.9 C13,000 ($17,550) $9.24
Southwest Windpower Skystream 3.7 2.4 $10,000 $4.17
Proven 7 2.8 E12,100 ($18,600) $6.65
Ampair 6000 6.0 E18,000 ($27,700) $4.62
Proven 11 6.0 E19,600 ($30,200) $5.04
Bergey Bergey-Excel 10.0 $40,000 $4.00
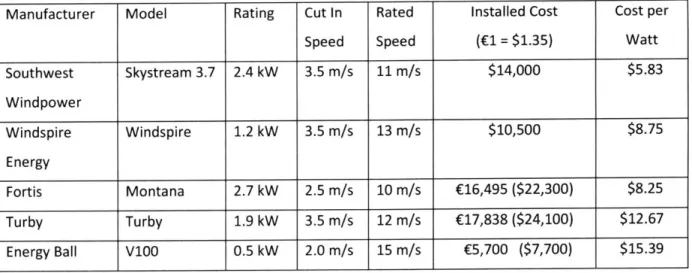
Table 4-3: Currently available small turbines with example installed costs (Cace et al. 2007, Bailey 2010)
Manufacturer Model Rating Cut In Rated Installed Cost Cost per
Speed Speed (U = $1.35) Watt
Southwest Skystream 3.7 2.4 kW 3.5 m/s 11 m/s $14,000 $5.83 Windpower Windspire Windspire 1.2 kW 3.5 m/s 13 m/s $10,500 $8.75 Energy Fortis Montana 2.7 kW 2.5 m/s 10 m/s (16,495 ($22,300) $8.25 Turby Turby 1.9 kW 3.5 m/s 12 m/s (17,838 ($24,100) $12.67 Energy Ball V100 0.5 kW 2.0 m/s 15 m/s C5,700 ($7,700) $15.39
While the more established firms such as Southwest Windpower, Bergey, and Proven have all used the familiar 3 bladed HAWT turbine design, many of the new entrants in the field are developing VAWT or other style turbines including Windspire Energy (formerly Mariah Power) and Turby. As more data becomes available on VAWT designs the value of both their performance compared to that of HAWT designs, and their potentially more acceptable aesthetic design may become a key factor for shaping the future of wind in both urban and non-urban areas.
As stated earlier, capital pricing is a significant issue. While installation at every site must be considered when determining installation costs, costs for small wind turbines before installation range from a minimum of $4/Watt and up for the turbine, and installed costs ranging from $5.83/Watt and up. This compares to the $3.50/Watt low end price stated by AWEA in their 2008 Small Wind Turbine Tarket Report (AWEA 2009) cited in Chapter 2.
4.4
T he
Urban Wind Market
an.d the
Small Wind Industry
Several mid-size and large wind turbines have been installed in urban areas. In the Boston, Massachusetts area there are several large turbines that are listed in Table 4-4. Selected smaller turbines installed around the Boston area are shown in table 4-5. There have been numerous