HAL Id: hal-00701986
https://hal.archives-ouvertes.fr/hal-00701986
Submitted on 29 Jun 2020
HAL is a multi-disciplinary open access
archive for the deposit and dissemination of
sci-entific research documents, whether they are
pub-lished or not. The documents may come from
teaching and research institutions in France or
abroad, or from public or private research centers.
L’archive ouverte pluridisciplinaire HAL, est
destinée au dépôt et à la diffusion de documents
scientifiques de niveau recherche, publiés ou non,
émanant des établissements d’enseignement et de
recherche français ou étrangers, des laboratoires
publics ou privés.
carbohydrates from the Rhone River into the
Mediterranean Sea
Christos Panagiotopoulos, Richard Sempere, Julien Para, Patrick Raimbault,
Christophe Rabouille, Bruno Charrìère
To cite this version:
Christos Panagiotopoulos, Richard Sempere, Julien Para, Patrick Raimbault, Christophe Rabouille,
et al.. The composition and flux of particulate and dissolved carbohydrates from the Rhone River
into the Mediterranean Sea. Biogeosciences, European Geosciences Union, 2012, 9, pp.1827-1844.
�10.5194/bg-9-1827-2012�. �hal-00701986�
www.biogeosciences.net/9/1827/2012/ doi:10.5194/bg-9-1827-2012
© Author(s) 2012. CC Attribution 3.0 License.
Biogeosciences
The composition and flux of particulate and dissolved carbohydrates
from the Rhone River into the Mediterranean Sea
C. Panagiotopoulos1, R. Semp´er´e1, J. Para1, P. Raimbault1, C. Rabouille2, and B. Charri`ere1
1Aix-Marseille Univ., Mediterranean Institute of Oceanography (MIO), UMR 7294, CNRS/INSU, UMR 235, IRD, 13288,
Marseille, Cedex 09; Universit´e du Sud Toulon-Var (MIO), 83957, La Garde cedex, France
2Laboratoire des Sciences du Climat et de l’Environnement (LSCE), Laboratoire Mixte CNRS-CEA, 1 Avenue de la Terrasse,
91190 Gif sur Yvette, France
Correspondence to: C. Panagiotopoulos (christos.panagiotopoulos@univ-amu.fr)
Received: 27 September 2011 – Published in Biogeosciences Discuss.: 22 November 2011 Revised: 3 April 2012 – Accepted: 8 April 2012 – Published: 24 May 2012
Abstract. Carbohydrates are important components of the
carbon cycle and may be used as indicators of the origin and the diagenetic status of marine and terrestrial organic mat-ter. Nevertheless, comprehensive studies of both particulate (PCHO) and dissolved (DCHO) carbohydrates in rivers are scarce, and the seasonal and interannual variability of these compounds in relationship to the bulk particulate (POM) and dissolved organic matter (DOM) is largely unknown. For the period 2007–2009, we sampled once per month POM and DOM and measured the total suspended matter (TSM), POM, DOM, PCHO, and DCHO for the Rhˆone River, which flows into the Mediterranean Sea. Using these measure-ments, we estimated for the above parameters annual fluxes for the period 2007–2009. The estimated carbohydrate fluxes averaged 0.064 ± 0.026 × 10¹⁰moles C yr−1 for PCHO and 0.042 ± 0.008 × 10¹⁰moles C yr−1DCHO, representing 6 % and 7 % of the annual flux of POC and DOC, respectively. During flood and low-water periods, POM variations were reflected into the PCHO pool, whereas this was not observed for DOC and DCHO, indicating a decoupling between partic-ulate and dissolved organic matter. Our results also showed that flood and low-water periods may be differentiated using the ratios PCHO/DCHO and POC/DOC, which had a signif-icant relationship.
Based on the carbohydrate abundances in both the PCHO and DCHO pools, we conclude that this material mainly de-rives from allochthonous sources (vascular plants, bacteria and soils). Moreover, during flood events, an enrichment in mannose in POM was observed, probably reflecting an an-giosperm source (leaves or grasses). By expanding our
re-sults to the northwestern Mediterranean Sea (Gulf of Lions), we found that the total organic carbon (TOC) fluxes of the Rhˆone River accounted for ∼1 % of the standing stock of seawater TOC. Considering that glucose is the most abundant carbohydrate in both particulate and dissolved organic matter pools (∼33 %), its annual flux in the northwestern Mediter-ranean Sea was estimated to 3.8 × 10⁸moles glucose.
1 Introduction
Particulate and dissolved organic matter (POM and DOM) in river systems constitute a small pool of organic carbon (∼0.02 Gt C, assuming an average riverine freshwater
vol-ume of 2000 km3and an average POM and DOM value of
5 mg C l−1ea.) nevertheless, it affects the global carbon bud-get not only because it serves as an important substrate for various organisms, including bacteria (Vannote et al., 1980; Semp´er´e et al., 2000; Bergfeld et al., 2009), but also be-cause it constitutes a major source of reduced carbon to the world’s oceans, with an annual flux of ∼0.4 GT yr−1
(Mey-beck, 1982, 1983; Aufdenkampe et al., 2011). Moreover, riverine POM and DOM play a key role in several physical (e.g. erosion, sediment transport and accumulation, floods) and chemical processes (e.g. weathering of rocks, adsorp-tion and desorpadsorp-tion reacadsorp-tions, coagulaadsorp-tion, UV transforma-tions) occurring within the drainage basin and the river itself (Vigier et al., 2001; Mopper and Kieber, 2002 and references therein; Dagg et al., 2004; McKee et al., 2004; Mallin et al., 2006).
Increasing attention is now being given to the dynamics and sources of POM and DOM in rivers because they signif-icantly influence fisheries production and water quality (e.g. transport of pollutants, metal complexation) and also provide a record of natural and anthropogenic activities within the drainage basin (e.g. landscape sustainability, water clogging, river flow redistribution) (Kao and Liu, 1996, 1997; Solomon et al., 2000). Nevertheless, the chemical composition and processing of riverine organic substances is not well known because it is a complex function of diverse physical, chemi-cal, and biological processes; therefore, comprehensive anal-yses across dissolved and particulate forms are limited.
In general, characterizations of riverine POM and DOM concern analyses of bulk chemical properties (e.g. elemental composition and stable carbon isotope analyses) or measure-ments of broad compound classes (e.g. total carbohydrates or total amino acids). Analyses of individual compounds are scarce and typically involve components of only a family of compounds (e.g. lipids). However, previous investigations in rivers have suggested that POM and DOM are derived from decaying terrestrial plants (Opsahl and Benner, 1999) or in situ algal production (Kendall et al., 2001) and are thus rich in carbohydrates. Other minor compounds include nitrogen-free biomacromolecules such as terpenoids, humics, alkanes, phenols, tannins, and lignins (Degens et al., 1991; de Leeuw and Largeau, 1993; Kujawinski et al., 2002). Compared with carbohydrates, these nitrogen-free biomacromolecules are highly resistant to microbial degradation; however, pho-tochemistry appears to control the decomposition of these biorefractory substances (Opsahl et al., 1999; Mopper and Kieber, 2002 and references therein).
Because rivers are dynamic ecosystems, it is also impor-tant to study the composition of POM and DOM through-out the seasons to estimate the watershed mass transport (i.e. flux) of the organic matter. Again, most of the pre-vious studies in rivers have been confined to seasonal bulk measurements of the concentrations of POM and DOM, sta-ble radiogenic isotopes (e.g. δ15N, δ13C, 114C; Alin et al., 2008), lignin biomarkers (Spencer et al., 2010) and very lit-tle is known about the temporal variability of other labile biochemicals (e.g. carbohydrates, amino acids; Hedges et al.,1994; Aufdenkampe et al., 2007).
Freshwater inputs from rivers play a major role in the Mediterranean Sea because they significantly enhance the primary productivity through the transport of carbon and nu-trients (Moutin et al., 1998; Semp´er´e et al., 2000), and they contribute to the balance of water inputs through the Strait of Gibraltar (Copin-Mont´egut, 1993; Bray et al., 1995). Since the damming of the Nile, the Rhˆone River is the main con-tributor of freshwater to the Mediterranean Sea, accounting for approximately 50 % of the total freshwater discharge into the sea (Margat, 1992; Bethoux and Gentili, 1999).
For the last decade, the Climate and Human-induced Al-terations in Carbon Cycling at the River-seA connection (CHACCRA) group has been investigating the cycling and
fluxes of bioactive elements, their potential impact on the climate, and the effects of hydrology changes on the Rhˆone River. However, these investigations focused on measure-ments of POM, DOM, nutrients, dissolved inorganic car-bon (DIC), chromophoric dissolved organic matter (CDOM), total suspended matter (TSM) fluxes, and freshwater dis-charges (Coste and Raimbault, 1993; Semp´er´e et al., 2000; Pont et al., 2002; Para et al., 2010); therefore, little infor-mation regarding labile biochemicals (e.g. carbohydrates) in both particulate and dissolved fractions is currently avail-able. In addition, previous data on the export of labile or-ganic material and its relationship with the bacterial carbon demand, as previously assessed by Semp´er´e et al. (2000) for the Rhˆone River, cannot be validated if the relationships of organic chemical compositions to biological sources and the biodegradation mechanisms are not taken into account.
Here we report the first analyses of individual particu-late and dissolved carbohydrates over a period of two years (2007–2009) along with DOM and POM measurements for the Rhˆone River. The organic material was collected during contrasting discharge conditions at a gauging station located approximately 50 km above the river mouth (see sampling site for details). Using these data, we estimated the carbohy-drate fluxes from the Rhˆone River into the Mediterranean Sea over the same period and evaluated the major organic matter sources and degradation mechanisms occurring in the area. In this study, the objectives were the following:
a. To give an estimate of the annual fluxes of particu-late and dissolved carbohydrates into the Mediterranean Sea;
b. to contrast the carbohydrate composition of POM and DOM collected during floods and low water discharge periods; and
c. to examine the distribution of the carbohydrates and de-termine whether carbohydrates can be used as tracers of organic matter sources and biological activities.
2 Study area and sampling
The Rhˆone River is 816 km long, drains an area of
100 × 103km2, and has average annual discharge of
53 × 109m3of water and 10 ± 5 Mt of sediment (Ibanez et al., 1997; Semp´er´e et al., 2000; Pont et al., 2002; de Madron et al., 2003; Rabouille et al., 2008). The river stage fluctuates by 2 to 6 m annually, with a peak discharge in early spring and late autumn and a minimum in summer (Pont et al., 2002). The main tributaries of the Rhˆone River include the Saˆone River (433 m3s−1)that has an oceanic pluvial regime (highest discharge in winter), the Is`ere River (336 m3s−1), and the Durance River (173 m3s−1). Inundation events are not observed due to the excessive canalization (with rare ex-ceptions occurring near the delta in the Camargues area);
therefore, extensive interaction of river water with the sur-rounding floodplain and its vegetation is small.
The Rhˆone Delta is divided into two outlets, the Petit Rhˆone and the Grand Rhˆone, corresponding to 20 % and 80 % of the water flow, respectively (Ibanez et al., 1997). The water samples analyzed in this study were collected between May 2007 and June 2009 at the town of Arles, which is lo-cated on the Grand Rhˆone (47.5 km upstream of the Mediter-ranean Sea). The Grand Rhˆone does not cross any productive marsh area (e.g. Camargues area) therefore the fluxes mea-sured at Arles are nearly the same to those at the mouth of river. The collection site is among those routinely studied over the last two decades by the French scientific community (Moutin et al., 1998; Semp´er´e et al., 2000; Pont et al., 2002; Sicre et al., 2008; Ollivier et al., 2010). Water samples were collected at the SORA observatory station near the Com-pagnie Nationale du Rhˆone (CNR; http://www.cnr.tm.fr/fr/) gauging station in Arles at a distance of 7 m from the right bank and 0.5 m under the surface (Eyrolle et al., 2012). The sampling site has a rectangular cross section (width of the river ∼150 m) and previous studies have shown that the verti-cal and horizontal distribution of suspended matter generally remains uniform (Pont et al., 2002).
3 Methods
Water samples were collected using automatic samplers in-stalled in the observatory station. Each daily sample was the sum of 16 subsamples (150 ml) collected every 90 min in polyethylene flasks containing 5 ml of HgCl2as a
preserva-tive, providing as such integrated daily samples. Each sam-ple was then filtered (100 to 500 ml according to the concen-tration of suspended particulate matter, TSM) through pre-weighted GF/C glass fiber filters to collect suspended matter. The filters were dried and weighted to determine the total suspended matter concentration of (TSM in mg l−1). Then, filters were analyzed for particulate organic carbon (POC) using the wet-oxidation procedure (see below). Organic car-bon content (OC %) of suspended matter was estimated by dividing the weight of organic carbon by the weight of TSM. For particulate and dissolved carbon studies, river water (1–2 l) was collected once per month in glass bottles that were cleaned with 2 % of HCl. The bottles were closed with Teflon-lined screw caps and kept in the dark at 4◦C be-fore filtration. The samples were brought to the lab in dry ice (<24 h) and filtered through 0.7 µm retention-size filters (GF/F-47 mm; P < 6.7 kPa) to separate the particulate and dissolved fraction. Prior to filtration, the 0.7 µm GF/F filters were flushed with Milli-Q water and a small volume of the sample to minimize contamination (Yoro et al., 1999). De-pending on the content of the organic matter in the samples, 200 to 500 ml of water was filtered for subsequent particulate carbon and carbohydrate measurements. In general, for each water sample, two filters were obtained, unless more sample
was available (n = 4). Immediately after filtration, the filters were rinsed with a few ml of Milli-Q water to eliminate salts and then freeze dried. After lyophilization, the filters were dried in a desiccator for 24 h and then stored in the dark at −20◦C until analysis. All glassware (i.e. bottles, vials, am-poules, and pipets) used in this study, including GF/F filters and quartz wool, were combusted at 450◦C for 6 h prior to use.
The 0.7 µm-filtrates were re-filtered through 0.2 µm retention-size filter (polycarbonate filter-47 mm) previously rinsed with 5 % HCl, Milli-Q water, and 50 ml of the sam-ple. Triplicate sub-samples were collected for DOC analy-ses and transferred into 10 ml-glass ampoules (Wheaton®), which were previously rinsed 3 times with sample. Then, 20 µl of H3PO4acid was added as a preservative, and the
am-poules were flame-sealed. The amam-poules were stored in the dark at 4◦C until further analyses. The remaining sample was used for dissolved carbohydrate analyses and stored in poly-carbonate bottles in the dark at –20◦C. Similarly as above, for
the the dissolved carbohydrates analyses, two sub-samples of the same water sample were analyzed, unless more sample was available (n = 4).
3.1 Particulate and dissolved organic carbon (POC &
DOC) determination
To remove inorganic carbon, the GF/F filters with collected particles were covered with 100 µl of 0.5 N H2SO4and then
dried at 60◦C. The POC analyses on the filters were carried out using high temperature combustion (900◦C) performed on a CN Integra mass spectrometer (Raimbault et al., 2008). Analytical errors based on duplicate analysis were approxi-mately 5 %.
DOC concentration was measured by high temperature combustion on a Shimadzu TOC 5000 analyzer, as described in Sohrin and Semp´er´e (2005). A four-point calibration curve was constructed daily with standards prepared by diluting a stock solution of potassium hydrogen phthalate in Milli-Q water. To avoid random errors associated with day-to-day instrument variability, all of the samples from a given exper-iment were analyzed in a single day. The procedural blanks (runs with Milli-Q water) ranged from 1 to 2 µM C and were subtracted from the values presented here. Deep seawater reference samples (provided by D. Hansell; Univ. Miami) were run daily (43.5 µM C, CV = 2–3 %, n = 4) to check the accuracy of the DOC analysis. Total organic carbon (TOC) concentrations were estimated by summing POC and DOC.
3.2 Particulate and dissolved carbohydrates (PCHO & DCHO) determination
3.2.1 Carbohydrate extraction and isolation
Filters for the PCHO analysis were cut out with clean scissors and transferred to 40-ml glass tubes with Teflon-lined screw caps. A few ml of 12 M H2SO4were added using a pipette,
and the samples were allowed to sit for 2 h at room temper-ature, after which the acid was diluted to 1.2 M with Milli-Q water. Then, the samples were sparged with N2 and
hy-drolyzed in a sand bath for 3 h at 100◦C (Cowie and Hedges, 1984; Panagiotopoulos and Wurl, 2009). The hydrolysis was stopped by placing the tubes in an ice bath for 5–10 min.
Aliquots of 7 ml were neutralized with CaCO3
(precom-busted at 450◦C for 6 h) in 10 ml glass tubes. Prior to
neutral-ization, adonitol, at a final concentration of 1 µM, was added to the sample as an internal standard to estimate the losses during the neutralization steps. After neutralization, the sam-ples were centrifuged 3–4 times at 4000 rpm for 5 min, and the supernatant was filtered through quartz wool and pipet-ted into scintillation vials. The vials were frozen at 4◦C until time of analysis (this never exceeded 24 h).
For the DCHO analysis, two aliquots each 9 ml of the 0.2 µm-filtered sample were freeze dried, and the obtained powder was treated using the above procedure (i.e. hydroly-sis, and neutralization). Because of the low salinity (<1 ‰) of the sampling site, our water samples did not require any further treatment (e.g. desalination steps).
3.2.2 Liquid chromatography
A Dionex ICS-3000 anion exchange chromatograph fitted with a pulsed amperometric detector (HPAEC-PAD) was used for all carbohydrate analyses. The separation of the carbohydrates was performed on a Dionex CarboPac PA-1 analytical column and a Dionex CarboPac PA-1 guard col-umn. An amino trap was placed before the guard column to retain amino acids and similar compounds, which may inter-fere with the carbohydrate analysis. The analytical column, the guard column, and the amino trap were placed into a ther-mal compartment. The temperature of the compartment was set at 17◦C, which was found to be optimal for the separation of the monosaccharides in previous studies (Panagiotopoulos et al., 2001; Panagiotopoulos and Semp´er´e, 2005a). Sugars were detected by an electrochemical detector (ED40-Dionex) set in the pulsed amperometric mode (standard quadruple-potential). Data acquisition and processing were performed using the Dionex software Chromeleon.
Analytical conditions
Eleven individual monosaccharides were detected in the hy-drolysates of the particulate and dissolved organic mate-rial, including deoxysugars (fucose, and rhamnose), pen-toses (arabinose, ribose, and xylose), one amino sugar
(glu-cosamine), hexoses (galactose, glucose, and mannose), and acidic sugars (galacturonic, and glucuronic acids).
Neutral and amino sugars were separated with an
iso-cratic 19 mM NaOH elution at 17◦C (eluent A: 20 mM
NaOH; eluent B: Milli-Q water) following Panagiotopoulos et al. (2001). Acidic sugars (i.e. uronic acids) were detected in a separate analysis using a gradient of two mobile phases
(eluent C: 1 M NaOH; eluent D; 0.5 M CH3COONa). The
gradient program used for this chromatographic separation was as follows:
1. 0–12 min 62.5 % eluent B, 7.5 % eluent C, 30 % eluent D,
2. 12–13 min 80 % eluent B, 20 % eluent C (ramp 5),
3. 13–20 min 80 % eluent B, 20 % eluent C (end of the analysis).
The flow rate was set at 0.7 ml min−1for both neutral and acidic sugars analyses.
Precision, detection limit, blanks, and recoveries
The precisions, as shown by the coefficient of variation (CV), were 5–10 % and 0.9–2.0 % (n = 6) for the peak area and retention time, respectively, for repeated injections of a standard solution of 50 nM per sugar. Repeated injections (n = 6) of a typical particulate sample resulted in a CV of 4–6 % and 0.03–0.21 % for the peak area and retention time, respectively, for all sugars. The detection limit of the method (S/N = 3) was approximately 10 nM for neutral and amino sugars, whereas for acidic sugars it was 20 nM.
The procedural blank consisted of Milli-Q hydrolyzed in the same manner as the samples (see above). Sugars were not detected in the blank. Adonitol was recovered at a per-centage of 80–95 %; however, we have chosen not to correct our original data.
3.3 Statistics
Principal components analysis (PCA) was used to reduce the multidimensional nature of the data set and to evaluate the interrelationships among the carbohydrates (variables). PCA has been successfully used in previous studies to assess the origin or the degradation status of organic matter (Pana-giotopoulos and Semp´er´e, 2005b; He et al., 2010) and was performed using the individual carbohydrate concentrations (i.e. glucose, and mannose) as well as the POC and DOC data (Table 1). The PCA statistics were performed using the statistical package XLSTAT 2010.2 (Microsoft Excel add-in program).
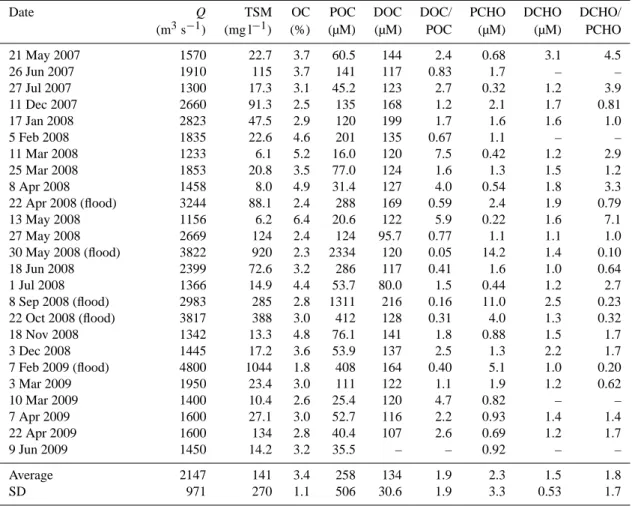
Table 1. Water discharge (Q), total suspended matter (TSM), weight percentage of organic carbon, particulate and dissolved organic carbon
(POC, DOC), DOC/POC ratios, particulate and dissolved carbohydrates (PCHO, DCHO), and DCHO/ PCHO ratios measured in the Rhˆone River during the period May 2007 to June 2009.
Date Q TSM OC POC DOC DOC/ PCHO DCHO DCHO/ (m3s−1) (mg l−1) (%) (µM) (µM) POC (µM) (µM) PCHO 21 May 2007 1570 22.7 3.7 60.5 144 2.4 0.68 3.1 4.5 26 Jun 2007 1910 115 3.7 141 117 0.83 1.7 – – 27 Jul 2007 1300 17.3 3.1 45.2 123 2.7 0.32 1.2 3.9 11 Dec 2007 2660 91.3 2.5 135 168 1.2 2.1 1.7 0.81 17 Jan 2008 2823 47.5 2.9 120 199 1.7 1.6 1.6 1.0 5 Feb 2008 1835 22.6 4.6 201 135 0.67 1.1 – – 11 Mar 2008 1233 6.1 5.2 16.0 120 7.5 0.42 1.2 2.9 25 Mar 2008 1853 20.8 3.5 77.0 124 1.6 1.3 1.5 1.2 8 Apr 2008 1458 8.0 4.9 31.4 127 4.0 0.54 1.8 3.3 22 Apr 2008 (flood) 3244 88.1 2.4 288 169 0.59 2.4 1.9 0.79 13 May 2008 1156 6.2 6.4 20.6 122 5.9 0.22 1.6 7.1 27 May 2008 2669 124 2.4 124 95.7 0.77 1.1 1.1 1.0 30 May 2008 (flood) 3822 920 2.3 2334 120 0.05 14.2 1.4 0.10 18 Jun 2008 2399 72.6 3.2 286 117 0.41 1.6 1.0 0.64 1 Jul 2008 1366 14.9 4.4 53.7 80.0 1.5 0.44 1.2 2.7 8 Sep 2008 (flood) 2983 285 2.8 1311 216 0.16 11.0 2.5 0.23 22 Oct 2008 (flood) 3817 388 3.0 412 128 0.31 4.0 1.3 0.32 18 Nov 2008 1342 13.3 4.8 76.1 141 1.8 0.88 1.5 1.7 3 Dec 2008 1445 17.2 3.6 53.9 137 2.5 1.3 2.2 1.7 7 Feb 2009 (flood) 4800 1044 1.8 408 164 0.40 5.1 1.0 0.20 3 Mar 2009 1950 23.4 3.0 111 122 1.1 1.9 1.2 0.62 10 Mar 2009 1400 10.4 2.6 25.4 120 4.7 0.82 – – 7 Apr 2009 1600 27.1 3.0 52.7 116 2.2 0.93 1.4 1.4 22 Apr 2009 1600 134 2.8 40.4 107 2.6 0.69 1.2 1.7 9 Jun 2009 1450 14.2 3.2 35.5 – – 0.92 – – Average 2147 141 3.4 258 134 1.9 2.3 1.5 1.8 SD 971 270 1.1 506 30.6 1.9 3.3 0.53 1.7 4 Results 4.1 Bulk parameters
4.1.1 Water discharge (Q), total suspended matter
(TSM), organic carbon content of particles (OC %), POC, and DOC concentrations
The Rhˆone River exhibits two periods of peak discharge: a spring peak related to snowmelt in the Alpine and Massif Central watersheds and a fall peak related to storm events originating from humid air masses over the Mediterranean Sea. During the sampling period (May 2007–June 2009), dis-charge fluctuated from 1233 to 4800 m3s−1, whereas TSM
concentrations varied between 6 and 1044 mg l−1, with peak values occurring during the flood of February 2009 (Table 1). Less intense flood episodes occurred in April, May, Septem-ber and OctoSeptem-ber 2008. The flood event observed in late May 2008 was due to artificial releases of water from the Serre-Ponc¸on dam (located approximately 250 km north-east of the sampling station), while the 8 September 2008 event
was related to an exceptional watershed overflow occurred 200 km in the north. Therefore, these measurements were excluded for annual fluxes estimations (see below). Dur-ing the flood events of 2008, discharge varied from 2983 to 3822 m3s−1, corresponding to TSM concentrations of 88– 1044 mg l−1(Table 1).
The organic carbon content (OC % wt) of the particles ranged from 1.8 to 6.4 % (Table 1) and was similar to that re-ported in previous studies in the Rhˆone (Cauwet et al., 1990; Semp´er´e et al., 2000) and other riverine systems (Ittekkot, 1988; Hedges et al., 1994). The POC concentrations ranged from 16 to 2334 µM C, with the highest values recorded dur-ing the flood events (Table 1; Fig. 1a). In agreement with previous investigations, the OC % correlated well with TSM, according to the formula OC % = −0.012 log TSM + 0.054 (r = 0.71, n = 24, p < 0.0001), and likely results from the combination of autochthonous organic particles with land-derived material and resuspended particles (Meybeck et al., 1982; Thurman, 1985; Ittekkot, 1988; Semp´er´e et al., 2000). Finally, DOC concentrations averaged 134 ± 30.6 µM C, which was lower but in the same order of magnitude as
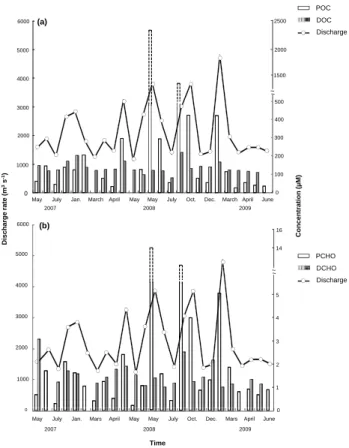
5000 6000 POC DOC Discharge (a) 2000 2500 500 3000 4000 ~~ 400 1500 0 0 1000 2000 300 200 100 (m 3s -1) o n (µM)
May July Jan. March April May May July Oct. Dec. March April June 2007 2008 2009 5000 14 16 6000 (b) Discha rge rate Concentra ti o PCHO DCHO 3000 4000 4 5 ~ ~ DCHO Discharge 2000 1 2 3 1000 Figure 1 0 0
May July Jan. Mars April May May July Oct. Dec. Mars April June 2007 2008 2009
Time
Fig. 1. Daily discharge of the Rhˆone River (in m3s−1)between May 2007 and June 2009 as a function of (a) POC and DOC con-centrations (in µM C) and (b) PCHO and DCHO concon-centrations (in µM).
seen in previous studies in the Rhˆone (Cauwet et al., 1990; Semp´er´e et al., 2000). The DOC/POC ratios reached mini-mum values (0.1–0.6) during flood episodes, which indicates a higher POC transport compared with DOC during these events (Table 1).
4.1.2 Particulate and dissolved carbohydrate
concen-trations (PCHO & DCHO) and their contribution to the organic carbon pool
PCHO concentrations ranged from 0.22 to 11 µM and, sim-ilar to POC, were higher during the flood episodes (2.4– 11 µM; Table 1). The particulate sugars represented 3 to 18 % of POC (PCHO-C/POC %); however, the maximum ob-served values did not coincide with the flood episodes (Ta-ble 2). Our results are within the expected range of values measured in other riverine systems in Europe (Danube and Tech rivers; da Cunha et al., 2002; Reschke et al., 2002), America (Amazon, Parana, and S˜ao Francisco rivers; De-petris and Kempe, 1993; Hedges et al., 1994; Jennerjahn and Ittekkot, 1999), Africa (Niger and Orange rivers; Thur-man, 1985), and Asia (Ganges and Indus rivers; Ittekkot et al., 1982; Thurman, 1985).
The DCHO concentrations averaged 1.5 ± 0.53 µM and accounted for 4 to 13 % of DOC (Tables 1 and 3). Our results are similar to previous values reported from the Parana (4– 25 %, Depetris and Kempe, 1993), Williamson (2 %, Sweet and Perdue, 1982), Niger (0.3–21 %, Thurman, 1985) and Mackenzie (2.7–21 %, Thurman, 1985) rivers, and in ultra-filtrated organic matter collected from Arctic rivers (2–4 %, Amon and Benner, 2003) or the Amazon (3–5 % Hedges et al., 1994). Similar to the DOC/POC ratios, DCHO/PCHO reached minimum values (0.1–0.8) during flood episodes, which indicated higher particulate carbohydrate transport than dissolved carbohydrates during these events (Table 1).
4.1.3 Relations between water discharge and POC,
DOC, PCHO and DCHO
Daily POC, DOC, PCHO and DCHO loadings were calcu-lated by multiplying their concentrations by the daily water discharge (Q) during the sampling period. The discharge rate correlated significantly with POC and PCHO fluxes as shown by the correlation coefficients:
(POC) = 0.1154(Q) − 112.99(n = 23, r = 0.90) (PCHO) = 0.0012(Q) − 1.0077(n = 23, r = 0.94)
In our study, Q did not correlate with DOC and DCHO. As the relationship was found not to be significant, DOC and DCHO transport (see below) was estimated by multiplying the average concentration (Tables 1 and 3) by the correspond-ing river discharge. The DOC and DCHO error is given by the standard deviation found for the average DOC and DCHO concentrations. The same approach has already been used by Semp´er´e et al. (2000) to estimate annual dissolved inorganic carbon (DIC) fluxes.
4.1.4 Annual fluxes of TSM, POC, DOC, PCHO and
DCHO
TSM measurements were available for each day between 2007 and 2009 and therefore annual TSM fluxes were calcu-lated by multiplying TSM with the corresponding flow rate. Annual fluxes of carbohydrates along with POC and DOC were estimated using the above equations for each day from 2007–2009 (Table 4).
From May 2007 to June 2009, the average total dis-charge was estimated to be 47 ± 9.6 km3yr−1, whereas 4.31 ± 3.55 × 10⁶t yr−1 of suspended solids reached
the Mediterranean Sea. These values are similar to
those reported by Semp´er´e et al. (2000) (period 1987– 1996; 54 ± 12 km3yr−1; 9.90 ± 6.53 × 10⁶t yr−1) or Pont et al. (2002) (period 1967–1996; 53.6 km3yr−1; 7.4 × 10⁶t yr−1), which were estimated after
extrap-olation from similar relationships. The calculated
average POC and DOC fluxes were 1.03 ± 0.42 and 0.63 ± 0.13 × 10¹⁰moles C yr−1, respectively
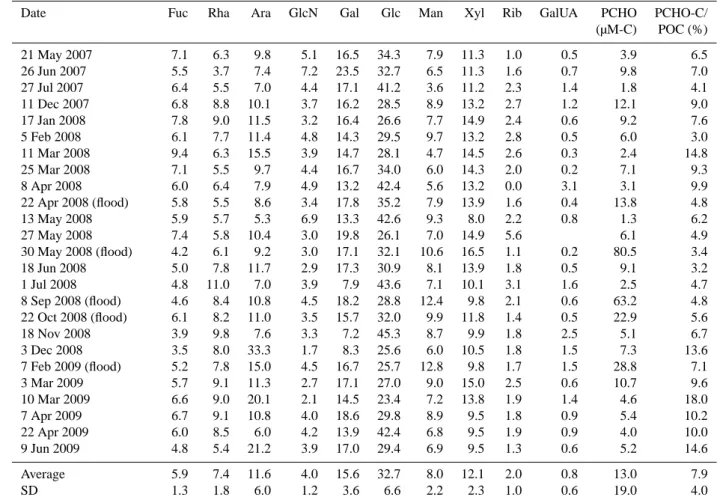
Table 2. Relative abundance of particulate carbohydrates (PCHO in mol %) and their contribution to the POC pool during the sampling
period.
Date Fuc Rha Ara GlcN Gal Glc Man Xyl Rib GalUA PCHO PCHO-C/ (µM-C) POC (%) 21 May 2007 7.1 6.3 9.8 5.1 16.5 34.3 7.9 11.3 1.0 0.5 3.9 6.5 26 Jun 2007 5.5 3.7 7.4 7.2 23.5 32.7 6.5 11.3 1.6 0.7 9.8 7.0 27 Jul 2007 6.4 5.5 7.0 4.4 17.1 41.2 3.6 11.2 2.3 1.4 1.8 4.1 11 Dec 2007 6.8 8.8 10.1 3.7 16.2 28.5 8.9 13.2 2.7 1.2 12.1 9.0 17 Jan 2008 7.8 9.0 11.5 3.2 16.4 26.6 7.7 14.9 2.4 0.6 9.2 7.6 5 Feb 2008 6.1 7.7 11.4 4.8 14.3 29.5 9.7 13.2 2.8 0.5 6.0 3.0 11 Mar 2008 9.4 6.3 15.5 3.9 14.7 28.1 4.7 14.5 2.6 0.3 2.4 14.8 25 Mar 2008 7.1 5.5 9.7 4.4 16.7 34.0 6.0 14.3 2.0 0.2 7.1 9.3 8 Apr 2008 6.0 6.4 7.9 4.9 13.2 42.4 5.6 13.2 0.0 3.1 3.1 9.9 22 Apr 2008 (flood) 5.8 5.5 8.6 3.4 17.8 35.2 7.9 13.9 1.6 0.4 13.8 4.8 13 May 2008 5.9 5.7 5.3 6.9 13.3 42.6 9.3 8.0 2.2 0.8 1.3 6.2 27 May 2008 7.4 5.8 10.4 3.0 19.8 26.1 7.0 14.9 5.6 6.1 4.9 30 May 2008 (flood) 4.2 6.1 9.2 3.0 17.1 32.1 10.6 16.5 1.1 0.2 80.5 3.4 18 Jun 2008 5.0 7.8 11.7 2.9 17.3 30.9 8.1 13.9 1.8 0.5 9.1 3.2 1 Jul 2008 4.8 11.0 7.0 3.9 7.9 43.6 7.1 10.1 3.1 1.6 2.5 4.7 8 Sep 2008 (flood) 4.6 8.4 10.8 4.5 18.2 28.8 12.4 9.8 2.1 0.6 63.2 4.8 22 Oct 2008 (flood) 6.1 8.2 11.0 3.5 15.7 32.0 9.9 11.8 1.4 0.5 22.9 5.6 18 Nov 2008 3.9 9.8 7.6 3.3 7.2 45.3 8.7 9.9 1.8 2.5 5.1 6.7 3 Dec 2008 3.5 8.0 33.3 1.7 8.3 25.6 6.0 10.5 1.8 1.5 7.3 13.6 7 Feb 2009 (flood) 5.2 7.8 15.0 4.5 16.7 25.7 12.8 9.8 1.7 1.5 28.8 7.1 3 Mar 2009 5.7 9.1 11.3 2.7 17.1 27.0 9.0 15.0 2.5 0.6 10.7 9.6 10 Mar 2009 6.6 9.0 20.1 2.1 14.5 23.4 7.2 13.8 1.9 1.4 4.6 18.0 7 Apr 2009 6.7 9.1 10.8 4.0 18.6 29.8 8.9 9.5 1.8 0.9 5.4 10.2 22 Apr 2009 6.0 8.5 6.0 4.2 13.9 42.4 6.8 9.5 1.9 0.9 4.0 10.0 9 Jun 2009 4.8 5.4 21.2 3.9 17.0 29.4 6.9 9.5 1.3 0.6 5.2 14.6 Average 5.9 7.4 11.6 4.0 15.6 32.7 8.0 12.1 2.0 0.8 13.0 7.9 SD 1.3 1.8 6.0 1.2 3.6 6.6 2.2 2.3 1.0 0.6 19.0 4.0
A blank indicates that this compound was below detection.
Abbreviations: Fuc., Fucose; Rha., Rhamnose; Ara., Arabinose; GlcN., Glucosamine; Gal., Galactose; Glc., Glucose; Man., Mannose; Xyl., Xylose; Rib., Ribose; GalUA., Galacturonic acid.
those estimated by Semp´er´e et al. (2000) (period 1987– 1996; POC = 1.62 ± 0.92 × 10¹⁰moles C yr−1; DOC = 1.08 ± 0.30 × 10¹⁰moles C yr−1), but similar to those reported by Cauwet et al. (1990) (period 1986; DOC = 0.8–1.1 × 10¹⁰moles C yr−1).
Finally, the PCHO-C fluxes
(0.064 ± 0.026 × 10¹⁰moles C yr−1) were higher
than those of their dissolved counterparts, DCHO-C
(0.042 ± 0.008 × 10¹⁰moles C yr−1), indicating that carbo-hydrates are mainly exported to the Mediterranean Sea in the particulate form.
4.2 Molecular composition of carbohydrates
4.2.1 Distribution of carbohydrates in POM and DOM
Aldohexoses were the most abundant compound class (0.3– 6 µM) of carbohydrates in POM and accounted for approx-imately half of the PCHO (54 ± 6 %). Aldopentoses were second in abundance (29 ± 7 %), followed by
deoxysug-ars (13 ± 2 %), amino sugdeoxysug-ars (4 ± 1 %) and uronic acids (1 ± 1 %). Glucose was by far the most abundant sugar, averaging 33 ± 7 % of the PCHO, followed by galactose (16 ± 4 %), xylose (12 ± 2 %), and arabinose (12±6 %) (Ta-ble 2). Mannose was next in abundance (8 ± 2 %) followed by fucose and rhamnose with equivalent contributions (6– 7 %) to the PCHO pool. Finally, glucosamine, ribose, and galacturonic acid were the least abundant carbohydrates ac-counting for <5 % of the PCHO (Table 2). Ribose is a frag-ile monosaccharide and generally is destroyed during acid hydrolysis. Therefore, the results presented here should be looked as minimum ribose concentrations.
Similar to POM, aldohexoses were the most abun-dant compound class in DOM, accounting for approxi-mately half of the DCHO (53 ± 7 %). Aldopentoses con-tributed 21 ± 5 % to the DCHO pool, followed by deoxy-sugars (14 ± 4 %), uronic acids (6 ± 3 %), and amino sug-ars (6 ± 2 %). Glucose was again the most abundant sugar, averaging 33 ± 7 % of the DCHO, followed by mannose (11 ± 3 %), galactose (11 ± 4 %), and arabinose (9 ± 4 %)
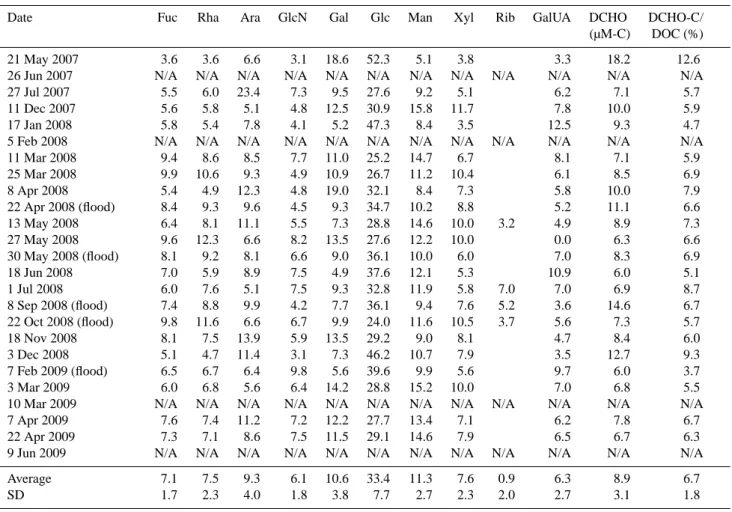
Table 3. Relative abundance of dissolved carbohydrates (DCHO in mol %) and their contribution to the DOC pool during the sampling
period.
Date Fuc Rha Ara GlcN Gal Glc Man Xyl Rib GalUA DCHO DCHO-C/ (µM-C) DOC (%) 21 May 2007 3.6 3.6 6.6 3.1 18.6 52.3 5.1 3.8 3.3 18.2 12.6 26 Jun 2007 N/A N/A N/A N/A N/A N/A N/A N/A N/A N/A N/A N/A 27 Jul 2007 5.5 6.0 23.4 7.3 9.5 27.6 9.2 5.1 6.2 7.1 5.7 11 Dec 2007 5.6 5.8 5.1 4.8 12.5 30.9 15.8 11.7 7.8 10.0 5.9 17 Jan 2008 5.8 5.4 7.8 4.1 5.2 47.3 8.4 3.5 12.5 9.3 4.7 5 Feb 2008 N/A N/A N/A N/A N/A N/A N/A N/A N/A N/A N/A N/A 11 Mar 2008 9.4 8.6 8.5 7.7 11.0 25.2 14.7 6.7 8.1 7.1 5.9 25 Mar 2008 9.9 10.6 9.3 4.9 10.9 26.7 11.2 10.4 6.1 8.5 6.9 8 Apr 2008 5.4 4.9 12.3 4.8 19.0 32.1 8.4 7.3 5.8 10.0 7.9 22 Apr 2008 (flood) 8.4 9.3 9.6 4.5 9.3 34.7 10.2 8.8 5.2 11.1 6.6 13 May 2008 6.4 8.1 11.1 5.5 7.3 28.8 14.6 10.0 3.2 4.9 8.9 7.3 27 May 2008 9.6 12.3 6.6 8.2 13.5 27.6 12.2 10.0 0.0 6.3 6.6 30 May 2008 (flood) 8.1 9.2 8.1 6.6 9.0 36.1 10.0 6.0 7.0 8.3 6.9 18 Jun 2008 7.0 5.9 8.9 7.5 4.9 37.6 12.1 5.3 10.9 6.0 5.1 1 Jul 2008 6.0 7.6 5.1 7.5 9.3 32.8 11.9 5.8 7.0 7.0 6.9 8.7 8 Sep 2008 (flood) 7.4 8.8 9.9 4.2 7.7 36.1 9.4 7.6 5.2 3.6 14.6 6.7 22 Oct 2008 (flood) 9.8 11.6 6.6 6.7 9.9 24.0 11.6 10.5 3.7 5.6 7.3 5.7 18 Nov 2008 8.1 7.5 13.9 5.9 13.5 29.2 9.0 8.1 4.7 8.4 6.0 3 Dec 2008 5.1 4.7 11.4 3.1 7.3 46.2 10.7 7.9 3.5 12.7 9.3 7 Feb 2009 (flood) 6.5 6.7 6.4 9.8 5.6 39.6 9.9 5.6 9.7 6.0 3.7 3 Mar 2009 6.0 6.8 5.6 6.4 14.2 28.8 15.2 10.0 7.0 6.8 5.5 10 Mar 2009 N/A N/A N/A N/A N/A N/A N/A N/A N/A N/A N/A N/A 7 Apr 2009 7.6 7.4 11.2 7.2 12.2 27.7 13.4 7.1 6.2 7.8 6.7 22 Apr 2009 7.3 7.1 8.6 7.5 11.5 29.1 14.6 7.9 6.5 6.7 6.3 9 Jun 2009 N/A N/A N/A N/A N/A N/A N/A N/A N/A N/A N/A N/A Average 7.1 7.5 9.3 6.1 10.6 33.4 11.3 7.6 0.9 6.3 8.9 6.7 SD 1.7 2.3 4.0 1.8 3.8 7.7 2.7 2.3 2.0 2.7 3.1 1.8
N/A: No available data.
A blank indicates that this compound was below detection.
(Table 3). Xylose, rhamnose and fucose accounted for ∼7– 7.5 % of the DCHO. Ribose was generally below the de-tection limit, whereas galacturonic acid was higher in abun-dance (6 ± 3 %) in the DCHO pool than the PCHO (Tables 2 and 3).
5 Discussion
5.1 Fluxes and lability of organic matter in the
Rhˆone River
Previous investigations assessed POM lability after the clas-sification of TSM into nine groups of a specific range (0–15, 15–50, 50–150 mg l−1, etc.) (Ittekkot, 1988). This classifica-tion was based on the carbohydrate and amino acid measure-ments in POM, which are generally considered to be labile compounds (susceptible to bacterial degradation), and be-cause of their quantitative significance in POM (Moran and Hodson, 1989; Wakeham et al., 1997; Panagiotopoulos and Semp´er´e, 2005b and references therein; He et al., 2010). We
used the same classifications and estimated the labile POC (LPOC) fluxes into the Gulf of Lions over the period 2007– 2009 from the calculated TSM concentrations.
Our results showed that LPOC was mainly
dis-tributed between TSM concentrations of 0–15 mg l−1
(52 % of the data) and 15–50 mg l−1 (29 % of the
data). Over the 3-yr estimation, the LPOC fluxes
ranged from 0.23 to 0.36 × 10¹⁰moles C yr−1 (average 0.28 × 10¹⁰moles C yr−1)and were approximately four fold lower than those of the POC fluxes, but four fold higher than those of the PCHO-C fluxes (Table 4). The LPOC fluxes ac-counted for 23–32 % (av. 27 %) of the bulk POC. The latter average value is approximately four fold higher than the aver-age value of the PCHO-C fluxes/POC fluxes (∼6 %; Table 4) over the sampling period. This difference may be attributed to the presence of other labile compounds (e.g. amino acids, nucleic acids) in POM, which are included in the LPOC esti-mates.
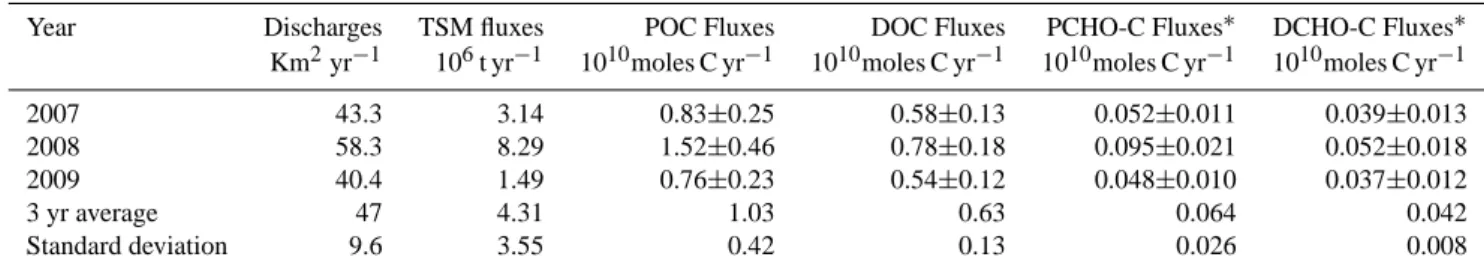
Table 4. Annual Rhˆone River Discharges, and fluxes of Total Suspended Matter (TSM), Particulate Organic Carbon (POC), Dissolved
Organic Carbon, Particulate (PCHO-C), and Dissolved (DCHO-C) carbohydrates estimated for the sampling period (2007–2009). Year Discharges TSM fluxes POC Fluxes DOC Fluxes PCHO-C Fluxes∗ DCHO-C Fluxes∗
Km2yr−1 106t yr−1 1010moles C yr−1 1010moles C yr−1 1010moles C yr−1 1010moles C yr−1 2007 43.3 3.14 0.83±0.25 0.58±0.13 0.052±0.011 0.039±0.013 2008 58.3 8.29 1.52±0.46 0.78±0.18 0.095±0.021 0.052±0.018 2009 40.4 1.49 0.76±0.23 0.54±0.12 0.048±0.010 0.037±0.012
3 yr average 47 4.31 1.03 0.63 0.064 0.042
Standard deviation 9.6 3.55 0.42 0.13 0.026 0.008
POC, and PCHO-C fluxes were calculated from the linear relationships between the daily discharge and the corresponding loads based on 23 points between May 2007 and June 2009.
DOC and DCHO-C fluxes were calculated by multiplying mean DOC and DCHO-C concentration by the water discharge (see Tables 2 & 3) between May 2007 and June 2009. ∗Carbon content of carbohydrates considering that 1 mol of carbohydrate contains 6 moles of carbon.
During the sampling period, we found two significant re-lationships between PCHO-C and POC, and PCHO-C and LPOC (Fig. 2a, b). This result is in agreement with previous studies highlighting the role of carbohydrates as active labile components of the riverine POM pool (Ittekkot and Arain, 1986; Ittekkot, 1988; Depetris and Kempe, 1993; Hedges et al., 1994; Bergamaschi et al., 1999). Although our data cover only a two year period, this is the first time these relationships have been established in a riverine system; thus, it might be useful to evaluate the carbohydrate content of POC or the amount of LPOC in riverine particles and vice versa. Further measurements of amino acids or other labile compounds in POM in rivers may also help to improve or establish similar relationships.
The refractory particulate organic carbon (RPOC) fluxes were calculated after the subtraction of the LPOC fluxes from the bulk POC fluxes. Our results showed that the RPOC fluxes ranged from 0.57 to 1.16 × 10¹⁰moles C yr−1, repre-senting 68 to 77 % of the bulk POC. The RPOC contribution to the bulk POC falls into the range of 55–95 % reported for several world rivers (Ittekkot, 1988) and matches well with the RPOC found in the Orinoco (∼80 %), Zaire (∼80 %), In-dus (∼80 %), and Brahmaputra (∼80 %) rivers. RPOC sur-vives microbial degradation and is mostly lost in estuaries, although a small fraction is incorporated into coastal marine sediments (Prahl et al., 1994; Hedges et al., 1997; Keil et al., 1997).
Similar to POM, riverine DOM is composed of old and young material (i.e. labile DOC; LDOC); nevertheless, the young component of DOM predominates, as shown by radiocarbon measurements (Raymond and Bauer, 2001). Biodegradable riverine DOM originates mainly from au-tochthonous in situ production, whereas refractory DOM re-sults from POM solubilization and/or the weathering of sed-imentary rocks and soils (Smith and Hollibaugh, 1993; Kao and Liu, 1996; Keil et al., 1997; Schillawski and Petsch, 2008).
In contrast to LPOC, which can be estimated by the TSM particle range (see above), literature data for LDOC in rivers
20 30 40 (a) y = 0.053x+1.91; R2=0.80 0 10 0 100 200 300 400 500 C POC µM C PCHO-C µM C y = 0.28x-0.33; R2=0.64 30 40 (b) 0 10 20 0 20 40 60 80 Figure 2 LPOC µM C
Fig. 2. Relationships between PCHO-C and (a) POC; (b) LPOC
during the sampling period (May 2007–June 2009). Labile POC was calculated as follows: 0–15 mg l−1TSM corresponds to 35.2 % LPOC; 15–50 mg l−1TSM, 46.60 % LPOC; 50–150 mg l−1TSM, LPOC 22.10 %; 150–500 mg l−1TSM, 11.8 % LPOC; 500–1500 mg l−1TSM, 18.8 % LPOC (Ittekkot, 1988).
do not exist. Nevertheless, if we assume that carbohydrates constitute the major fraction of the LDOC (DCHO-C/DOC = 7 %; Table 3), the average flux of LDOC would aver-age 0.044 × 10¹⁰moles C yr−1, which is in agreement with the annual flux of DCHO (0.042 × 10¹⁰moles C yr−1; Ta-ble 4). The remaining refractory-DOC (RDOC) can be calcu-lated as the difference between DOC and LDOC and equals 0.59 × 10¹⁰moles C yr−1.
Our LDOC fluxes are approximately four times lower than that of 0.16 × 10¹⁰moles C yr−1 reported by Semp´er´e
et al. (2000); however, it is important to note that the latter authors estimated LDOC fluxes using literature data by ap-plying a mean of LDOC/DOC = 15 % (Spitzy and Ittekkot, 1991; Volk et al., 1997). Our LDOC fluxes are likely un-derestimated because no amino acids were measured in this study. Unfortunately, no amino acid data are available for the Rhˆone River; nevertheless, previous investigations have suggested that amino acids generally account for 1–3 % of DOC in rivers (Lara et al., 1998; Amon and Meon, 2004; Duan and Bianchi, 2007). Applying a LDOC/DOC ratio of 10 % (DCHO-C/DOC + DAA-C/DOC), the LDOC flux in the Rhˆone River would average 0.063 × 10¹⁰moles C yr−1, which is good agreement with the average value reported by Semp´er´e et al. (2000).
5.2 Seasonal and interannual variability of bulk
carbohydrates
The high PCHO-C/POC values (>9 %) observed in the spring of 2008 (11, 25 March; April 2008) and 2009 (3, 10 March; 7 April) along with the low TSM concentrations (6–27 mg l−1) suggest a predominantly autochthonous in-put of POM such as in situ primary production (Fig. 3). This is in agreement with previous investigations in which LPOC is generally associated with low TSM concentrations (Meybeck, 1982; Ittekkot and Arain, 1986; Ittekkot, 1988; Semp´er´e et al., 2000). Although chlorophyll data were not available during the sampling period, previous chlorophyll measurements over a period of 20 yr (1980–1999) showed that fresh organic matter is regularly produced in spring and summer. In agreement with these observations, Harmelin et al. (2010) reported that the low C/N ratios (C/N < 8) asso-ciated with the high organic carbon content (% C ∼4 %) in POM are mainly observed in the spring and summer, coincid-ing with higher growth of diatoms and chlorophytes. In con-trast, in the fall and winter, the C/N ratios were higher (>8) and were associated with low %C (∼2 %), suggesting the predominance of allochthonous terrestrial material in POM (Harmelin et al., 2010).
The lowest OC % content and PCHO-C/POC ratios were observed during flood episodes and were associated with higher TSM concentrations (Tables 1, 2; Fig. 3), which further indicates that POM is mainly derived from al-lochthonous material originating from soils or litter in the drainage area. The carbohydrates in this allochthonous POM are probably associated with humic substances (Koivula and H¨anninen, 2001; Fischer et al., 2007) or derived from highly degraded cellulosic material (Moran and Hodson, 1989). Al-though high phytoplanktonic production occurs in the spring, the flood events observed in this period generally diminish the production of autochthonous material because of the re-duced light penetration to the river (Thurman, 1985).
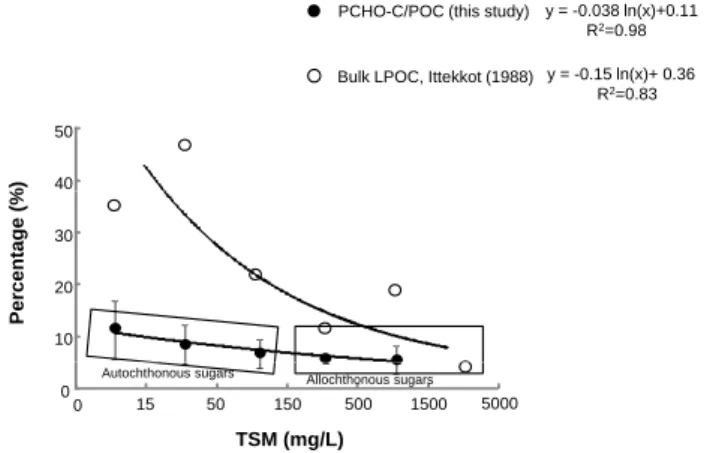
PCHO-C/POC (this study) y = -0.038 ln(x)+0.11
Bulk LPOC, Ittekkot (1988)
% ) R2=0.98 40 50 y = -0.15 ln(x)+ 0.36 R2=0.83 Percentage ( % 10 20 30 TSM (mg/L) 0 0 15 15050 500 1500 5000 Autochthonous sugars Allochthonous sugars Figure 3
Fig. 3. The percentage of labile POC as a function of the TSM
concentrations. In our study, the Rhˆone River TSM concentrations ranged between 6 and 1044 mg l−1; therefore, TSM > 1500 mg l−1 are not available. The error bars represent the standard deviation of the TSM concentrations for the range of 0–15, 15–50, 50–150, 150–500, and 500–1500 mg l−1, as established by Meybeck (1982).
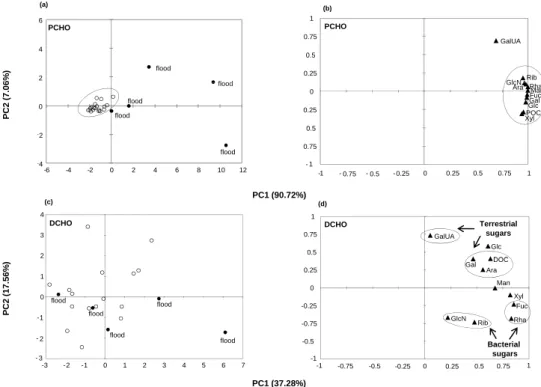
The PCA was further used to assess the differences in the carbohydrate content of the particulate samples. Two prin-cipal components were identified that accounted for almost 98 % of the total variance in POM (Fig. 4a). Our results showed that, during flood events, carbohydrates exhibited a distinct molecular composition, which is typical of each flood event and clearly differs from that of low-water periods. Figure 4a also indicates that, in low-water periods, carbohy-drates exhibit compositional similarities to POM (the points cluster in the middle of the figure), which probably suggests a common source.
Earlier investigations in the Rhˆone River suggested that phytoplankton contributes only 10 % to the annual POC, whereas soil organic matter, an allochthonous material, is the major source of POC (Harmelin et al., 2010). Therefore, it appears that POM at the sampling site has an allochthonous signature, which makes imperceptible the organic matter pro-duced within the river (autochthonous source). In agreement with these findings, other studies based on the δ13C measure-ments of fatty acids indicated that POM consists of a mixture of different sources with a strong contribution from terrestrial plants (allochthonous source) and a smaller input from fresh-water microalgae, mostly diatoms (Bourgeois et al., 2011).
In contrast to PCHO, the DCHO concentrations did not exhibit large variations between flood and low-water events, which further indicates that flood episodes mainly affect the PCHO pool rather than DCHO pool (Fig. 1b; Table 3). In ac-cordance with that, our PCA results showed that the DCHO concentrations during flood events were generally similar to the DCHO concentrations measured during low-water events (Fig. 4c). The PCA also showed that the DCHO concentra-tions could explain only 55 % (PC1 + PC2) of the variability
6 (a) 1 (b) PCHO PCHO 6 %) flood 2 4 flood GlcN Rib GalUA 0.25 0.5 0.75 PCHO PCHO PC2 (7.0 6 ‐2 0 flood flood flood Fuc Rha Ara GlcN Gal Glc Man Xyl ‐ 0.5 ‐ 0.25 0 POC PC1 (90.72%) flood ‐4 -6 -4 -2 0 2 4 6 8 10 12 - 1 ‐ 0.75 -1 - 0.75 - 0.5 -0.25 0 0.25 0.5 0.75 1 ( ) ( ) 2 3 4 0.5 0.75 1 GalUA Glc DOC (c) (d)
DCHO DCHO Terrestrial
sugars 1 0 1 2 PC2 (17.56 % ) flood flood flood -0.25 0 0.25 Gal Ara DOC Fuc Xyl Man - 3 - 2 -1 -3 -2 -1 0 1 2 3 4 5 6 7 flood flood flood -1 -0.75 -0.5 -1 -0.75 -0.5 -0.25 0 0.25 0.5 0.75 1 GlcN Rib Rha Bacterial sugars PC1 (37.28%) Figure 4
Fig. 4. Principal components analysis for particulate and dissolved carbohydrates, including POC and DOC. (a) and (c) are the sample scores,
whereas (b) and (d) are the sample loadings of the PCA. The variance accounted for by each principal component is shown in parentheses after the axis label. The abbreviations of the sugars are given in Table 2.
8 y=0.99 x0.87 R2=0.85 3 4 5 6 7 D CHO/PCHO Flood Low-water discharge 0 1 2 0 1 2 3 4 5 6 7 8 D DOC/POC Figure 5
Fig. 5. Relationship between the ratios DCHO/PCHO and DOC/POC during the sampling period. We considered a flood event to occur when Q > 3000 m3s−1. This value roughly corresponded with two times the average annual flow recorded in the Rhˆone River (Q =∼ 1500 m3s−1).
in the DOM pool, which probably indicates different DCHO sources (Fig. 4c; see later discussion).
Over the two-year period of study, DCHO dominated over PCHO throughout low water events (DCHO/PCHO > 1), indicating a higher DCHO transport during the low dis-charge periods (Table 1). A significant relationship be-tween DOC/POC and DCHO/PCHO was established in this study (Fig. 5), further suggesting that the carbohydrate pool
(PCHO + DCHO) covaries with the bulk of organic matter (TOC = POC + DOC), although total carbohydrates make up on average a small percentage of TOC (15 %; Tables 2 and 3).
5.3 Carbohydrate compositional patterns
The patterns of occurrence of the individual carbohydrates over the period studied indicated that glucose was the domi-nant sugar in PCHO and DCHO (∼33 % in average; Tables 3, 4). Glucose was also found to be the dominant carbohydrate in the Parana (PCHO 30–45 %; DCHO 35–45 %; Depetris and Kempe, 1993), Caroni (DCHO 50 %; Ittekkot et al., 1982), Niger (DCHO 45 %; Ittekkot et al., 1982), Orinoco (DCHO 28 %; Ittekkot et al., 1982), Amazon (PCHO 35-50 %, DCHO 25 %; Hedges et al., 1994), and S˜ao Franscisco rivers (PCHO 35–60 %; Jennerjahn and Ittekkot, 1999). With a few exceptions, glucose generally accounted for >35 % of the DCHO during flood events compared to the low-water discharge periods (Table 3). This enrichment of glucose in the DCHO pool is probably due to the weathering of soils or the transport of carbohydrate polymers (e.g. cellulose) from vascular plants (Cowie and Hedges, 1984; Fischer et al., 2007).
Galactose was the second most abundant carbohydrate in PCHO, whereas mannose and galactose contributed approxi-mately equally (∼11 %) to the DCHO pool (Tables 3 and 4).
In a terrestrial environment, galactose may derive from vari-ous sources, such as non-woody plant tissues, phytoplank-tonic cell walls and bacteria in soils (Hecky et al., 1973; Cowie and Hedges, 1984; da Cuhna et al., 2002). The higher abundances of galactose in the PCHO pool (av. 16 %) than in the DCHO pool (av. 11 %) most likely suggest a phyto-planktonic influence in POM (see also the previous discus-sion). Other studies have found an enrichment of galactose in the particulate material in a coastal environment and/or sed-iments where primary productivity is generally high (Cowie and Hedges, 1984; Bergamaschi et al., 1999; He et al., 2010). Although mannose was not among the most abundant car-bohydrates in the PCHO pool, its contribution to the PCHO reached maximum values during flood events (except 22 April 2008; Table 2). Figure 6a shows a significant corre-lation between mannose in POM and discharge. This rela-tionship indicates an enrichment in mannose of the particu-late carbohydrate pool during high discharge periods, which probably reflects a local temporal influence by angiosperms (i.e. flowering plants). The reported percentages of man-nose for angiosperms (leaves or grasses) fall into the range of 8–20 % and are similar to our results (Cowie and Hedges, 1984).
Fucose and rhamnose contributed approximately equally to both the PCHO and DCHO pools (6–7 %; Tables 2 and 3). These two carbohydrates were strongly associated in both POM and DOM, as shown by the strong correlations coeffi-cients (POM: Fuc = 1.62 × Rha −0.14, r = 0.98, n = 25, p <0.0001 and DOM: Fuc = 1.19 × Rha −0.08, r = 0.94, n =21, p < 0.0001). Although fucose and rhamnose may have various sources, such as vascular plants, planktons and bacteria, their strong association and their high abun-dance in POM and DOM pools (av. 18–21 %, calculated on a glucose-free basis) clearly suggest a bacterial contri-bution (Cowie and Hedges, 1984; Bergamaschi et al., 1999) (Fig. 4d). Moreover, the high abundances of deoxysugars strongly point toward an advanced decomposition status of the organic material (see later discussion). Amino sugars and ribose are not the major structural components of vas-cular plants; they generally are components of the micro-bial biomass in plant detritus, particularly in more highly de-graded material (Hicks et al., 1994). Glucosamine and ribose formed a cluster close to fucose and rhamnose, which further reinforces the idea that these carbohydrates probably have a common bacterial origin and are typical of highly degraded organic material in POM and DOM (Fig. 4d).
In contrast to DOM, all carbohydrates in POM formed a compact cluster (except galacturonic acid, Fig. 4b). This re-sult may suggest a common origin or a mixture of different origins; nevertheless, as indicated above, the allochthonous signature appears to dominate.
y = 30543x-286.97 6000 (a) R2=0.46 c har g e rate (m 3s -1) Flood Low-water discharge 2000 3000 4000 5000 6000 (a) Flood Dis c 0 1000 0% 5% 10% 15% Mannose % y = -0.36x+0.59 R2=0.61 y = -0 27x+0 60 POM DOM y = -0.27x+0.60 R2=0.47 40 50 60 70 + G a lUA % DOM Gy mnosp e rm tissues signature>> phy to . (b) 0 10 20 30 0.0 0.1 0.2 0.3 0.4 0.5 0.6 0.7 0.8 0.9 1.0 1.1 1.2 Ara+Ga l+ Plant-derived carbohydrates
Soil and/or bacterial origin carbohydrates
Figure 6
Fuc+Rha/Ara+Xyl
Fig. 6. (a) Relationships between mannose and discharge in POM
and (b) relationships between the ratio Fuc + Rha/Ara + Xyl and Ara + Gal + GalUa (%) in POM and DOM over the sampling period. Flood events are indicated as bold circles and triangles.
5.4 Carbohydrate origins in the Rhˆone River
The origins of carbohydrates in both the POM and DOM pools were further assessed using the carbohydrate compo-sitional patterns, similarly to previous investigations (Cowie and Hedges, 1984; da Cunha et al., 2002; Guggenberger et al., 1994; He et al., 2010). Because glucose composition may vary with sources, the following calculations were performed on a glucose-free basis.
Figure 6b displays a plot between (Fuc + Rha)/(Ara + Xyl) and Ara + Gal + GalUA % for both POM and DOM. The (Fuc + Rha)/(Ara + Xyl) ratio has been used as an indicator of soil and/or bacterial-derived organic matter (when >0.5) and of plant derived carbohydrates (when <0.5) (Guggenberger et al., 1994). Our results showed that most of the DOM car-bohydrate data, including the flood episodes, exhibit values higher than 0.5, which further suggests a soil or bacterial ori-gin. In contrast, more than half of the POM carbohydrate data exhibited values <0.5, pointing to a vascular plant ori-gin.
Wood may be differentiated from non-woody vascular plant tissues (e.g. leaves, grasses), because the latter tain higher amounts of pectin (a carbohydrate polymer con-taining mainly galacturonic acid and smaller amounts of
arabinose and galactose). Cowie and Hedges (1984) used the formula (Ara + Gal) % as an indicator of non-woody vas-cular tissues and grasses (when 20–50 %) or woody origin (<15 %). Because our study measured galacturonic acid, we also included this compound in the above calculation (i.e. Ara + Gal + GalUA %). Our results showed that the sum of these carbohydrates ranged from 28–60 %, which further suggests that POM and DOM in the sampling site have a non-woody vascular plant signature (e.g. angiosperms leaves/grasses, gymnosperms tissues). This result corrobo-rates the PCA, where Ara, Gal, and DOC formed a compact cluster in the upper right quadrant (Fig. 4d). The above re-sults clearly indicate that DOM at the sampling site exhibits vascular plant, soil, and bacterial signatures, whereas POM has a more pronounced terrestrial influence from vascular plants, with a small a contribution of in situ phytoplanktonic production (see above).
The fact that galacturonic acid did not fall into the clus-ter of arabinose, galactose and DOC may indicate various sources for this compound. Galacturonic acid can derive from vascular plants, bacteria, or phytoplankton and is an important constituent of mucopolysaccharides and soil or-ganic matter (Kenne and Lindberg, 1983; Bergamaschi et al., 1999; Fischer et al., 2007). Our results showed that galac-turonic acid accounted for 3–12 % (Table 2) of our DOM samples. These values are higher than those reported for plankton (0.7–0.9 %) or sediment trap material (0.4–1.8 %; Bergamaschi et al., 1999), but similar to that found in wood, leaves, needles (4–18 %; Bergamaschi et al., 1999) and soils (17 %; Fischer et al., 2007). These results reinforce the pre-vious conclusions that the molecular abundance of galactur-onic acid in riverine DOM most likely reflects the weathering of soils and/or vascular plant signatures.
The different vascular plant sources (angiosperms
leaves/grasses vs. gymnosperms tissues) in POM and DOM were further assessed using Xyl % and Man/Xyl ratios. Our results showed that xylose accounted for 15–27 % and 8–16 % of the PCHO and DCHO, respectively. Xylose is produced in higher amounts by angiosperms than gym-nosperms, whereas gymnosperms produce more mannose
than xylose (Cowie and Hedges, 1984). Therefore, the
higher abundances of xylose in PCHO probably suggest an angiosperm source (i.e. angiosperm leaves or grasses), whereas the lower abundances in DCHO suggest a gym-nosperm source (i.e. non-woody gymgym-nosperm tissues) (Cowie and Hedges, 1984; Bergamaschi et al., 1999; Jia et al., 2008). In agreement with this, the Man/Xyl ratios were >1 in DOM than in POM which is typical of gymnosperm source. Therefore, it appears that DOM at the sampling site exhibits an allochthonous influence of gymnosperms, which probably has its origin from the northern part of the Rhˆone (the Alps, Lake Geneva), where conifers dominate.
Alternatively, the low abundances of xylose in DOM may originate from selective degradation of the glucose and xy-lose in POM. Indeed, Opsahl and Benner (1999) showed a
decrease in the xylose and glucose of different plant tissues, including leaves, wood, cypress needles and cord grass, over a four-year decomposition experiment. It is worth notic-ing that a similar relative abundance of xylose (11–16 %, recalculated on a glucose-free basis) was also reported in the surface sediments in the Gulf of Lions (the northwest-ern Mediterranean Sea) into which the Rhˆone River flows (Kerherv´e et al., 2002).
5.5 Carbohydrates as indicators of the diagenetic status
of riverine DOM and POM
The ubiquitous character of carbohydrates in terrestrial ecosystems allows not only the identification of their sources but also the evaluation of the biogeochemical processes (fates, metabolic pathways) occuring in the environment (Cowie and Hedges, 1984; Ittekkot and Arain, 1986; Hedges et al., 1994; Opsahl and Benner, 1999; Benner and Opsahl, 2001; He et al., 2010). For example, high hexoses/pentoses (Hex/Pen) ratios are indicative of labile organic matter orig-inating mainly from plants, whereas low ratios indicate de-graded material reflecting a soil origin (Ittekkot and Arain, 1986; da Cunha et al., 2002). Our results showed that the Hex/Pen ratios varied from 0.8 to 4.0 (av. 2.2) and from 1.4 to 6 (av. 2.9) for POM and DOM, respectively. Similar val-ues have been reported for the Parana River (POM: 2.5–3.4; DOM: 6.3; Depetris and Kempe, 1993). These findings may imply that POM is more degraded than DOM in the sam-pling site. However, if we conduct the same calculation on a glucose-free basis (Hex/Pen = Gal + Man/Ara + Xyl) the Hex/Pen ratio will range from 0.5 to 1.3 (av. 0.9) for POM and 0.6 to 1.9 (av. 1.1) for DOM. This result further indicates that POM and DOM exhibit similar diagenetic alteration.
The observed differences are probably due to the appar-ent dominance of glucose among the carbohydrates in highly degraded material (e.g. soils, vascular plants; Opsahl and Benner, 1999; Fischer et al., 2007) and in fresh material as well (e.g. plankton; Cowie and Hedges, 1984; Biersmith and Benner, 1998). The reported mole percentages of glucose in highly degraded vascular plant tissues ranged from 30–50 % (Opsahl and Benner, 1999) and are similar to those found in this study (∼33 %; Tables 2 and 3) or other riverine sys-tems (Ittekkot and Arain, 1986; Depetris and Kempe, 1993; Hedges et al., 1994). Although the processes that control the degradation of organic matter are not well known, growing evidence shows that the apparent degraded signature of river-ine DOM can actually attributed to processes of leaching and sorption with respect to amino acids (Aufdenkampe et al., 2001) and lignin phenols (Hernes et al., 2007). However, very little is known regarding the behavior of carbohydrates. Our results demonstrate that POM and DOM at the sam-pling site have already undergone extensive transformation, which is further supported by the relative abundances of de-oxysugars. (Fuc + Rha) % values calculated on a glucose-free basis ranged from 14 to 26 % (av. 18 %) and from 14
to 23 % (av. 21 %) for POM and DOM, respectively. Our values are similar to those reported for ultrafiltrated DOM and fine (<63 µm) POM in the Amazon river (Hedges et al., 1994) and agree as well with the deoxysugar values recorded at the end of decomposition experiments of vascular plants (Opsahl and Benner, 1999). Alternatively, the elevated de-oxy sugar levels may arise from contributions from external sources (see above), such as microbial biomass (Cowie and Hedges, 1984; Panagiotopoulos and Semp´er´e, 2007). Re-gardless of the exact mechanism, our results clearly suggest that POM and DOM at the Arles station had undergone con-siderable degradation within the river and/or before entering the river.
5.6 Export of terrestrial organic carbon of the Rhˆone
River into the Gulf of Lions
Rivers discharge POC at a rate that is similar to the global accumulation rate of organic carbon in all marine sedi-ments (Berner, 1989). Previous studies indicated that the annual deposition of POC in the proximal Rhˆone prodelta and the distal Rhˆone prodelta were 8.0 ± 5.0 × 10¹⁰g yr−1 and 2.9 ± 1.2 × 10¹⁰g yr−1, respectively (De Madron et al.,
2000). If we assume that only RPOC accumulates on
the adjacent shelf or slopes (although a portion of RPOC may undergo extensive alteration through photochemistry or other biotic processes when exiting the river), our re-sults suggest that the RPOC annual fluxes were on average 9 × 10¹⁰g C yr−1and are in agreement with previous obser-vations.
Considering a surface area of 23 000 km2 and assum-ing that DOC comprises most of the TOC, with concentra-tions of approximately 70 µM C in surface (0–200 m) and 40 µM below 500 m (Santinelli et al., 2010 and references therein), the standing stock of TOC in the Gulf of Lions is ∼145 × 1010moles C. The annual TOC (POC + DOC) input from the Rhˆone is 1.7 × 10¹⁰ moles C (Table 4) and repre-sents only ∼1 % of the standing stock of TOC in the Gulf of Lions. Expanding our results to the entire Mediterranean Sea, the annual TOC input of the Rhˆone River accounts for ∼0.007 % of the Mediterranean standing stock of TOC and is in agreement with previous estimations (∼0.01 %; Semp´er´e et al., 2000).
Our results also showed that carbohydrates accounted for ∼7 % of TOC, whereas glucose represented ∼33 % of the total carbohydrates (Tables 2 and 3). This corresponds to annual flux of 3.8 × 10⁸moles glucose (or 6.9 × 10¹⁰ g glucose) and it is in the same order of magnitude with the inputs of other species such as total nitrogen (11.5– 12.7 × 10¹⁰g yr−1), phosphorus (0.65–1.2 × 10¹⁰g yr−1), and silicate (13.5–13.9 × 10¹⁰g yr−1)(Moutin et al., 1998). The above results highlight the important contribution of the Rhˆone River to the Gulf of Lions and in Mediterranean Sea in general.
6 Conclusions
The conclusions of this seasonal investigation of the carbo-hydrate species and related chemical parameters (POC and DOC) and their fluxes estimated for the Rhˆone River are summarized below:
a. Carbohydrates contributed approximately equally (av. 7–8 %) to both POM and DOM. PCHO followed the variations of POM and peaked during flood events, whereas DCHO and DOC did not show any specific trend between low and high discharge periods. More-over, DOC and consequently DCHO concentrations were not correlated with the water discharge, suggesting a decoupling between particulate and dissolved organic matter.
b. The information on the concentration and compo-sition of carbohydrates provided important indica-tions of organic matter sources and the degree of diagenesis. Our results showed that, during flood events, PCHO exhibited a distinct molecular com-position (Fig. 4a), rich in mannose, which is
typi-cal of each flood event. This enrichment in
man-nose probably reflects an allochthonous origin, most likely from angiosperms (leaves or grasses). In low-water periods, PCHO exhibited compositional similar-ities to POM, indicating a terrestrial origin (again an al-lochthonous source), which conceals the organic mat-ter produced within the river (autochthonous source). Based on the (Fuc + Rha)/(Ara + Xyl), Man/Xyl ratios, Xyl % and (Ara + Gal + GalUA) %, with the relative abundances calculated on a glucose-free basis, our re-sults showed that DCHO had different terrestrial ori-gins (gymnosperms tissues and soils), including bacte-ria (Fig. 4d; Fig. 6b). Galactose and arabinose cluster together with DOC in the PCA, indicating that the ori-gins of these sugars are probably reflected in DOC. The Hex/Pen ratios and (Fuc + Rha) % relative abundances, both calculated on a glucose-free basis, indicated that POM and DOM had undergone considerable degrada-tion within the river and/or before entering the river. c. Galacturonic acid abundances in riverine organic
mat-ter showed that this compound has a good potential for tracking terrestrial organic matter origins. Similar com-pounds (methylated uronic acids) were also detected, but they were not identified within the uronic acid pool. As such, additional information was lost about the ori-gins of these carbohydrates; therefore, further studies are needed to better understand their roles and distribu-tions in the terrestrial and marine environments. d. The estimated carbohydrate fluxes from the Rhone
River into the Mediterranean Sea over the sampling period averaged 0.064 ± 0.026 × 10¹⁰moles C yr−1
of PCHO and 0.042 ± 0.008 × 10¹⁰moles C yr−1 of
DCHO, representing 6 % and 7 % of the annual flux of POC and DOC, respectively. These results are in accordance with previous flux estimates for bulk POC and DOC over the period 1987 and 1996 (Semp´er´e et al., 2000). Finally, by expanding our results to the Gulf of Lions (the northwestern Mediterranean Sea), we found that TOC fluxes accounted for ∼1 % of the standing stock of seawater TOC. Glucose is the most abundant carbohydrate in both the particulate and dissolved organic matter pools, and its annual flux into the Gulf of Lion was estimated to be 3.8 × 10⁸moles glucose.
Acknowledgements. This research was funded by the French
National Research Agency, program “Vuln´erabilit´es: Milieux et Climat” under the grant CHACCRA (contract number ANR-VULN-06-001-01), the French INSU-EC2CO program RiOMar.fr, and the MANDARINE project (region Provence Alpes Cˆote d’Azur). The manuscript benefited from advice and comments rom W. Ludwig, M. Tedetti and the three anonymous reviewers. Liquid discharges values in Arles were made available thanks to the CNR. The authors gratefully acknowledge M. Fornier and M. Thaust for analytical and field assistance.
Edited by: K. Suzuki
The publication of this article is financed by CNRS-INSU.
References
Alin, S. R., Aalto, R., Goni, M. A., Richey, J. R., and Dietrich, W. E.: Biogeochemical characterization of carbon sources in the Strickland and Fly rivers, Papua New Guinea, J. Geophys. Res.-Earth., 113, F01S05, doi:10.1029/2006JF000625, 2008. Amon, R. M. W. and Benner, R. Combined neutral sugar as
indi-cators of the diagenetic state of dissolved organic matter in the Arctic Ocean, Deep-Sea Res. Part I, 50, 151–169, 2003. Amon, R. M. W. and Meon, B.: The biogeochemistry of dissolved
organic matter and nutrients in two large Arctic estuaries and potential implications for our understanding of the Arctic Ocean system, Mar. Chem., 92, 311–330, 2004.
Aufdenkampe, A. K., Hedges, J. I., Richey, J. E., Krusche, A. V., and Llerena, C. A.: Sorptive fractionation of dissolved organic nitrogen and amino acids onto fine sediments within the Amazon Basin, Limnol. Oceanogr., 46, 1921–1935, 2001.
Aufdenkampe, A. K., Mayorga, E., Hedges, J. I., Llerena, C., Quay, P. D., Gudeman, J., Krusche, A. V., and Richey, J. E.: Organic matter in the Peruvian headwaters of the Amazon:
Composi-tional evolution from the Andes to the lowland Amazon main-stem, Org. Geochem., 38, 337–364, 2007.
Aufdenkampe, A. K., Mayorga, E., Raymond, P. A., Melack, J. M., Doney, S. C., Alin, S. R., Aalto, R. E., and Yoo, K.: Riverine coupling of biogeochemical cycles between land, oceans, and at-mosphere, Front. Ecol. and Environ., 9, 53–60, 2011.
Benner, R.: What happens to the terrestrial organic matter in the Ocean, Mar. Chem., 92, 307–310, 2004.
Benner, R. and Opsahl, S.: Molecular indicators of the sources and transformations of dissolved organic matter in the Mississippi river plume, Org. Geochem., 32, 597–611, 2001.
Bergamaschi, B. A., Walters, J. S., and Hedges, J. I.: Distribu-tions of uronic acids and O-methyl sugars in sinking and sedi-mentary particles in two coastal marine environments, Geochim. Cosmochim. Acta., 63, 413–425, 1999.
Bergfeld, T., Scherwass, A., Ackermann, B., Arndt, H., and Schol, A.: Comparison of the components of the planktonic food web in three large rivers (Rhine, Moselle, and Saar), River Res. and applications., 25, 1232–1250, 2009.
Berner, R. A.: Biogeochemical cycles of carbon and sulfur and their effect on the atmospheric oxygen over Phanerozoic time, Palaeo-geogr. Palaeoclim. Palaeoecol., 75, 97–122, 1989.
Bethoux, J. P. and Gentili, B.: Functioning of the Mediterranean Sea: past and present changes related to freshwater input and climate changes, J. Marine Syst., 20, 33–47, 1999.
Biersmith, A. and Benner, R.: Carbohydrates in phytoplankton and freshly produced dissolved organic matter, Mar. Chem., 63, 131– 144, 1998.
Bourgeois, S., Pruski, A. M., Sun, M.-Y., Buscail, R., Lantoine, F., Kerherv´e, P., V´etion, G., Rivi`ere, B., and Charles, F.: Distri-bution and lability of land-derived organic matter in the surface sediments of the Rhˆone prodelta and the adjacent shelf (Mediter-ranean Sea, France): a multi proxy study, Biogeosciences, 8, 3107–3125, doi:10.5194/bg-8-3107-2011, 2011.
Bray, N. A., Ochoa, J., and Kinder, T. H.: The role of interface in exchange through the Strait of Gibraltar, J. Geophys. Res., 100, 755–776, 1995.
Cauwet, G., Gadel, F., de Souza Sierra, M. M., Donard, O., and Ewald, M.: Contribution of the Rhˆone River to organic carbon input to the northwestern Mediterranean Sea, Cont. Shelf Res., 10, 1025–1037, 1990.
Copin-Mont´egut, C.: Alkalinity and carbon budgets in the Mediter-ranean, Global Biogeochem. Cy., 7, 915–925, 1993.
Coste, C. and Raimbault, P.: Recent data on the nutrient inputs into the Mediterranean Sea by the Rhˆone River, in: EROS 2000, edited by: Martin, J. M. and Barth, H., NERC, Plymouth, UK Water Pollut. Res. Rep., 30, 47–50, 1993.
Cowie, G. L. and Hedges, J. I.: Carbohydrate sources in a coastal marine environment, Geochim. Cosmochim. Acta., 48, 2075– 2087, 1984.
da Cunha, L. C., Serve, L., and Blazi, J. L.: Neutral sugars as biomarkers in the particulate organic matter of a French Mediter-ranean river, Org. Geochem., 33, 953–964, 2002.
Dagg, M., Benner, R., Lohrenz, S., and Lawrence, D.: Transforma-tion of dissolved and particulate materials on continental shelves influenced by large rivers: plume processes, Cont. Shelf Res., 24, 833–858, 2004.
Degens, E. T., Kempe, S., and Richey, J. E.: Biogeochemistry of major world rivers, Scope 42, J.Wiley and Sons, Ltd, Chichester,