HAL Id: hal-02297782
https://hal.archives-ouvertes.fr/hal-02297782
Submitted on 24 Nov 2020
HAL is a multi-disciplinary open access
archive for the deposit and dissemination of sci-entific research documents, whether they are pub-lished or not. The documents may come from teaching and research institutions in France or abroad, or from public or private research centers.
L’archive ouverte pluridisciplinaire HAL, est destinée au dépôt et à la diffusion de documents scientifiques de niveau recherche, publiés ou non, émanant des établissements d’enseignement et de recherche français ou étrangers, des laboratoires publics ou privés.
Winter extratropical cyclone influence on seabird
survival: variation between and within common eider
populations
Loreleï Guéry, Sébastien Descamps, K. Hodges, Roger Pradel, B Moe, S.
Hanssen, K. Erikstad, G. Gabrielsen, H. Gilchrist, Stéphanie Jenouvrier, et al.
To cite this version:
Loreleï Guéry, Sébastien Descamps, K. Hodges, Roger Pradel, B Moe, et al.. Winter extratropical cyclone influence on seabird survival: variation between and within common eider populations. Marine Ecology Progress Series, Inter Research, 2019, 627, pp.155 - 170. �10.3354/meps13066�. �hal-02297782�
Title:
Winter extratropical cyclones influence seabird survival: variation between and within 1common eider populations 2
Running page head:
Winter extratropical cyclones and eider survival 34
L. Guéry*a, S. Descampsb, K. I. Hodgesc, R. Pradeld, B. Moee, S. A. Hanssenf, K. E. Erikstadf,g, 5
G.W. Gabrielsenb, H. G. Gilchristh, S. Jenouvrieri,j andJ. Bêtya
6 7
a Département de Biologie and Centre d’études nordiques, Université du Québec à Rimouski,
8
Rimouski, Canada 9
b Norwegian Polar Institute, Fram Center Tromsø, Norway
10
c Department of Meteorology, University of Reading, Reading, United Kingdom
11
d CEFE UMR 5175, CNRS - Université de Montpellier - Université Paul-Valéry Montpellier -
12
EPHE, Montpellier, France 13
e Norwegian Institute for Nature Research, Trondheim, Norway
14
f Norwegian Institute for Nature Research, Arctic Ecology Department, Fram Centre, Tromsø,
15
Norway 16
g Department of Biology, Centre for Biodiversity Dynamics, Norwegian University of Science
17
and Technology, Trondheim, Norway 18
h National Wildlife Research Centre, Environment Canada, Ottawa, Canada
19
i Woods Hole Oceanographic Institution, Mailstop 50, Woods Hole, MA 02543, USA
20
j Centre d’Etudes Biologiques de Chizé, UMR7372 CNRS, F-79360 Villiers-en-Bois, France
21 22
* corresponding author: [email protected] 23
Keywords:
Seabirds: Extreme weather and climatic event; marine vertebrates, multi-event 24models; hidden states and mixture models; NAO; Arctic; inter and intra-population 25
heterogeneity; migratory tactics; Somateria mollissima; 26
Abstract
27
Mid-latitude atmospheric variability is mainly driven by extratropical cyclones (ETCs) that 28
play a primary role in determining the variation in local weather and marine conditions. ETCs 29
have a broad range of intensities, from benign to extreme, and their paths, frequency, and 30
intensity may change with global warming. However, how ETCs, and cyclones in general, 31
currently affect marine wildlife is poorly studied and remains substantially unexplored. To 32
understand how extreme winter ETCs affect the inter-annual variability of adult seabird survival 33
within and between populations, we used capture-mark-recapture datasets collected in two arctic 34
(northern Canada and Svalbard) and one subarctic (northern Norway) breeding populations of 35
common eider, Somateria mollissima, over periods of 19, 16 and 30 years, respectively. We 36
found significant negative correlations between winter ETC activity and eider survival, but 37
different mechanisms appear to be involved in the different studied populations. The number of 38
winter ETCs, extreme or not, was found to be linked to survival without lags in the Canadian 39
population, whereas amplitude and duration of extreme winter ETCs (with time lags) impacted 40
adult survival in the Svalbard and northern Norway eider breeding populations. We hypothesise 41
that fjords found on the wintering grounds would act as climatic shelters and provide natural 42
protection, and hence could partly explain inter-population heterogeneity in the response to 43
ETCs. We suggest that ETCs represent a likely mechanism behind the frequently reported 44
relationship between North Atlantic Oscillation and seabird survival in the North Atlantic. 45
Introduction
46
Understanding how individuals and populations respond to fluctuations in climatic conditions 47
is critical in order to explain and anticipate changes in ecological systems. This requires 48
identifying relevant climatic parameters that affect demographic rates (e.g. survival, recruitment 49
or breeding success; (Jenouvrier 2013), both directly and indirectly (Grosbois & Thompson 50
2005, Harris et al. 2005). In some regions, extreme climatic events such as heat waves, droughts, 51
intense precipitation and storms are predicted to increase in frequency in most future climate 52
scenarios and have been identified as one of the largest threats to wildlife (Easterling et al. 2000) 53
IPCC 2002; (Ummenhofer & Meehl 2017). Adverse weather conditions caused by these events 54
have already been identified as having a direct impact on plants (e.g. (Reyer et al. 2013) and 55
animals (e.g. Jenouvrier et al. (2015) for birds, Tyler (2010) for large mammals). 56
Tropical cyclones, defined as air masses rotating around a centre of low atmospheric pressure 57
originating in the tropics, and their associated strong winds are often reported as examples of 58
extreme events, which can drive wildlife demography (e.g. Dunham et al. (2011) on a lemur 59
species or Pike and Stiner (2007) on sea turtle species). In birds, most studies dealing with the 60
effect of tropical cyclones are based on a single population and a single extreme event 61
(Chambers et al. 2011, Raynor et al. 2013), with much greater mass-mortality occurring during 62
migration periods (Newton 2007). However, studies based on long-term population monitoring 63
and fluctuations of extreme events over time are crucial to properly quantify the effect of such 64
events on bird demography (van de Pol et al. 2017). There are very few examples of such studies 65
in the literature in the context of extreme events (Jenouvrier et al. 2009, Boano et al. 2010, 66
Genovart et al. 2013, Descamps et al. 2015). Moreover, populations of a given species and 67
individuals within a population may respond differently to extreme events. None of the previous 68
studies considered such potential heterogeneity although it may influence species persistence. 69
In addition, the vulnerability of wildlife to cyclones occurring outside the tropics 70
(extratropical cyclones, ETCs; (Wang et al. 2013) has never been investigated although they are 71
a dominant feature of mid-latitude atmospheric variability and play a primary role in determining 72
local weather (Hoskins & Hodges 2002, Ulbrich et al. 2009, Wang et al. 2013). ETCs 73
(extratropics defined as 30–90°N or S) are often associated with extreme winds and precipitation 74
and with changes in temperature (Hoskins & Hodges 2002, Ulbrich et al. 2009, Wang et al. 75
2013). Hence, assessing the potential effects of ETCs and their extremes (i.e., cyclones 76
associated with extremely high wind speeds) on marine bird species breeding, wintering or 77
migrating outside the tropics is important to understand ecological responses to changes in 78
climatic conditions. 79
In this study, we investigated the influence of winter ETCs, extreme or not, on adult survival 80
of a long-lived sea duck, the common eider (Somateria mollissima). Increased ETC activity 81
could directly (no time lag) increase their foraging effort and energetic needs required to 82
maintain body temperature (Heath et al. 2006, Heath & Gilchrist 2010) and ultimately may 83
directly decrease common eider survival. In addition, ETCs could negatively and indirectly (with 84
time lag) affect eider survival by influencing oceanographic conditions (Visbeck et al. 2003, 85
Sarafanov 2009) and hence eider food availability and/or food quality (Menge et al. 2008, 86
Descamps et al. 2010). Heavy storms can destroy bivalves beds at shallow depths (Brenko & 87
Calabrese 1969, Reusch & Chapman 1995, Carrington 2002, Carrington et al. 2009) or reduce 88
primary productivity (Fujii & Yamanaka 2008). 89
The effects of ETCs could be modulated by coastal topography and by the presence of fjords 90
on the eider wintering grounds. Fjords, hereafter named “climatic shelters”, are defined as 91
narrow inlets of the sea between cliffs or steep slopes, which can provide natural shelters from 92
the wind (Howe et al. 2010). The climatic shelter effect of fjords has already been suggested for 93
marine wildlife (Boje 2002, Brown 2002, Sanino & Van Waerebeek 2008, Howe et al. 2010, 94
Acevedo et al. 2017) Hence, we expect that the direct effects of ETCs on birds should be 95
strongly reduced for eiders wintering in areas offering climatic shelters. When natural shelters 96
are available, the effects of ETCs, if any, should be mostly indirect (through the food chain). The 97
effects of ETCs may thus vary among and within populations, depending on the presence of 98
climatic shelters and on the frequency and/or intensity of the ETC affecting the specific 99
wintering grounds used by birds. We examined the relationship between winter ETCs and eider 100
survival in three breeding populations with different wintering areas. We predicted intra- and 101
inter-population heterogeneity in the effects of ETCs on survival and hence defined population-102
specific predictions. 103
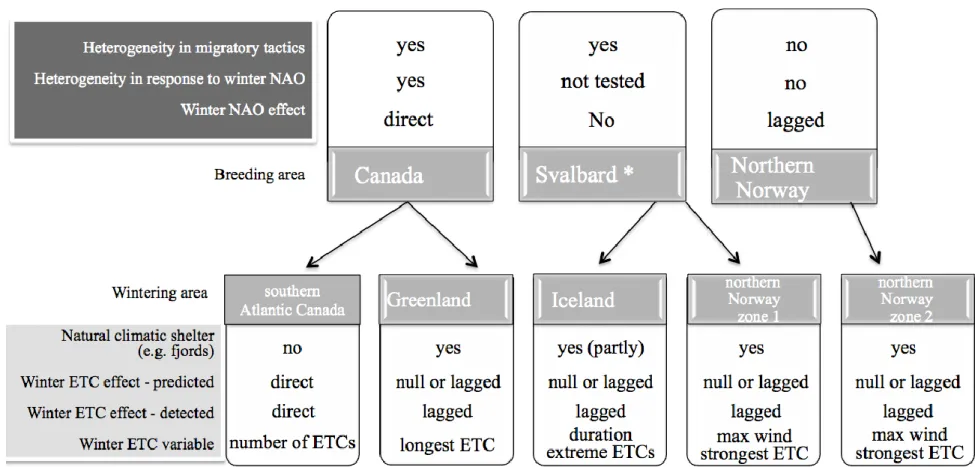
Most female eiders breeding in Canada winter in southwest Greenland, where there is 104
access to climatic shelters (fjords), while the rest of the population winter in southern Atlantic 105
Canada, with no access to fjords (Mosbech et al. 2006, Guéry et al. 2017). Winter ETC activity 106
also varies between these two distinct wintering grounds (e.g. more ETCs and a longer duration 107
of extreme ETCs in southern Atlantic Canada; Table 1). We thus expected to observe intra-108
population heterogeneity in the response of eider survival to ETC activity in this Canadian 109
breeding population, and we predicted that winter ETC activity would have a negative influence 110
with a direct (without time lag) effect only on the survival of eiders wintering in southern 111
Atlantic Canada (Figure 1). For eiders breeding in Svalbard, the majority winter in the northeast 112
fjords of Iceland while the others winter in fjords of northern Norway. Eiders breeding in 113
northern Norway are year-round residents and spend the winter in the fjords close to their 114
breeding grounds. We thus expected no direct effect of winter ETC activity in both the Svalbard 115
and Northern Norway breeding populations (Figure 1). 116
Finally, we expected that the frequency and intensity of winter ETCs would be the main 117
specific driver explaining the reported relationships between the North Atlantic Oscillation 118
(hereafter, NAO; Hurrell et al. 2003) and the survival of eider populations wintering in the North 119
Atlantic (Guéry et al. 2017). The winter NAO is well-known to be correlated with mean 120
intensity, track density and mean speed of ETCs (Sorteberg et al. 2005), especially in winter 121
(Hurrell et al. 2003). In accordance with previous results based on NAO (Guéry et al. 2017), we 122
predicted that winter ETC activity would have negative and indirect (with time lag) effects on 123
eiders wintering in northern Norway (Figure 1). The specific wintering location of many 124
individuals in our study populations was unknown. To investigate intra-population heterogeneity, 125
we thus used a novel statistical tool (capture-recapture mixture model) to test for a priori 126
expected intra-population heterogeneity. This approach allowed us to examine the relationship 127
between local wintering conditions and the survival response of groups of individuals generated 128
by the mixture model based on capture history. A lack of recapture data in the Svalbard breeding 129
population prevented us from properly testing intra-population heterogeneity in the survival 130
response to ETC activity, so the ETC effect of each wintering ground (either Iceland or northern 131
Norway) was tested on the whole population. 132
Materials and methods
133
Study species and populations 134
Common eider (Somateria mollissima)
135
Common eiders are sea ducks that mostly breed in the Arctic and whose females are typically 136
faithful to their natal colony (Wakeley & Mendall 1976, Swennen 1989). They start breeding 137
between 2 and 5 years old (Hario et al. 2009) and can live an average of 15 years (Zammuto 138
1986). Only adult females (>2 years old as they come back to the colony to attempt breeding) 139
were captured on their breeding grounds and included in the study, but their exact age was 140
unknown. Their winter diet can include several marine resource types such as bivalves, marine 141
polychaete worms, gastropods, crustaceans and echinoderms (Goudie & Ankney 1986,
142
Guillemette et al. 1992, Merkel et al. 2007). 143
144
Canadian Arctic, East Bay Island
145
Data were collected from 1996 to 2014 on East Bay Island (Mitivik Island; 0.19 km2), a small 146
island in the North East of Southampton Island, Nunavut, Canada. An average of 545 female 147
eiders (ranging from 209 in 1997 to 1035 in 2006) were annually seen from observation blinds or 148
physically captured. Blind distribution and the rolling topography of the island induced detection 149
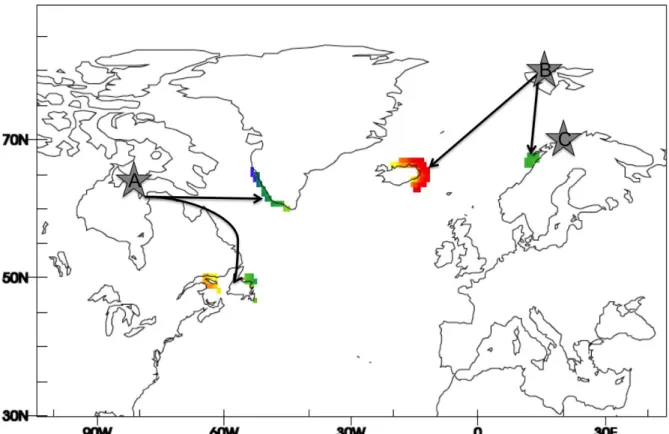
heterogeneity among birds (Guéry et al. 2017). The wintering areas of 26 common eider females 150
were determined (see below) using satellite transmitters implanted in 2001 and 2003 (Mosbech 151
et al. 2006), and in 2012 and 2013 (Gilchrist unpubl. data; Figure 2). The procedures for
152
capturing, marking and band reading in East Bay are described in detail by both Mosbech et al. 153
(2006) and Descamps et al. (2010). Female eiders from East Bay winter either in southwest 154
Greenland (78%) or near sea ice edges of southern Atlantic Canada (22%) along southern 155
Labrador, Newfoundland, and south of the Gulf of Saint-Lawrence (Mosbech et al. 2006); Figure 156
2). Sea ice is observed only in the southern Atlantic wintering area 157
(http://nsidc.org/data/seaice_index/archives/image_select.html). In the Gulf of St. Lawrence, 158
eiders preferably feed on blue mussels that they find near the shore, in kelp beds or in rocky 159
habitat (Guillemette et al. 1992), while they feed on gastropods in Newfoundland (Goudie & 160
Ankney 1986) and on softshell clams Mya eideri and marine polychaete worms that they find in 161
soft sediments in southwest Greenland (Merkel et al. 2007). 162
163
Svalbard, Prins Heinrich Island
An average of 65 females (ranging from 8 in 2003 to 136 in 2007, with 0 captured in 2000 and 165
2006) were physically captured every year from 1999 to 2014 on Prins Heinrich Island (78° 55 166
‘N, 12°00’ E; Figure 2), on the west coast of Svalbard, one of several islands housing an eider 167
colony with 3000 breeding females. This small island (0.06 km2) in Kongsfjorden, covered by
168
rock and tundra, is a flat and homogeneous island. No heterogeneity in detection occurred 169
(Guéry et al. 2017). About 77% of eiders in this breeding population migrated to northeastern 170
Iceland and 23% to northern Norway (Hanssen et al. 2016), called zone 1 (Figure 2). Wintering 171
locations were determined from geolocators (Global Location Sensing or GLS logging; Wilson 172
et al. 1992), which record sunlight intensity used to calculate visited areas with an accuracy of
173
ca. 200 km around each point (Wilson et al. 1992). Due to the lack of variation in day length 174
with respect to latitude close to equinoxes, latitudes are unreliable for these specific periods. 175
Geolocators were deployed on female common eiders breeding on Storholmen Island, located 5 176
km NE of Prins Heinrich Island. A total of 95 females were equipped in June or July over four 177
years (2009, 2010, 2011 and 2013), while 48 females were recaptured and data was successfully 178
retrieved from 47 geolocators. Details on capture, geolocator deployment, and the calibration, 179
smoothing and calculations of the geolocator data are described in Hanssen et al. (2016). 180
181
Northern Norway, Grindøya Island
182
This study was conducted in an eider colony (200-500 pairs) on Grindøya, a 0.65-km2 island near
183
Tromsø, northern Norway (69°37’N, 18°51’E, Figure 2). During the breeding seasons of 1985-184
2014, nesting female eiders were captured (average of 104; ranging from 36 in 2014 to 235 in 185
1995) with a noose pole during the incubation period, i.e. only physical recaptures occurred (no 186
band reading at distance). Females from Grindøya annually breed in habitats including beach, 187
stunted forest or bushes that induced heterogeneity in detection probability (Guéry et al. 2017). 188
They are resident and preferably feed on blue mussels. They thus spend the winter in the vicinity 189
of their breeding location in northern Norway (Bustnes & Erikstad 1993, Anker-Nilssen et al. 190
2000), called zone 2, all exposed to the same winter conditions. 191
192
Wintering areas definition 193
Wintering areas were defined using tracking data for the two migrating populations: from 194
satellite transmitters for the Canadian breeding population and geolocators for the Svalbard 195
breeding population. All tracking data were filtered to keep only reliable locations following the 196
procedures described in Mosbech et al. (2006) for the Canadian breeding population and in 197
Hanssen et al. (2016) for the Svalbard breeding population. Thus, we extracted winter locations 198
from December to March for the Canadian population and from December to February for the 199
Svalbard population. Data were excluded close to the spring equinox (March) for Svalbard eiders 200
(see above). We then calculated kernel densities and kernel contours using the adehabitatHR 201
package in R (Calenge 2006). Finally, as female eiders only reside at sea and along shorelines 202
during winter, we subtracted land cover from the density core contours to get the final wintering 203
areas (Figure 3). For eiders from northern Norway, no tracking data were available, but they are 204
known to stay close to the shore in water shallower than 10m (Bustnes & Lønne 1997) in the 205
vicinity of their breeding island (mostly within 50 km, Bustnes and Erikstad unpublished data). 206
As eiders spread along the shoreline, we defined their wintering area as the smallest ellipse that 207
is allowed by the data grid resolution of the data used to identify ETCs and is parallel to the 208
shoreline and centred on the breeding island, i.e. with a major axis of 200 km and a minor axis of 209
160 km. We also subtracted land cover to get the final wintering areas. 210
211
Variables considered 212
Winter ETC variables
213
ETCs in the northern hemisphere are weather systems with an anticlockwise circulation, 214
around a centre of low atmospheric pressure. They are much less known to biologists than 215
tropical cyclones but are of paramount importance as they regulate local weather and contribute 216
to the general circulation of the atmosphere through the transportation of energy and momentum 217
polewards (Hoskins & Hodges 2002, Ulbrich et al. 2009, Wang et al. 2013). Also, ETCs are 218
different from tropical cyclones since they primarily get their energy from horizontal temperature 219
contrasts, though diabatic processes can also play an important role in their development, 220
whereas tropical cyclones are dependent on evaporation over warm tropical waters and develop 221
via the release of latent heat. Even if tropical cyclones can undergo extratropical transition (Jones 222
et al. 2003) to become extratropical cyclones, no tropical cyclones reached the latitudes of the 223
eider wintering areas during the study period. 224
Several methods exist to track ETCs, using either minimum pressure or maximum 225
vorticity (in the north hemisphere), which is a measure of the spin of the air. Because these 226
methods have different views on what and when define a cyclone, they often differ on how many 227
cyclones are detected. However, differences mainly occur for the weaker storms, and they 228
generally agree for the strongest ones. Readers are referred to Ulbrich et al. (2009) for a 229
comprehensive review of studies using different cyclone tracking methods. In this study, we used 230
the approach described in Roberts et al. (2014) and Hoskins and Hodges (2002), i.e. ETCs are 231
identified and tracked using the maximum vorticity approach based on the 850hPa relative 232
vorticity since it represents smaller spatial scales than the pressure and is less influenced by the 233
large-scale background (Hodges 1994, Hoskins & Hodges 2002, Roberts et al. 2014). To remove 234
short-lived and stationary systems, tracks were retained for further analysis only when they 235
lasted longer than 1 day and travelled further than 1000 km. Thus, we considered all synoptic 236
scale (1000-2500 km) ETCs in the northern hemisphere (30-900N), which cover a broad range of
237
intensities, extreme or not. Data used for the cyclone tracking are from the European Centre for 238
Medium-Range Weather Forecasts (ECMWF) Interim reanalysis (ERA-Interim, (Dee et al. 239
2014)) for the December-March period of 1979-2015 at 3-hour time resolution (see Roberts et al. 240
2014). 241
Properties from the eider wintering areas were added to the tracks by defining a spherical 242
cap sampling region of arc radius 6° (~670km) centred on the ETC positions (adequate for 243
capturing the wind extremes for individual ETCs, (Bengtsson et al. 2009); Figure 3). Varying 244
this radius between 5-10 degrees did not change our main conclusions. To calculate the winter 245
ETC activity experienced by eiders, we considered all ETC regions overlapping with the 246
population-specific wintering area defined above (Figure 3). All the wind-related variables added 247
to the vorticity tracks were based on the 10m winds above the sea surface, available from the 248
ERA-Interim data, as eiders generally fly just a few meters above the water. This was achieved 249
by masking the 10m wind data to retain only data within the eider wintering areas. 250
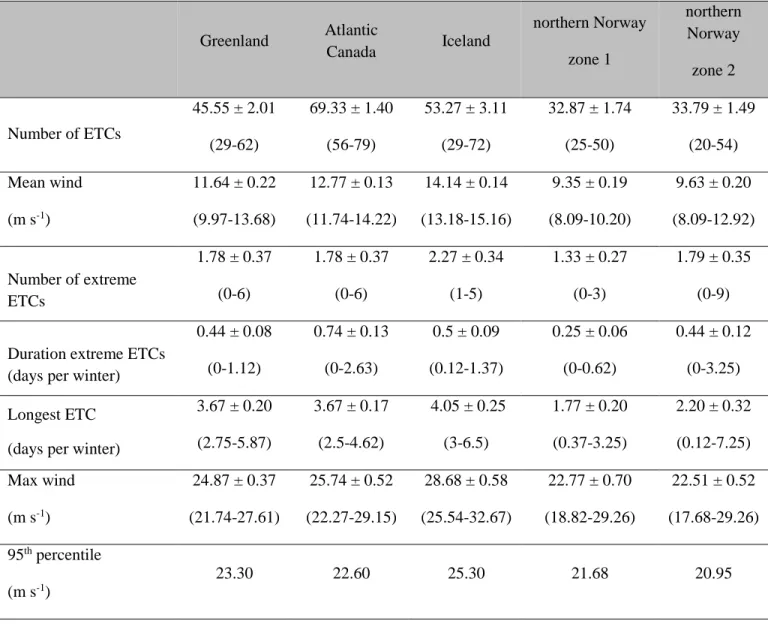
Several classifications of extreme ETCs exist (see review of Catto (2016)), and we used the one 251
based on wind impact, one of the major impacts of ETCs. We defined extreme ETCs as cyclones 252
that reached at least once a wind speed above the 95th percentile threshold of the local wind 253
speed distribution (Table 1). Wind speeds can vary substantially in our study areas. In Greenland 254
for example, winter wind speeds associated with ETCs were an average of 11.7 ± 0.2 m s-1, 255
while wind speed reached 28.5 m s-1 during the strongest ETC ( 256
Table 1). To describe ETC activity in each wintering area during the winter (December to 257
March), we considered six variables from mean to extreme ETC activity within the ETC regions 258
overlapping with the population-specific wintering area. The two variables for the mean ETC 259
activity are the total number of ETCs (Number of ETCs), where an ETC is counted if the 260
sampling region overlaps a wintering region, and their mean wind speed (Mean wind) . The four 261
other variables measure the number of extreme ETCs, i.e. with wind speeds above the 95th 262
percentile threshold of the local wind speed distribution at least once in the overlap region, the 263
number of days of extreme ETC (Duration extreme ETCs), the duration of the longest ETC 264
(Longest ETC) and the maximum wind speed of the strongest ETC (Max wind), all relative to 265
the overlap. Descriptive statistics of each variable on wintering area are described in 266
Table 1. Correlations (statistical test based on Pearson's correlation coefficient with the 267
function cor.test in the software R) between variables of winter ETC activity and winter NAO 268
are presented in the Supporting Information S2 for each wintering area. The winter NAO was 269
significantly correlated with at least one winter ETC variable and in most cases with the number 270
of winter ETCs. 271
272
Winter North Atlantic Oscillation
273
Winter North Atlantic Oscillation (NAO) values are based on the difference in 274
normalized sea level pressure between Lisbon, Portugal and Stykkisholmur/Reykjavik, Iceland. 275
Data from
https://climatedataguide.ucar.edu/climate-data/hurrell-north-atlantic-oscillation-nao-276
index-station-based were used in the analysis. We defined the winter NAO as monthly NAO 277
values averaged from December to March (Descamps et al. 2010, Guéry et al. 2017), when all 278
the birds were on their wintering grounds. 279
280
Mark-recapture modelling procedure 281
We followed the same mark-recapture modelling procedure as the one presented in Guéry 282
et al. (2017) including i) goodness-of-fit (GOF) tests to check the fit of our datasets to the
single-283
state Cormack-Jolly-Seber (CJS) reference model (Burnham 1987) and test for individual 284
detection heterogeneity (see Supporting Information S1), ii) CMR mixture models, which 285
SURGE, iii) a model selection based on the Akaike’s information criterion (Burnham & 287
Anderson 2002) adjusted accordingly (see below) and, iv) analyses of deviance (ANODEV, 288
(Grosbois et al. 2008) in order to test and quantify the influence of environmental covariates on 289
eider survival in each population. We analysed 3954, 553 and 1336 individual encounter 290
histories of female Common eiders respectively from the Canadian Arctic (East Bay), Svalbard 291
(Prins Heinrich) and northern Norway (Grindøya). Avian cholera outbreaks have occurred 292
regularly in the Canadian population, which strongly affected eider survival (Descamps et al. 293
2009, 2012). To remove this cause of mortality from the analysis, we removed the individuals at 294
their last capture/recovery (right-censoring). Models were implemented in program E-SURGE 295
(Choquet et al. 2009b). The implementation in practice of the CMR mixture models in program 296
E-SURGE is given in Appendix S2 of Guéry et al. (2017). 297
All the GOF test components were computed using U-CARE (Choquet et al. 2009a), and 298
GOF tests results are presented in Appendix S1 (Table S1). 299
In the model selection, we investigated the effect of winter ETCs on female eider survival 300
with and without taking into account survival heterogeneity among individuals. Although the 301
mark-recapture modelling procedure was the same, the approach proposed in this paper is 302
different from Guéry et al. (2017). We started from these winter locations to define wintering 303
areas and used them to extract local covariates (ETCs variables). We then considered whether 304
variations in winter ETC variables on each wintering ground affected just one or both groups of 305
eiders. We expected each wintering ground conditions to only explain survival variation of the 306
right hypothetic group. We studied this influence of ETC activity with and without delayed 307
effect (time lags). Finally, we compared the relationships between female eider survival and 308
winter ETCs to that of survival and winter NAO, with or without time lags accordingly. 309
Concerning the impact of the winter NAO on eider survival, adding year 2014 to the time series 310
used in the previous study (Guéry et al. 2017) confirmed their results in all three breeding 311
populations, especially for the Svalbard population: winter NAO marginally explains survival 312
fluctuations (p = 0.073; Table 2). 313
We used the Akaike’s information criterion (Burnham & Anderson 2002) to rank our 314
models, adjusted for overdispersion (Quasi-Akaike’s information criterion, QAIC) for the 315
Canadian population, adjusted for small sample size (Second-Order Akaike’s information 316
criterion, AICc) for the Svalbard population and adjusted for both overdispersion and small 317
sample size (QAICc) for the Norwegian population. 318
Finally, we performed analyses of deviance (ANODEV, (Grosbois et al. 2008) to test 319
whether or not variations in the covariate were significantly associated with variation in eider 320
survival in each population, and we calculated the proportion of deviance (Dev) explained by a 321
given covariate as: 322
323
where Fcst, Ft and Fco refer respectively to models with constant, time and covariate effects
324
(results in Table 2).
325
Results
326
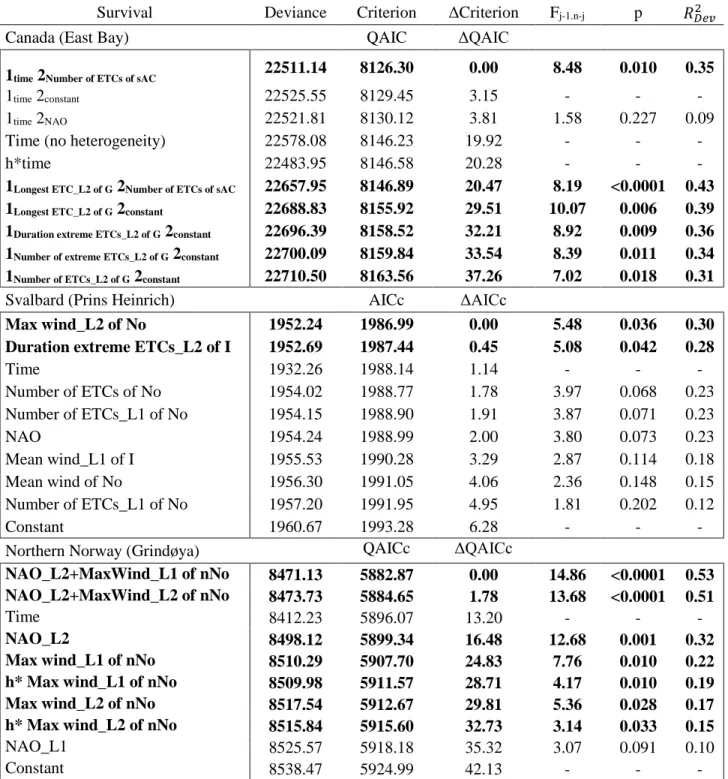
Relationships between winter ETCs and eider survival 327
In the Canadian Arctic breeding population (East Bay), the ETC variables that were 328
significantly linked to adult eider survival and described this relation best were: the number of 329
winter ETCs in southern Atlantic Canada with no time lag (model 1time 2Number of ETCs ofsAC; Table
330
2; Figure 4) and the duration of the longest ETCs in southwest Greenland with a lag of two years
331 ) ( ) ( ) ( ) ( 2 t cst co cst Dev F Dev F Dev F Dev F Dev R
significant individual heterogeneity in the survival response to winter ETC activity in this 333
population. In this model, survival variation of the group, which represented 24% of individual 334
capture histories, was negatively related to the number of winter ETCs in southern Atlantic 335
Canada (group H2; slope on logit scale = -1.46 ± 0.38 SE), while survival of the largest one 336
(group H1, 76% of capture-histories) fluctuated over years (model 1time 2Number of ETCs ofsAC;
337
𝑅𝐷𝑒𝑣2 = 0.35; Table 2; Figure 4). Although statistically less supported (ΔQAIC = 29.51; Table 1),
338
the duration of the longest ETC in southwest Greenland with a lag of two years was also 339
significantly and negatively correlated to survival of the group H1 (model 1Longest ETC_L2 of G
340
2constant; slope on logit scale = -0.41±0.08 SE; 𝑅𝐷𝑒𝑣2 = 0.39; Table 2).
341
Survival of eiders breeding in Svalbard and northern Norway was associated with lagged winter 342
ETC activity (Table 2). Survival of eiders breeding in Svalbard, for which intra-population 343
heterogeneity could not be tested, was negatively associated with the maximum wind speed of 344
the strongest ETC recorded on the Norwegian wintering ground zone 1 with a lag of two years 345
(model Max wind_L2 of No; 𝑹𝑫𝒆𝒗𝟐 = 0.30; slope on logit scale = -0.65±0.26 SE; Table 2; 346
Figure 5) and the duration of extreme ETCs in Greenland with the same time lag (model
347
Duration extreme ETCs_L2 of I; 𝑹𝑫𝒆𝒗𝟐 = 0.28; slope on logit scale = -0.47±0.24 SE; Table 2). 348
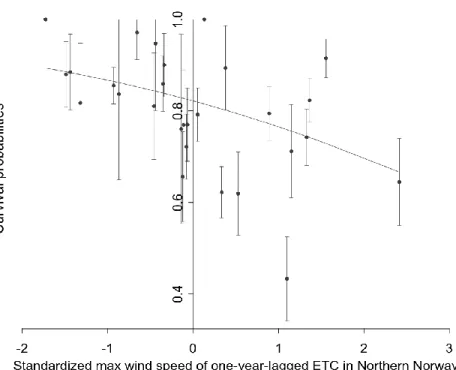
The main covariates that significantly and negatively explained survival of female eiders 349
breeding (and wintering) in northern Norway, i.e. Grindøya population, were the maximum wind 350
speed of the strongest ETC of northern Norway zone 2 with lags of one and two years (e.g. 351
model Max wind_L1 of Nno; 𝑹𝑫𝒆𝒗𝟐 = 0.22; slope on a logit scale = -0.34 ± 0.06SE; Table 2; Figure 352
6). No significant heterogeneity was detected for this population (ΔQAICc>3; Table 2). 353
354
Comparison between winter extra tropical cyclones and North Atlantic Oscillation 355
In East Bay population wintering areas, the winter NAO was highly and significantly 356
linked to the number of winter ETCs on the southern Atlantic Canada wintering ground 357
(R2=0.90; p<0.0001; Fig S2.1; Supporting Information S2), whereas it was not linked to winter 358
ETC activity in Greenland with a lag of 2 years (Fig S2.3; Supporting Information S2). 359
Moreover, the number of ETCs in southern Atlantic Canada performed as well as the winter 360
NAO to explain eider survival at a population level (h*NAO versus h*Number of ETCs of sAC; 361
ΔQAIC = 1.35; 𝑅𝐷𝑒𝑣2 =0.27 and 0.26 respectively). However, when we tested the effect of the
362
number of winter ETCs in southern Atlantic Canada and the winter NAO on each group 363
separately, the number of winter ETCs performed better (ΔQAIC = 3.81) and explained (𝑅𝐷𝑒𝑣2 = 364
0.35) survival variation of the smallest group better than the direct winter NAO (models 1time
365
2Number of ETCs ofsAC versus 1time 2NAO; Table 2).
366
For the Svalbard population, the lagged winter NAO was significantly associated with the 367
total number ETCs in Iceland (e.g. with winter NAO with one-year lag: R2 = 0.74; p = 0.001; Fig 368
S2.4; Supporting Information S2) but not significantly in northern Norway zone 1 (e.g. with 369
winter NAO with one-year lag: R2 = 0.48; p = 0.073; Fig S2.6; Supporting Information S2).
370
However, the ETC related covariates performed better than the NAO to explain variation in 371
survival of Svalbard eiders. No significant influence of winter NAO (lagged or not) on survival 372
was detected, whereas the maximum wind speed of ETCs in Norwegian wintering grounds (with 373
a 2 years-lag) performed and explained eider survival better than winter NAO regardless of time 374
lag (e.g. ΔQAIC = 2.00 between models Max wind_L2 of No and NAO; Table 2).
375
For the Norwegian breeding and wintering population, the winter NAO was significantly 376
associated with the number of extreme winter ETCs (e.g. with winter NAO with one-year time 377
lag: R2 = 0.37; p = 0.049; Fig S2.8; Supporting Information S2). Survival of eiders breeding and 378
wintering in northern Norway was better explained by the winter NAO with a lag of two years 379
alone (model NAO_L2, 𝑅𝐷𝑒𝑣2 = 0.32; Table 2) than by any winter ETC-related covariate. The
winter NAO with lags was not significantly associated to wind speed of the strongest ETC with 381
lags (Fig S2.8; Fig S2.9; Supporting Information S2) and including both variables into the same 382
model improved its performance. Models including the effects of both winter NAO and winter 383
ETC activity performed better (Table 2) and explained a larger proportion of variation in survival
384
(Table 2) than a model with winter NAO only. In particular, the winter NAO with a lag of two
385
years combined with the maximum wind speed of ETCs with a lag of one year explained 53% of 386
eider survival variation (model NAO_L2+Max wind_L1 of nNo; Table 2).
387
Discussion
388
The marine environment in non-tropical regions is highly influenced by ETCs (Hoskins 389
& Hodges 2002, Ulbrich et al. 2009, Wang et al. 2013). Although several marine species winter 390
in these regions, no study has quantitatively investigated the effect of cyclones occurring outside 391
the tropics on wildlife species. By coupling long-term capture-mark-recapture data with 392
individual tracking information to identify wintering areas, we provide the first quantitative 393
study of the impact of winter extratropical cyclones (ETCs) and their extremes on the annual 394
adult survival of a seabird. The underlying mechanisms involved in the winter ETC effect seem 395
to differ between and within these populations according to their wintering grounds. As 396
predicted, we detected inter- and intra-population heterogeneity in the response to winter ETC 397
activity that could be driven by variation in the birds’ wintering areas. 398
399
Climatic fluctuations affect survival of a long-lived species
400
The winter ETC activity seems to have negative effects on female eider survival in all 401
three breeding populations studied and explained between ca. 22% and 43% of the inter-annual 402
survival variation. These effects are similar to the effects of tropical hurricanes recorded on 403
Mediterranean Cory’s shearwaters migrating to the Central Atlantic and Southern Atlantic 404
(Boano et al. 2010). Eiders are long-lived and their population growth rate is very sensitive to 405
changes in adult survival (Sæther et al. 2000). Detecting a negative influence of local (here 406
winter ETC activity) and/or global (e.g. winter NAO) climatic variables on survival is thus 407
important to better understand the future viability of their populations. Adult survival is expected 408
to be buffered against environmental variability (Gaillard & Yoccoz 2003), but several studies 409
also showed that climatic variation, whether extreme or not, could reduce the adult survival of 410
long-lived species (e.g. (Sandvik et al. 2005). 411
412
Direct impact of winter ETCs versus indirect impact of their extremes on survival
413
Winter ETC activity can directly increase seabird mortality through different 414
mechanisms. They can disturb their feeding behaviour, which is sensitive to the occurrence of 415
stormy weather (e.g. (Finney et al. 1999). Common eiders are mostly visual feeders (Frimer 416
1994), so foraging can be affected by water turbidity associated with strong winds or sea-surface 417
conditions that reduce visual acuity (Eriksson 1985, Henkel 2006). Since ETC activity increases 418
winds, waves and current speed, it can also increase foraging costs for eiders. While common 419
eiders employ a variety of tactics to reduce energy costs during diving, descent duration and 420
number of strokes during descent increase exponentially with increasing current velocity, 421
suggesting an increase in the energetic costs of diving (Heath et al. 2006)Heath & Gilchrist 422
2010). During ETCs, fast currents, the strong increase in drag and energetic costs of diving make 423
even foraging unprofitable with net energy gain per dive cycle predicted to reach zero and 424
become unprofitable at 1.21 m s–1 at 11.3 m depth (Hawkins et al. 2000, Heath et al. 2006, 425
Heath & Gilchrist 2010). Common eiders stop foraging and rest well below this threshold (Heath 426
& Gilchrist 2010), which lowers their energetic gains (Dehnhard et al. 2013). Adding to the fact 427
that the winter period reduces the feeding window of these diurnal feeders (Systad et al. 2000, 428
Heath & Gilchrist 2010), winter ETC activity can potentially cause starvation because birds are 429
unable to forage efficiently (Chambers et al. 2011). 430
On the other hand, extreme ETCs may impact eider survival through indirect (lagged) 431
effects via the food chain. Different mechanisms can be hypothesized; extreme wind events 432
associated with extreme ETCs are an important natural disturbance in coastal systems 433
(Richardson & LeDrew 2006), decreasing the food availability of common eiders’ benthic prey. 434
Winter diet of common eiders includes different marine resources depending on their wintering 435
grounds: preferably small blue mussels of smaller sizes (Bustnes & Erikstad 1990, Varennes et 436
al. 2015) found near the shore, in kelp beds or rocky habitat in the Gulf of St. Lawrence 437
(Guillemette et al. 1992) or in northern Norway (Bustnes & Erikstad 1988), softshell clams Mya 438
eideri and marine polychaete worms found in soft sediments in southwest Greenland (Merkel et
439
al. 2007), gastropods in Newfoundland (Goudie & Ankney 1986), or sometimes crustaceans and 440
echinoderms. They can also include sea urchins found in shallow water near the shore (<10 m; 441
(Cottam 1939, Madsen 1954, Bustnes & Lønne 1997). Extreme cyclones can remove large 442
intertidal and subtidal areas rich in fauna and macroalgae (e.g. (Thomsen et al. 2004), destroy 443
bivalve beds at shallow depths (Reusch & Chapman 1995, Carrington 2002, Carrington et al. 444
2009) and directly decimate sea urchins and drive their community structure (Ebeling et al. 445
1985). In addition, winter ETCs can induce strong wave action, which lowers blue mussel 446
growth rates (Sukhotin et al. 2006), reduce primary productivity, lowering mussel growth rates to 447
taking 3-5 years to reach 1-2cm (Bustnes & Erikstad 1990, Varennes et al. 2015) if carried to the 448
extreme (Fujii & Yamanaka 2008), and act on intertidal gastropod populations via size-specific 449
mortality and indirectly affect them by altering their foraging behaviour, growth and life histories 450
(Brown & Quinn 1988). Also, oceanic volume fluxes are positively related to Nordic seas 451
cyclone activity (Sorteberg et al. 2005) providing transportation of blue mussel larvae over long 452
distances (Berge et al. 2005). As larvae settle when they reached a size between 0.026 - 453
0.035mm (Sprung 1984) and current velocity drives the settlement of marine polychaete worms 454
(Pawlik & Butman 1993), extreme winter ETC activity could decrease these species’ settlement 455
with higher velocity and thus decrease food availability for eiders in subsequent years. Hence, 456
extreme ETCs may have cascading effects on eider survival through a variety of specific 457
mechanisms. 458
459
Contrasted effect of winter ETC activity between and within eider populations: a “climatic
460
shelter” effect?
461
First, the strongest relation we detected was a direct and negative link (consistent with 462
our predictions) between the total number of all winter ETCs in southern Atlantic Canada and 463
the survival of eiders breeding in Canada. More precisely, this variable was only associated with 464
the survival of one group of birds (H2; 24% of individual capture histories), potentially those 465
migrating to the southern Atlantic Canada area. Secondly, the wind speed of the strongest 466
extreme winter ETCs impacted, with a time lag, the survival of eiders breeding and wintering in 467
northern Norway, and also, although less strongly, those breeding in Svalbard. Indirect effects of 468
the duration of extreme ETC activity in southwest Greenland were also detected on one group of 469
birds from Canada (H1; 76% of individual capture histories), potentially those wintering on the 470
southwest Greenland ground; indirect impacts of the same variable in Iceland was observed on 471
survival of eiders from Svalbard. 472
We propose that the detected inter- and intra-population heterogeneity, i.e. the direct 473
versus indirect impacts of winter ETC activity on survival described above, can be mostly 474
explained by variation in the natural “climatic shelters” on eider wintering grounds. We suggest 475
that direct effects can occur in the absence of shelter, whereas indirect effects likely occur via the 476
impact of ETC activity on prey availability. Shelter against wind can result in microclimate 477
effects and affect eider energetics during incubation (Høyvik Hilde et al. 2016). At a larger 478
spatial scale, areas providing natural shelter may drive the population response to extreme 479
environmental conditions through various mechanisms. The shelter effect of fjords on marine 480
wildlife has been proposed in the literature (see review by Howe et al. (2010)). Howe et al. 481
(2010) defined fjords as “inshore sheltered deep-water bodies, which often possess a unique 482
biogeochemistry, fauna, hydrography and sedimentation”. Fjord and channel systems in 483
Scandinavia, Iceland and Greenland form some of the largest estuarine areas in the world. Fjords 484
are used for spawning grounds, nursery, and recruitment areas by many marine fishes with 485
contrasting life histories, varying from mesopelagic (Lopes 1979) and pelagic (Brown 2002) to 486
demersal fishes (Boje 2002). Fjords are also used by marine mammals seeking refuge from 487
severe weather conditions (Sanino & Van Waerebeek 2008, Acevedo et al. 2017). 488
Female eiders wintering in southern Atlantic Canada feed along the sea ice edge (Goudie & 489
Ankney 1986) with potentially few climatic shelter areas. These individuals can thus be directly 490
exposed to harsh weather conditions and hence be directly impacted by winter ETCs (Figure 1). 491
In addition, sea ice formation covers shallow coastal waters, so wintering sea ducks are cut off 492
from their marine resources and lose potential feeding sources that could have compensated 493
losses of energy caused by low air temperature and foraging in deeper and agitated waters 494
(Vaitkus & Bubinas 2001). On the contrary, Canadian breeding eiders that winter in southwest 495
Greenland are likely less vulnerable to direct effects of ETC activity because they have access to 496
fjords extending deep inland (Ravn Merkel et al. 2002), which may provide shelters that are well 497
protected against extreme ETC winds. In addition, eiders from Svalbard or northern Norway 498
wintering along the Norwegian coast, although facing weaker winter ETC activity than in 499
Canada ( 500
Table 1), can feed along the shores of the fjords (Bustnes and Erikstad unpublished data), 501
which may also provide good climatic shelters and reduce the direct effects of ETC activity. 502
However, the effect of ETCs on benthic invertebrates in fjords or in exposed coastal areas 503
deserves further investigation to better understand the role of natural climatic shelters on the food 504
chain and on eider survival. 505
506 507
Effect of winter NAO and ETCs
508
The potential mechanisms involved in the relationships between eider survival, winter 509
NAO and local ETC activity were found to differ between populations. Winter ETCs appeared to 510
be one of the main drivers explaining the observed NAO effects on eider survival (Guéry et al. 511
2017) but only in the Canadian wintering population. In the Norwegian breeding population, we 512
found evidence that NAO and ETCs can have independent and cumulative influences. For eiders 513
breeding in the Canadian Arctic, the previously detected direct effect of the winter NAO might 514
be due, at least in part, to its relation with the number of ETCs in the southern Atlantic Canada. 515
Conversely, lagged winter NAO and lagged wind speed of the strongest ETC in northern 516
Norway seem to have independent and cumulative influences on survival of eiders breeding and 517
wintering in northern Norway, explaining together ca. 53% of the adult female eider survival. 518
The link between these two variables with oceanographic conditions in the North East Atlantic 519
could explain this cumulative effect. A low winter NAO with a lag of up to 3 years leads to an 520
increase in sea temperature and salinity in the sub-polar North Atlantic (Sarafanov 2009). This 521
increase in sea temperature and salinity may have in turn a negative impact on blue mussel larvae 522
and adult survival (Brenko & Calabrese 1969, Braby & Somero 2006, Menge et al. 2008), 523
adding to the negative effect of ETC activity on them. Further investigation is needed to better 524
understand these effects on annual eider survival. 525
Large-scale climate indices, such as the NAO, are often used as proxies of environmental 526
conditions as they integrate both temporal and spatial components of several weather variables 527
(Stenseth & Mysterud 2005). However, our study showed that local weather variables are 528
essential and complementary to sharpen our hypothesis on mechanisms when they can be 529
difficult to test in the wild. 530
531
Effect of extreme events on survival
532
While many studies focused on a single extreme climatic event (ECE), or one 533
characteristic of several ECEs (usually frequency), we have investigated several characteristics 534
of ECEs (frequency, duration and amplitude) over a long-term study. Interestingly, common 535
eider survival was affected by the amplitude and duration of ECEs but not by their frequency; 536
Canadian eider survival was not impacted by the number of extreme ETCs in southern Atlantic 537
Canada but the total number ETCs, whether extreme or not. We detected an effect of the 538
amplitude of ECEs in regions of relatively low ETC activity, while, we found an effect of the 539
duration in areas of intense ETC activity. This pattern probably stood out because the effect of 540
ECEs occurred mostly through the food web in our study systems, where long lasting or large 541
ECEs are more likely affecting the benthic ecosystems. Our results are noteworthy as population 542
models focusing on the impact of ECEs usually focus on their frequency (e.g. (Jenouvrier et al. 543
2015) rather than their duration or amplitude. Frequency, amplitude and duration of extreme 544
weather events are predicted to increase in most future climate scenarios (Rind et al. 1989, 545
Easterling et al. 2000), potentially impacting population persistence. 546
547
Conclusion
548
Even if adult survival of long-lived species should be buffered against environmental 549
variability (Gaillard & Yoccoz 2003), extreme weather conditions (such as extreme ETCs) 550
significantly affect adult survival during the wintering period and can have drastic effects on 551
population trends even with minimal reductions in survival. This is especially important in the 552
case of extreme weather events whose frequency, amplitude and duration are predicted to 553
increase in most future climate scenarios (Rind et al. 1989, Easterling et al. 2000), potentially 554
impacting population persistence. Several studies have reported changes in ETC activity at high 555
latitudes in the northern hemisphere (Bengtsson et al. 2009, Ulbrich et al. 2009). In terms of 556
future work, it might be interesting to consider the clustering of cyclones (Mailier et al. 2006), 557
i.e. where cyclones follow one another in a short period of time, to see whether wildlife species 558
are only affected by separate intense cyclones or also by a succession of ETCs. 559
Hence, to predict the effects of global change on wild populations, differences in 560
individual life-history strategies (e.g. migration strategies) must be taken into account as they 561
introduce inter- and intra-population heterogeneities in the response to climatic fluctuations. In 562
our case, an increase in winter ETC severity or frequency could directly affect only a segment of 563
the population depending on where birds winter, for example with or without access to climatic 564
shelter areas. Whatever the exact causes may be (e.g. wintering strategy, age…), intra-population 565
heterogeneities will impact population trajectories and viability, and should thus be incorporated 566
into population models (Coulson et al. 2001, Benton et al. 2006, Kendall et al. 2011). 567
Acknowledgements
568
We would like to thank all of the summer research assistants who worked at the three 569
research locations over the years, Isabel Buttler and Rob Kelly for data management of the 570
Canadian population and their valuable help at different stages of this study and Kimberly 571
Malcolm for her essential linguistic revision. The study in the Canadian Arctic (East Bay Island) 572
was supported by Environment Canada, Nunavut Wildlife Management Board, Greenland 573
Institute of Natural Resources, Polar Continental Shelf Project, Fonds Québécois de la Recherche 574
sur la Nature et les Technologies, Canadian Network of Centres of Excellence-ArcticNet, 575
Natural Sciences and Engineering Research Council of Canada, and the Department of Indian 576
Affairs and Northern Canada. The study in northern Norway was supported by the Norwegian 577
Research Council, Univ. of Tromsø, the Norwegian Institute for Nature Research, the Norwegian 578
Directorate for Nature Management and SEAPOP program (http://www.seapop.no). The study at 579
Prins Heinrich, Svalbard was supported by the Norwegian Polar Institute and program MOSJ 580
(www.mosj.no), and the eider geolocator study was supported by FRAM - High North Research 581
Centre for Climate and the Environment. The Canadian and Norwegian Councils on Animal 582
Care have approved this research. 583 584
References
585 586Acevedo J, Garthe S, González A (2017) First sighting of a live hourglass dolphin 587
(Lagenorhynchus cruciger) in inland waters of southern Chile. Polar Biology 40:483-486 588
Anker-Nilssen T, Bakken V, Strøm H, Golovkin AN, Bianki VV, Tatarinkova IP (2000) The 589
status of marine birds breeding in the Barents Sea region 590
Bengtsson L, Hodges KI, Keenlyside N (2009) Will extratropical storms intensify in a warmer 591
climate? Journal of Climate 22:2276-2301 592
Benton TG, Plaistow SJ, Coulson TN (2006) Complex population dynamics and complex 593
causation: devils, details and demography. Proc R Soc B 273:1173-1181 594
Berge J, Johnsen G, Nilsen F, Gulliksen B, Slagstad D (2005) Ocean temperature oscillations 595
enable reappearance of blue mussels Mytilus edulis in Svalbard after a 1000 year absence. 596
Boano G, Brichetti P, Foschi U (2010) ‘La Niña’-driven Atlantic storms affect winter survival of 597
Mediterranean Cory's Shearwaters. Italian Journal of Zoology 77:460-468 598
Boje J (2002) Intermingling and seasonal migrations of Greenland halibut (Reinhardtius 599
hippoglossoides) populations determined from tagging studies. Fishery Bulletin
100:414-600
422 601
Braby CE, Somero GN (2006) Following the heart: temperature and salinity effects on heart rate 602
in native and invasive species of blue mussels (genus Mytilus). J Exp Biol 209:2554-2566 603
Brenko MH, Calabrese A (1969) The combined effects of salinity and temperature on larvae of 604
the mussel Mytilus edulis. Marine Biology 4:224-226 605
Brown ED (2002) Life history, distribution, and size structure of Pacific capelin in Prince 606
William Sound and the northern Gulf of Alaska. ICES Journal of Marine Science 59:983-607
996 608
Brown KM, Quinn JF (1988) The effect of wave action on growth in three species of intertidal 609
gastropods. Oecologia 75:420-425 610
Burnham KP (1987) Design and analysis methods for fish survival experiments based on release-611
recapture. American Fisheries Society 612
Burnham KP, Anderson DR (2002) Model selection and multimodel inference: a practical 613
information-theoretic approach. Springer Verlag 614
Bustnes J, Erikstad K (1988) The diets of sympatric wintering populations of Common Eider 615
Somateria mollissima and King Eider S. spectabilis in Northern Norway. Ornis Fennica
616
65:163-168 617
Bustnes J, Erikstad K (1993) Site fidelity in breeding common eider Somateria molissima 618
females. Ornis Fennica 70:11-16 619
Bustnes JO, Erikstad KE (1990) Size selection of common mussels, Mytilus edulis, by common 620
eiders, Somateria mollissima: energy maximization or shell weight minimization? Can J 621
Zool 68:2280-2283 622
Bustnes JO, Lønne OJ (1997) Habitat partitioning among sympatric wintering common eiders 623
Somateria mollissima and king eiders Somateria spectabilis. Ibis 139:549-554
624
Calenge C (2006) The package “adehabitat” for the R software: a tool for the analysis of space 625
and habitat use by animals. Ecological modelling 197:516-519 626
Carrington E (2002) The ecomechanics of mussel attachment: from molecules to ecosystems. 627
Integrative and comparative biology 42:846-852 628
Carrington E, Moeser GM, Dimond J, Mello JJ, Boller ML (2009) Seasonal disturbance to 629
mussel beds: field test of a mechanistic model predicting wave dislodgment. Limnology 630
and Oceanography 54:978-986 631
Catto J Objective identification of warm seclusion cyclones and their distribution. Proc EGU 632
General Assembly Conference Abstracts 633
Chambers LE, Devney CA, Congdon BC, Dunlop N, Woehler EJ, Dann P (2011) Observed and 634
predicted effects of climate on Australian seabirds. Emu 111:235-251 635
Choquet R, Lebreton JD, Gimenez O, Reboulet AM, Pradel R (2009a) U‐CARE: Utilities for 636
performing goodness of fit tests and manipulating CApture–REcapture data. Ecography 637
32:1071-1074 638
Choquet R, Rouan L, Pradel R (2009b) Program E-SURGE: a software application for fitting 639
multievent models. Modeling demographic processes in marked populations:845-865 640
Cottam C (1939) Food habits of North American ducks. Technical Bulletin 643:1-129 641
Coulson T, Catchpole E, Albon S, Morgan B, Pemberton J, Clutton-Brock T, Crawley M, 642
Grenfell B (2001) Age, sex, density, winter weather, and population crashes in Soay 643
sheep. Science 292:1528-1531 644
Dee D, Balmaseda M, Balsamo G, Engelen R, Simmons A, Thépaut J-N (2014) Toward a 645
consistent reanalysis of the climate system. Bulletin of the American Meteorological 646
Society 95:1235-1248 647
Dehnhard N, Ludynia K, Poisbleau M, Demongin L, Quillfeldt P (2013) Good days, bad days: 648
wind as a driver of foraging success in a flightless seabird, the southern rockhopper 649
penguin. PloS one 8:e79487 650
Descamps S, Tarroux A, Lorentsen SH, Love OP, Varpe Ø, Yoccoz NG (2015) Large‐scale 651
oceanographic fluctuations drive Antarctic petrel survival and reproduction. Ecography 652
Descamps S, Yoccoz NG, Gaillard JM, Gilchrist HG, Erikstad KE, Hanssen SA, Cazelles B, 653
Forbes MR, Bety J (2010) Detecting population heterogeneity in effects of North Atlantic 654
Oscillations on seabird body condition: get into the rhythm. Oikos 119:1526-1536 655
Dunham AE, Erhart EM, Wright PC (2011) Global climate cycles and cyclones: consequences 656
for rainfall patterns and lemur reproduction in southeastern Madagascar. Global Change 657
Biology 17:219-227 658
Easterling MR, Ellner SP, Dixon PM (2000) Size-specific sensitivity: applying a new structured 659
population model. Ecology 81:694-708 660
Ebeling A, Laur D, Rowley R (1985) Severe storm disturbances and reversal of community 661
structure in a southern California kelp forest. Marine Biology 84:287-294 662
Eriksson MO (1985) Prey detectability for fish-eating birds in relation to fish density and water 663
transparency. Ornis Scandinavica:1-7 664
Finney SK, Wanless S, Harris MP (1999) The effect of weather conditions on the feeding 665
behaviour of a diving bird, the Common Guillemot Uria aalge. Journal of Avian 666
Biology:23-30 667
Frimer O (1994) The behaviour of moulting King Eiders Somateria spectabilis. Wildfowl 668
45:176-187 669
Fujii M, Yamanaka Y (2008) Effects of storms on primary productivity and air-sea CO2 670
exchange in the subarctic western North Pacific: a modeling study. Biogeosciences 671
5:1189-1197 672
Gaillard JM, Yoccoz NG (2003) Temporal variation in survival of mammals: a case of 673
environmental canalization? Ecology 84:3294-3306 674
Genovart M, Sanz‐Aguilar A, Fernández‐Chacón A, Igual JM, Pradel R, Forero MG, Oro D 675
(2013) Contrasting effects of climatic variability on the demography of a trans‐equatorial 676
migratory seabird. Journal of Animal Ecology 82:121-130 677
Goudie R, Ankney C (1986) Body size, activity budgets, and diets of sea ducks wintering in 678
Newfoundland. Ecology 67:1475-1482 679
Grosbois V, Gimenez O, Gaillard JM, Pradel R, Barbraud C, Clobert J, Møller A, Weimerskirch 680
H (2008) Assessing the impact of climate variation on survival in vertebrate populations. 681
Biological Reviews 83:357-399 682
Grosbois V, Thompson PM (2005) North Atlantic climate variation influences survival in adult 683
fulmars. Oikos 109:273-290 684
Guéry L, Descamps S, Pradel R, Hanssen SA, Erikstad KE, Gabrielsen GW, Gilchrist HG, Bêty 685
J (2017) Hidden survival heterogeneity of three Common eider populations in response to 686
climate fluctuations. Journal of Animal Ecology 86:683-693 687
Guillemette M, Ydenberg RC, Himmelman JH (1992) The role of energy intake rate in prey and 688
habitat selection of common eiders Somateria mollissima in winter: a risk-sensitive 689
interpretation. Journal of Animal Ecology:599-610 690
Hario M, Mazerolle MJ, Saurola P (2009) Survival of female common eiders Somateria m. 691
mollissima in a declining population of the northern Baltic Sea. Oecologia 159:747-756
692
Harris MP, Anker-Nilssen T, McCleery RH, Erikstad KE, Shaw DN, Grosbois V (2005) Effect 693
of wintering area and climate on the survival of adult Atlantic puffins Fratercula arctica 694
in the eastern Atlantic. Marine Ecology Progress Series 297 695
Hawkins P, Butler P, Woakes A, Speakman J (2000) Estimation of the rate of oxygen 696
consumption of the common eider duck (Somateria mollissima), with some 697
measurements of heart rate during voluntary dives. J Exp Biol 203:2819 698
Heath JP, Gilchrist HG (2010) When foraging becomes unprofitable: energetics of diving in tidal 699
currents by common eiders wintering in the Arctic. Marine Ecology Progress Series 700
403:279-290 701
Heath JP, Gilchrist HG, Ydenberg RC (2006) Regulation of stroke pattern and swim speed 702
across a range of current velocities: diving by common eiders wintering in polynyas in 703
the Canadian Arctic. J Exp Biol 209:3974-3983 704
Henkel LA (2006) Effect of water clarity on the distribution of marine birds in nearshore waters 705
of Monterey Bay, California. Journal of Field Ornithology 77:151-156 706
Hodges KI (1994) A general method for tracking analysis and its application to meteorological 707
data. Monthly Weather Review 122:2573-2586 708
Hoskins BJ, Hodges KI (2002) New perspectives on the Northern Hemisphere winter storm 709
tracks. Journal of the Atmospheric Sciences 59:1041-1061 710
Howe JA, Austin WE, Forwick M, Paetzel M, Harland R, Cage AG (2010) Fjord systems and 711
archives: a review. Geological Society, London, Special Publications 344:5-15 712
Høyvik Hilde C, Pélabon C, Guéry L, Gabrielsen GW, Descamps S (2016) Mind the wind: 713
microclimate effects on incubation effort of an arctic seabird. Ecology and evolution 714
6:1914-1921 715
Hurrell JW, Kushnir Y, Ottersen G, Visbeck M (2003) An overview of the North Atlantic 716
oscillation. Wiley Online Library 717
Jenouvrier S (2013) Impacts of climate change on avian populations. Global Change Biology 718
19:2036-2057 719
Jenouvrier S, Caswell H, Barbraud C, Holland M, Strœve J, Weimerskirch H (2009) 720
Demographic models and IPCC climate projections predict the decline of an emperor 721
penguin population. Proceedings of the National Academy of Sciences 106:1844 722
Jenouvrier S, Péron C, Weimerskirch H (2015) Extreme climate events and individual 723
heterogeneity shape life‐history traits and population dynamics. Ecological Monographs 724
85:605-624 725
Jones SC, Harr PA, Abraham J, Bosart LF, Bowyer PJ, Evans JL, Hanley DE, Hanstrum BN, 726
Hart RE, Lalaurette F (2003) The extratropical transition of tropical cyclones: Forecast 727
challenges, current understanding, and future directions. Weather and Forecasting 728
18:1052-1092 729
Kendall BE, Fox GA, Fujiwara M, Nogeire TM (2011) Demographic heterogeneity, cohort 730
selection, and population growth. Ecology 92:1985-1993 731
Lopes PdC (1979) Eggs and larvae of Maurolicus muelleri (Gonostomatidae) and other fish eggs 732
and larvae from two fjords in western Norway. Sarsia 64:199-210 733
Madsen FJ (1954) On the food habits of the diving ducks in Denmark 734
Mailier PJ, Stephenson DB, Ferro CA, Hodges KI (2006) Serial clustering of extratropical 735
cyclones. Monthly weather review 134:2224-2240 736
Menge BA, Chan F, Lubchenco J (2008) Response of a rocky intertidal ecosystem engineer and 737
community dominant to climate change. Ecology Letters 11:151-162 738
Merkel FR, Jamieson SE, Falk K, Mosbech A (2007) The diet of common eiders wintering in 739
Nuuk, Southwest Greenland. Polar Biology 30:227-234 740
Mosbech A, Gilchrist G, Merkel F, Sonne C, Flagstad A, Nyegaard H (2006) Year-round 741
movements of Northern Common Eiders Somateria mollissima borealis breeding in 742
Arctic Canada and West Greenland followed by satellite telemetry. Ardea 94:651-665 743
Newton I (2007) Weather‐related mass‐mortality events in migrants. Ibis 149:453-467 744
Pawlik JR, Butman CA (1993) Settlement of a marine tube worm as a function of current 745
velocity: Interacting effects of hydrodynamics and behavior1. Limnology and 746
Oceanography 38:1730-1740 747
Pike DA, Stiner JC (2007) Sea turtle species vary in their susceptibility to tropical cyclones. 748
Oecologia 153:471-478 749
Ravn Merkel F, Mosbech A, Boertmann D, Grøndahl L (2002) Winter seabird distribution and 750
abundance off south-western Greenland, 1999. Polar Research 21:17-36 751
Raynor EJ, Pierce AR, Owen TM, Leumas CM, Rohwer FC (2013) Short-term demographic 752
responses of a coastal waterbird community after two major hurricanes. Waterbirds 753
36:88-93 754
Reusch TBH, Chapman ARO (1995) Storm effects on eelgrass (Zostera marina L.) and blue 755
mussel (Mytilus edulis L.) beds. Journal of experimental marine biology and ecology 756
192:257-271 757
Reyer CP, Leuzinger S, Rammig A, Wolf A, Bartholomeus RP, Bonfante A, de Lorenzi F, Dury 758
M, Gloning P, Abou Jaoudé R (2013) A plant's perspective of extremes: terrestrial plant 759
responses to changing climatic variability. Global change biology 19:75-89 760
Richardson LL, LeDrew EF (2006) Remote sensing of aquatic coastal ecosystem processes. 761
Springer 762
Rind D, Goldberg R, Ruedy R (1989) Change in climate variability in the 21st century. Climatic 763
change 14:5-37 764
Roberts J, Champion A, Dawkins L, Hodges K, Shaffrey L, Stephenson D, Stringer M, Thornton 765
H, Youngman B (2014) The XWS open access catalogue of extreme European 766
windstorms from 1979 to 2012. 767
Sæther BE, Tufto J, Engen S, Jerstad K, Røstad O, Skåtan J (2000) Population dynamical 768
consequences of climate change for a small temperate songbird. Science 287:854 769
Sandvik H, Erikstad KE, Barrett RT, Yoccoz NG (2005) The effect of climate on adult survival 770
in five species of North Atlantic seabirds. Journal of Animal Ecology 74:817-831 771
Sanino GP, Van Waerebeek K (2008) A note on the southern distribution range of inshore and 772
offshore common bottlenose dolphins Tursiops truncatus in the Southeast Pacific. Final 773
report. IWC SC/60/SM18 774
Sarafanov A (2009) On the effect of the North Atlantic Oscillation on temperature and salinity of 775
the subpolar North Atlantic intermediate and deep waters. ICES Journal of Marine 776
Science: Journal du Conseil 66:1448-1454 777
Sorteberg A, Kvamstø NG, Byrkjedal Ø (2005) Wintertime nordic seas cyclone variability and 778
its impact on oceanic volume transports into the Nordic Seas. The Nordic Seas: An 779
integrated Perspective:137-156 780
Sprung M (1984) Physiological energetics of mussel larvae(Mytilus edulis). I. Shell growth and 781
biomass. Marine ecology progress series Oldendorf 17:283-293 782