HAL Id: hal-01461098
https://hal.archives-ouvertes.fr/hal-01461098
Submitted on 4 Jun 2020
HAL is a multi-disciplinary open access
archive for the deposit and dissemination of
sci-entific research documents, whether they are
pub-lished or not. The documents may come from
teaching and research institutions in France or
abroad, or from public or private research centers.
L’archive ouverte pluridisciplinaire HAL, est
destinée au dépôt et à la diffusion de documents
scientifiques de niveau recherche, publiés ou non,
émanant des établissements d’enseignement et de
recherche français ou étrangers, des laboratoires
publics ou privés.
A multi-modelling approach to help agricultural
stakeholders design animal wastes management
strategies in the Reunion Island
Jean-Michel Medoc, Francois Guerrin, Rémy Courdier, Jean-Marie Paillat
To cite this version:
Jean-Michel Medoc, Francois Guerrin, Rémy Courdier, Jean-Marie Paillat. A multi-modelling
ap-proach to help agricultural stakeholders design animal wastes management strategies in the Reunion
Island. 2. Biennial Meeting of the International Environmental Modelling and Software Society, Jun
2004, Osnabrück, Germany. 528 p. �hal-01461098�
A Multi-Modelling Approach to Help Agricultural
Stakeholders Design Animal Wastes Management
Strategies in the Reunion Island
Jean-Michel Médoc1, François Guerrin1, Rémy Courdier2 and Jean-Marie Paillat3
1
Cirad-Tera, Gdor Team, Saint-Denis, La Réunion, France (medoc@cirad.fr) 2 University of La Réunion, Iremia, Saint-Denis, La Réunion, France
3Cirad-Tera/Inra-EA, Umr Sas, Rennes, France
Abstract: Recent concentration of indoor livestock farming in the Highlands of the Reunion Island generates
environmental risks. Livestock effluent management is often difficult due to the lack of suitable spreading areas close to the farms. However, crop farms in the Lowlands are demanding organic matter to maintain soil fertility. This is the case of the locality of Grand-Ilet where pig and poultry effluents are intensively produced that should be exported towards the coastal zone where large areas of sugar-cane are available. This paper presents how we are supporting Grand-Ilet stakeholders to devise territorial management strategies of their wastes. To this end, a stepwise approach is being tested. First, the supply of animal wastes and the manage-ment by farmers are characterized through farm surveys and agronomic expertise. Then, the crop demand is determined by using a GIS considering a large zone surrounding Grand-Ilet onto which several constraints are applied to eliminate unsuitable spreading areas. Comparing supply and demand enables one to draw gen-eral conclusions about the strategic choices to be considered. In the case of Grand-Ilet, distances between livestock farms and crop locations, and amounts of liquid manure to be processed, led one to consider im-plementing a treatment plant collectively managed by farmers. To devise sustainable management strategies for such a trade-off, we are developing a participatory approach based on several simulation models (spread-sheet, hybrid dynamical system, agent-based). These models, developed in our team, aim at tackling several decision-making issues: (i) Which treatment process should be chosen? (ii) How to supply it with raw wastes? (iii) How to best organise organic material fluxes amongst farms at the district level? Together with the description of those tools, each step of the approach is exemplified and the way of integrating the use of simulation models within the stakeholders’ decision process is outlined.
Keywords: Animal waste management; Simulation models; Decision support; Reunion Island.
1 INTRODUCTION
The development of livestock farms in the 1980’s (pig, poultry, cattle) in the Highlands of the Reun-ion Island was aimed at increasing the food self-sufficiency and maintaining people in difficult rural zones. Despite of its success, this policy has led to a significant concentration of effluent in these areas, particularly pig slurry. Because of the lack of suitable spreading areas, the risks of pollu-tion are high. In 2001, the annual pig slurry pro-duction in Reunion was estimated at 162 060 m3, i.e., 678 tons N. We focus here on the case of
Grand-Ilet, a small locality in the cirque of Salazie
in the north-eastern part of the island, which pro-duces more than 15% of local pork meat. No suit-able spreading areas and difficult access make this locality the most critical in environmental terms as it generates large surpluses of animal wastes.
Cur-rently, the State policy wants the stockbreeders to put their enterprises at the standards and to trans-form their effluents, particularly pig slurry, to comply with regulatory constraints.
Our aim is to support Grand-Ilet stakeholders to design territorial management strategies of their wastes. First, we assessed the livestock effluent production, and the nutrient demand by crops was determined by using a GIS, considering a large zone surrounding Grand-Ilet onto which several constraints were applied to eliminate unsuitable spreading areas. In order to help Grand-Ilet stake-holders to define reliable management options, we planned using several models devised for different tasks [Guerrin and Paillat, 2003a]: (i) the Macsizut model for evaluating and choosing slurry treatment processes, (ii) the Approzut model for testing vari-ous supply policies of slurry treatment plants and (iii) the Biomas model for simulating effluent
transfers between distinct farms and evaluating the interest of collective treatment units. After present-ing how we assessed supply and demand of efflu-ents and describing the models, the paper ends with a discussion about how we are intervening in Grand-Ilet stakeholders’ decision process.
2 SUPPLY OF LIVESTOCK EFFLUENTS
There are about 70 pig farmers in Grand-Ilet hold-ing small enterprises (< 50 sows) among which two-thirds have also poultry or cattle (< 5 LU1). In 1998, these farms added up to 848 breeding sows and 11 000 m² of livestock buildings annually producing 17 000 m3 of pig slurry2, 3 300 tons of poultry manure and 2 700 m3 of hen slurry [Ren-ault and Paillat, 1999]. To date the pig and poultry herds are evaluated to 2 050 LU and other live-stocks (cattle, sheep, rabbit…) to 170 LU. In front of this animal production, 186 ha of agricultural land only are available (75 ha as cultivated crops and 112 ha as fallow land). Hence, the global N application rate is about 871 kgha-1year-1 or, con-sidering only the crops that can be fertilized by raw wastes (fodder, fruit crops), 2 160 kgN ha-1year-1. This represents 6 times the maximum amount authorized for fodder and 11 times for fruit crops. Moreover, many crop plots are unsuitable for slurry spreading because of incompatibility with market gardening, strong slopes, proximity of dwellings and rivers. The sugar-cane irrigation project in Western Reunion finds part of its re-source in the Fleurs Jaunes stream down by Grand-Ilet. In order to preserve this resource from pollution by nitrates, the agricultural authorities summoned the farmers to standardize their enter-prises according to livestock buildings and envi-ronmental specifications. From now, maintaining livestock farming in Grand-Ilet is strongly depend-ent upon the implemdepend-entation of an efficidepend-ent man-agement strategy of animal wastes. Since 2002, Grand-Ilet farmers are trying to devise a strategy considering tradeoffs like exporting the total amount of slurry, either raw or transformed, to-wards the coastal zone. This requires to better know potential consumption areas and to assess their demand in terms of quality and quantity of organic material (OM).
3 DEMAND OF OM BY CROPS
The OM demand by crops was estimated for a large zone of 46 290 ha of which agricultural lands
1 LU: livestock units.
2 However, a census made by the agricultural authorities in 2003 consider a pig slurry production of about 22 000 m3year-1.
cover 12 400 ha. Within this zone we considered the 21 districts, including Grand-Ilet, used for agricultural censuses and statistics purposes. First, we identified the spatial distribution of the main crops: sugar-cane, fruit and banana crops. Then, after a review of data on NPK supply by the soil, we drew up the crop requirements in nitrogen fertilization (both organic and mineral) according to the nature of each plot’s crop and its average output. We also evaluated the amount of livestock effluent specifically produced in each district. All these data were stored into the MapInfo GIS. Ap-plying the French spreading regulations, we high-lighted the suitable areas for spreading liquid and solid effluents. Finally, by merging the crop re-quirements and their spatial distribution, the GIS delivers for each plot the quantity of organic and mineral fertilizers that could be applied. Applying regulatory constraints thus exhibits three spreading categories for land:
- 3 197 ha can receive both liquid and solid ma-nure (25% of agricultural land);
- 7 076 ha can receive only solid manure (58% of agricultural land);
- 36 017 ha are not suitable for spreading (of which 2 119 ha of agricultural land, i.e. 17%). Transferring livestock effluents from Grand-Ilet can be envisaged if the authorized spreading area of the coastal zone is not saturated by other sources. For each type of effluent (liquid or solid) we calculated the balance between supply and demand of N at the district scale. A negative bal-ance denotes a deficit of OM to fertilize the crops, a positive balance surpluses that need be exported. For liquid effluents, the balance is highly positive for all the districts. This highlights the fact that the suitable area for liquid manure is too cramped to absorb all the slurry produced in the zone and, thus, does not allow a transfer of raw slurry from Grand-Ilet. Conversely, the solid manure produced in the zone does not saturate the area (Figure 1).
Sainte-Suzanne Bras-Panon Saint-Benoît Salazie Grand-Ilet Hell- Bourg Sainte-Suzanne Bras-Panon Saint-Benoît Salazie Grand-Ilet Hell- Bourg
Figure 1. Nitrogen balance for solid effluent in
The current surpluses for the zone, located in the districts of Grand-Ilet and Hell-Bourg, amount up to 75 tons N whereas the potential demand is 101 tons N. This shows that an additional amount of 26 tons N of solid effluent could be spread over the zone. Thus, a pig slurry treatment plant possibly implemented in Grand-Ilet could reasonably export at most this quantity as solid organic matter.
4 CHOOSING SLURRY TREATMENT
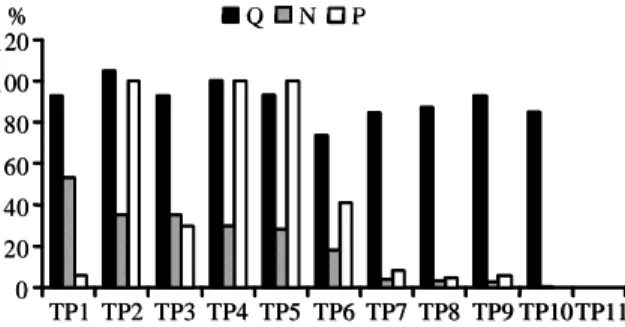
Macsizut is a spreadsheet model devised to calcu-late matter balances and assess investment and running costs of pig slurry treatment plants [Guer-rin and Paillat, 2003b]. Given the situation in Grand-Ilet and taking into account farmers’ wishes, the goal of treatment should be to produce easily transferable solid products (composts, fertil-izers) with sufficient nutrient content to give them a commercial value and a liquid phase treated enough to be directly disposed in the environment. Figure 2 shows the characteristics of the liquid phase issued from the treatment of the pig slurry produced in Grand-Ilet according to various treat-ment processes (TP; see appendix).
0 20 40 60 80 100 120 TP1 TP2 TP3 TP4 TP5 TP6 TP7 TP8 TP9 TP10 TP11 Q N P % 0 20 40 60 80 100 120 TP1 TP2 TP3 TP4 TP5 TP6 TP7 TP8 TP9 TP10 TP11 Q N P %
Figure 2. Quantity (Q) and quality (N, P) of liquid
effluents according to various treatment processes (TP) as % of initial slurry.
Putting aside TP11 (i.e. composting, which gener-ates no liquids), the liquid phase to manage after treatment is between 75-100% of the input slurry with N and P contents respectively ranging within 0-53% and 0-41%. Whereas TPs 2, 4 and 5 have no efficiency for P removal, TPs 7-10 are rather efficient in terms of N and P abatement. Of these four processes, TP10 only allows the liquid phase to be directly released in the environment because its residual NP content is null. The other three processes (TPs 1, 3 and 6), due to relatively high NP contents in the liquid phase, would necessitate crop irrigation to be disposed off.
From an economic viewpoint, Figure 3 compares the treatment costs of Grand-Ilet pig slurry accord-ing to the TPs. They vary between 11 and 32 € per m3 of processed slurry. In the case of TP10, energy cost (8 €m-3 vs. 1 to 4 €m-3 for the other processes) increases the total cost of treatment (32 €m-3).
0 5 10 15 20 25 30 35 TP4 TP5 TP8 TP7 TP3 TP6 TP1 TP2 TP11 TP9 TP10
€.m-3 Investment Running cost
0 5 10 15 20 25 30 35 TP4 TP5 TP8 TP7 TP3 TP6 TP1 TP2 TP11 TP9 TP10
€.m-3 Investment Running cost
Figure 3. Investment and running costs for pig
slurry treatment in Grand-Ilet.
According to these results, the stakeholders hesi-tated between TP10 (best treatment efficiency despite of a high cost) and TP8 (reasonable cost/efficiency compromise). They finally adopted TP8 to undertake feasibility studies.
5 TESTING SUPPLY POLICIES OF A TP
Our aim is to coordinate the deliveries made by various farms producing pig slurry at different rates so that the TP be adequately supplied and no stock overflows occur. For this, we need to im-plement policies capable of regulating the stocks. These policies must address the basic questions in stock management: Who should supply? How much? When? To answer these questions, we may use a simulation approach that we intend to test on the case of Grand-Ilet. We illustrate here the ap-proach by defining three tentative policies: - A Rigid policy, so that a delivery plan is
im-posed on the farmers that must deliver fixed quotas all on the same date.
- A Flexible policy, so that multiple deliveries are possible for a single quota and delivery dates are not the same for all the farmers. - A Free policy, so that, at any instant, farmers
may independently initiate multiple deliveries of their quota.
The Approzut model [Guerrin and Ranaivosolo, 2001] enables one to simulate such policies and optimise the control parameters to achieve our aims. The system is modelled as a set of farm stocks connected to a single TP stock. Each farm stock is supplied by its own animal waste produc-tion and emptied (i) by the export to the TP and (ii) by possible overflows. Integrating the difference between inflow and outflows over time gives the evolution of the stock level. Similarly, the TP is modelled as a stock with inflow (sum of exports from the farms delayed by transportation time) and outflows, the rate at which the treatment process consumes the stored slurry and stock overflows.
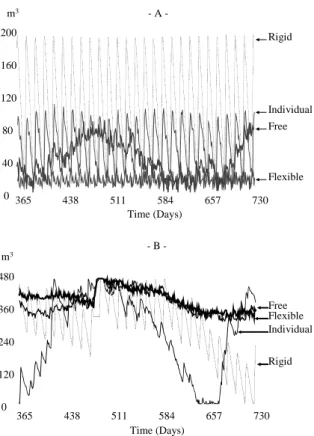
Taking as main input the delivery period (i.e., time lapse during which at least one delivery is made) determined according to the policy to be simulated, the model calculates for each farmer a delivery quota equal to the quantity of slurry produced during this period. A “clock” function is then used to determine the exact delivery dates within each period. To take into account possible risks, random functions are used to introduce noise on both the amount of slurry delivered to the TP and its con-sumption rate. In the Free scenario, a random func-tion is also used, in addifunc-tion, to simulate arbitrary choices made by each farmer on their own delivery periods. In order to detect possible long-term ef-fects, simulations are performed over 10 years. First, simulating the system without introducing noise shows that no stock overflow occurs for neither simulated scenario. For the TP, it appears that the Flexible and Free scenarios better regulate the stock than the Rigid one (Figure 4A). Note that, as all the deliveries are concentrated in time, the Rigid scenario exhibits wider and sharper fluc-tuations than others where deliveries can be made at different dates. 200 160 120 80 40 0 365 438 511 584 657 730 Time (Days) Rigid Free Flexible Individual m3 A -480 360 240 120 0 365 438 511 584 657 730 Time (Days) Rigid Flexible Individual Free m3 B
-Figure 4. Evolutions of the TP stock without (A)
or with (B) random noise for the three basic sce-narios plus an “Individual” new scenario. With farmers’ perspective, the result is more var-ied: for one farm the Free scenario should be pre-ferred, for two the Rigid scenario gave best results while the Flexible was best for the other two. To reconcile both individual and collective
view-points, a simulation based on the best-fitted policy for each farmer gave a very acceptable result for the TP (“Individual” scenario; Figure 4A).
Whenever noise is introduced, the results are quite different (Figure 4B). The stocks are not as well regulated and overflows occur both at the TP (for an average of 150-200 m3 per year), but also to a lesser extent at some farmers’. However, a similar conclusion is drawn: the Flexible scenario is best fitted with the TP dynamics whereas, from an individual point of view, it would be necessary to apply individual scenarios for each farmer. But in that case, this solution has a catastrophic effect on the TP: there is a very large overflow (275 m3year-1 in average) and the stock levels fluctuate widely between excess and shortage (Figure 4B). Starting from the Flexible scenario (with noise for greater realism) with an optimisation procedure minimising stock overflows, we can devise a new solution. Compared with the ‘regular’ Flexible scenario this scenario has the following features: farmers may triple the amount to be delivered if they can, the TP consumption rate is doubled, and feed-back control is introduced to prevent all de-liveries from farmers when the TP stock is nearly full (e.g. 90% of maximum capacity). This opti-mised solution (close to ‘just-in-time’ policies) provides us with the following benefits (Figure 5): - No stock overflows;
- All stock levels are minimised except for short periods, due to random interruptions in the consumption of the TP (see the plateau on fig-ure 5) which impose to stop farmers' deliveries; - Storage capacities can be reduced by 67% for the farmers and 90% for the TP (see figure 5). This solution is likely to provide economical gains and fits our management goals.
40 30 20 10 0 365 438 511 584 657 730 Time (Days) m3
Figure 5. Evolution of the TP stock in the
opti-mised Flexible scenario with random noise. This example illustrates how such a simulation approach may enable new solutions to be derived from experimenting with preconceived policies, in a way that may be crucial to support the decision process of stakeholders. This is performed, here, by highlighting the importance of accounting for
risk in the system’s operation and introducing some feedback mechanism to improve the sys-tem’s robustness.
6 SIMULATING EFFLUENT TRANSFERS AT A TERRITORIAL SCALE
Here, our aim is to simulate possible transfers of organic material between farms and test organiza-tional alternatives open to agricultural stakeholders at a territorial scale. For this, we devised a multi-agents system, called Biomas, developed as an application layer of a simulation platform called Geamas [Courdier et al., 2002]. In Biomas, a terri-tory is viewed in regard to waste management. It is composed of several livestock farms, crops, treat-ment plants, transportation and storage facilities. Livestock farms create a supply of OM and crop farms create a demand that may be met subject to quality, quantity and availability conditions of OM. The process enabling the matching of supply and demand is called a negotiation. Any negotia-tion can be initiated either by supplier or client-user. It may result into a transfer of organic mate-rial from the place of storage (livestock buildings) to the place of use (crop plots) if and only if a suitable shipper can be found.
Three abstraction levels are implemented in Bio-mas: micro-level describing atomic agents; me-dium-level describing intermediate structures of organisation; macro-level describing the whole system.
At the micro-level two types of agents are differen-tiated. The first is composed of the Farmer agents who possess the capacity of negotiation. Their function is defined by the composition of roles of OM producer, consumer, and shipper. Acquaint-anceship networks determining potential ways of transfer may link them. The second type is made of physical entities like Crop, Livestock, Type of shipping, Storage facilities, Treatment plants. These agents are subordinated to the Farmer agents to transmit an alarm, respond to inquiries, and execute actions. Satisfaction degrees are defined for Crop and Livestock agents and come into play as criteria in the conclusion of a negotiation be-tween Farmer agents: the satisfaction of a Live-stock agent resides in its capacity to export its OM stock when a given threshold is reached; the satis-faction of a crop is to cover its needs in OM speci-fied by three attributes: nature of acceptable OM, quantity to be applied and period of application. The TPs are represented as mass balance models describing, for each type of treatment process, the outflows of the different products in relation to the inflows of untreated OM. These physical agents are represented in space by ‘situated objects’ char-acterized by their position relative to some map.
This enables OM surpluses or deficits to be spa-tially located and distances separating Crops from Livestock to be accounted for in farmers’ negotia-tions.
At the medium level, are specified the Group agents, representing collective management struc-tures like farmer associations aimed at treating animal wastes. Each farmer can belong to one or several groups. A group can impose constraints upon its members (e.g., delivery of specified quo-tas of OM to the TP it manages).
We are intending to use Biomas to evaluate the flux of OM produced in Grand-Ilet in anticipation of the creation of the collective TP and test some management parameters (treatment process, sup-ply, product destination). Such simulated scenarios may involve several hundred interacting “cogni-tive” agents (i.e. with reasoning abilities) repre-senting the entities interacting within the system.
7 SUPPORTING STAKEHOLDERS
Our goal is to support Grand-Ilet stakeholders to devise sustainable management strategies of their wastes based on the use of simulation models. The main issue is: How?
First, an organisation framework with three levels (action, coordination, decision) was set up to gather the various stakeholders concerned by the issue of pig slurry treatment.
At the first level, four action groups (AG) were organized to discuss and elaborate tentative solu-tions on specific topics: implementation of the treatment plant, process choice and management, legal status of the organisation and administration, biogas unit to be coupled to waste treatment. These action groups gather farmers, agricultural advisers and representatives of farm cooperatives, agricul-tural services, city council and, when needed, any kind of experts. The main results issued from the groups are presented to other participants via the coordination group. The decision committee, gath-ering farmers, cooperatives and private investors representatives, endorses all the final decisions. It is within the AG2 that simulation models are being used and discussed. To date, our intervention was about the choice of a treatment process for pig slurry using the Macsizut model. A first simulation was carried out to launch the decision process, comparing all the TPs on criteria of efficiency and costs, whose outputs (diagrams in Figures 2 and 3) were discussed among the stakeholders. This re-sulted in a first shortlist (TPs 7-10). Then, a study trip in French Brittany (where the environmental impact of pig farming is very critical) was organ-ized with some pig farmers and their technical advisers. This trip allowed the participants to meet institution representatives, engineers,
manufactur-ers and farmmanufactur-ers experienced in pig slurry treatment and to get elements of method to apprehend glob-ally the multiple aspects of their project: choice of a TP, supply and management modes, destination of output products, organisation rules, etc. Finally, the choice of TP8 was made after retrospective discussions about the trip among all the farmers of Grand-Ilet, based on slide presentations of the visits and detailed cost analysis of each process. Concerning the use of the Approzut and Biomas models (that have not yet been used with the stakeholders) we intend to follow an iterative loop: 1. Test the models on generic farm types [Guerrin and Paillat, 2003b] representing the full range of OM management situations found in Grand-Ilet and devise tentative management strategies to be discussed with the stakeholders in order to build a common representation of the main issues to be dealt with.
2. Run the models on real situations and discuss the simulation outputs with the stakeholders to make operational decisions.
3. If necessary, adapt the models to fit them with unexpected situations or specific stakeholders’ demands.
4. Return to steps 1 or 2.
This iterative approach based on frequent ex-changes between the model development and its use is a central point of our methodology [Courdier et al., 1998].
8 CONCLUSIONS
The originality of this (still ongoing) project lies in the use of multiple simulation models devised to deal with complementary aspects of a complex problem. These models enable one to test animal waste management strategies at a territorial scale with agricultural stakeholders of different types (farmers, technical advisers, policy makers and researchers). If decision-making is obviously one of the main goals, models by themselves are not conceived to prescribe decisions. They rather are intended to be used as tools to explore, test, and iteratively devise management strategies. In keep-ing with other approaches (e.g. the Farmscape project by CSIRO in Australia), model usefulness is expected in fostering discussion and learning among stakeholders [McCown, 2002]. Model validation is thus conceived as checking stake-holders’ satisfaction in using models, directly or indirectly, rather than mimicking the ‘real’ behav-iour of some sets of variables. The open issue is to assess the place models should take in stake-holders’ decision processes. This is our main re-search goal to be achieved with Grand-Ilet stake-holders.
9 REFERENCES
Courdier, R., F. Guerrin, F. H. Andriamasinoro, J.-M. Paillat, Agent-based simulation of com-plex systems: application to collective man-agement of animal wastes, Journal of
Arti-ficial Societies and Social Simulation, 5(3),
2002.
Courdier R., P. Marcenac, S. Giroux, Un processus de développement en spirale pour la simu-lation multi-agents, Revue L'Objet, 4(1), 73-86, 1998.
Guerrin, F., P.W. Ranaivosolo, Managing the supply of a slurry treatment plant by means of a hybrid dynamical system, paper pre-sented at the 2nd IFAC-CIGR Workshop on Intelligent Control for Agricultural Appli-cations, Bali, Indonesia, August 22-24, 2001.
Guerrin, F., J.-M. Paillat, Modelling biomass fluxes and fertility transfers: animal wastes management in Reunion Island, paper pre-sented at Modsim 2003, International Con-gress on Modelling and Simulation, Towns-ville, Australia, July 14-17, 2003a.
Guerrin, F., J.-M. Paillat (Eds.), Modélisation des flux de biomasse et des transferts de fertilité - Cas de la gestion des effluents d'élevage à l'île de la Réunion. Séminaire Cirad, Mont-pellier, France, CD-rom, 2003b.
Mc Cown, R.L., Changing systems for supporting farmers’ decisions: problems, paradigms and prospects, Agricultural Systems, 74 (1), 179-220, 2002.
Renault, D., J.-M. Paillat, Analyse de la production et de l’utilisation des effluents porcins à Grand-Ilet, localité de l’île de La Réunion (cirque de Salazie). Cirad-Tera Tech. Re-port #16/99, Réunion, 1999.
10 APPENDIX: PIG SLURRY TREAT-MENT PROCESSES
TP1: coagulation, flocculation, pressing to concen-trate N and P in a solid filconcen-trate.
TP2: centrifugation, N concentration by stripping and acid washing.
TP3: centrifugation, N catalytic combustion. TP4: NDN (= nitrification-denitrification). TP5: coagulation, filtration, NDN. TP6: filtration on straw, NDN. TP7: filtration, NDN on biofilters. TP8: centrifugation, NDN.
TP9: coagulation, flocculation, filtration, NDN. TP10: dehydratation on scraped discs, N concen-tration by stripping and acid washing.