Publisher’s version / Version de l'éditeur:
Technical Note (National Research Council of Canada. Division of Building
Research), 1965-09-01
READ THESE TERMS AND CONDITIONS CAREFULLY BEFORE USING THIS WEBSITE.
https://nrc-publications.canada.ca/eng/copyright
Vous avez des questions? Nous pouvons vous aider. Pour communiquer directement avec un auteur, consultez la
première page de la revue dans laquelle son article a été publié afin de trouver ses coordonnées. Si vous n’arrivez pas à les repérer, communiquez avec nous à [email protected].
Questions? Contact the NRC Publications Archive team at
[email protected]. If you wish to email the authors directly, please see the first page of the publication for their contact information.
NRC Publications Archive
Archives des publications du CNRC
For the publisher’s version, please access the DOI link below./ Pour consulter la version de l’éditeur, utilisez le lien DOI ci-dessous.
https://doi.org/10.4224/20338569
Access and use of this website and the material on it are subject to the Terms and Conditions set forth at
Icing Observations 1964-65 - First Progress Report
Boyd, D. W.
https://publications-cnrc.canada.ca/fra/droits
L’accès à ce site Web et l’utilisation de son contenu sont assujettis aux conditions présentées dans le site LISEZ CES CONDITIONS ATTENTIVEMENT AVANT D’UTILISER CE SITE WEB.
NRC Publications Record / Notice d'Archives des publications de CNRC:
https://nrc-publications.canada.ca/eng/view/object/?id=bb862589-c177-4918-88c5-f486614a258d https://publications-cnrc.canada.ca/fra/voir/objet/?id=bb862589-c177-4918-88c5-f486614a258dThere are several possible sources of information about icing loads or ice thicknesses resulting from freezing rain. The most obvious one is the Meteorological Branch of the Department of Transport which collects weather observations from over 2000 locations in Canada. At most of these stations the relatively infrequent reports of freezing precipitation and ice thickness have been entered in the "Remarks" column of the weather report form and have not been abstracted, averaged nor published. At over 250 stations where weather observations are taken every hour the occurrences of freezing precipitation are recorded on punched cards but the thickness of accumulated ice is only available from the "Remarks" in the
The weight of rime or glaze ice and the pressure increase caused by a gust of wind are two of the loads usually considered in the design of electric power transmission and communication lines and similar structures. Some information about wind gust speeds is available (for example in Supplement No. 1 to the National I}uilding Code of Canada), but very little is known about the thicknesses pf ice that may accumulate in different parts of the country. In recent years the Division of Building Research has been receiving a gradually increasing number of requests for information about the accumulation of ice on such structures. At the s:ame time the Canadian Standards Asst,:>ciation Committee on Aerial Joint Use of Pole s (which is responsible for a part of the Canadian Electrical Code) was considering the possibility of revising their storm loading map.
ICING OBSERVATIONS 1964-65 - FIRST PROGRESS REPORT
No.
459 September 196 APPROVED BY RFLNOTlE
M M M M M M M M M M セ-CHECKED BY L WG
DIVISION OF BUILDING RESEARCH
']['EClHlN][ CAlL
D. W. Boyd
Inquiry and record purposes
NATIONAL RESEARCH COUNCIL OF CANADA
SUBJECT
PREPARED BY
2
-original report. So far the time needed to examine the ItRemarks" for ice thicknesses has not been available.
A second possible source of information is the files of all the communication and power companies in the country. There are several reasons for not using this source, of which the most important is probably the difficulty of extracting the information from many years of files for many companie s.
A third possibility is to consider new information or current weather only, at least for a start. If the assistance of many people can be enlisted then a little work from each of them might provide enough information in a few years.
This last source of information seemed to be the most promising. Early in 1964 the Division of Building Research drew up an "Icing
Report Formlt and the Subcommittee on General Requirements of the
CSA Committee on Aerial Joint Use of Pole s arranged for the distribution of over 1800 copies of the form to telephone, telegraph, electric power and other companies and commissions. It was hoped that all the power and communication organizations in the country would report the ice thickness for any storm that damaged any of their equipment. The use of damage as a criterion for reporting icing storms would naturally eliminate all the minor occurrences of freezing precipitation and at the same time ensure at least two reports (one from a telephone company and one from a power company) of any major icing storm.
ICING REPORTS
By the end of June 1965, 37 Icing Report forms had been returned to the Division of Building Research from 12 companies. Nine of these reports, from seven different companies, could not properly be considered icing reports. Two reported only hoarfrost. two reported drifting snow (one of them "with some rime and glaze"), and the other five reported "no icelt
• None of these nine reports mentioned any damage.
A second group of five reports was received from the weather station on Old Glory Mountain near Trail, B. C., at 7700 ft above sea level. These were mostly reports of rime icing caused by supercooled droplets in the clouds that frequently cover the mountain tops in winter. Such rime icing is very important at high elevations but it is formed in a quite different way from the glaze ice at lower elevations and should be studied
3
-separately. It will not be dealt with further in this preliminary report.
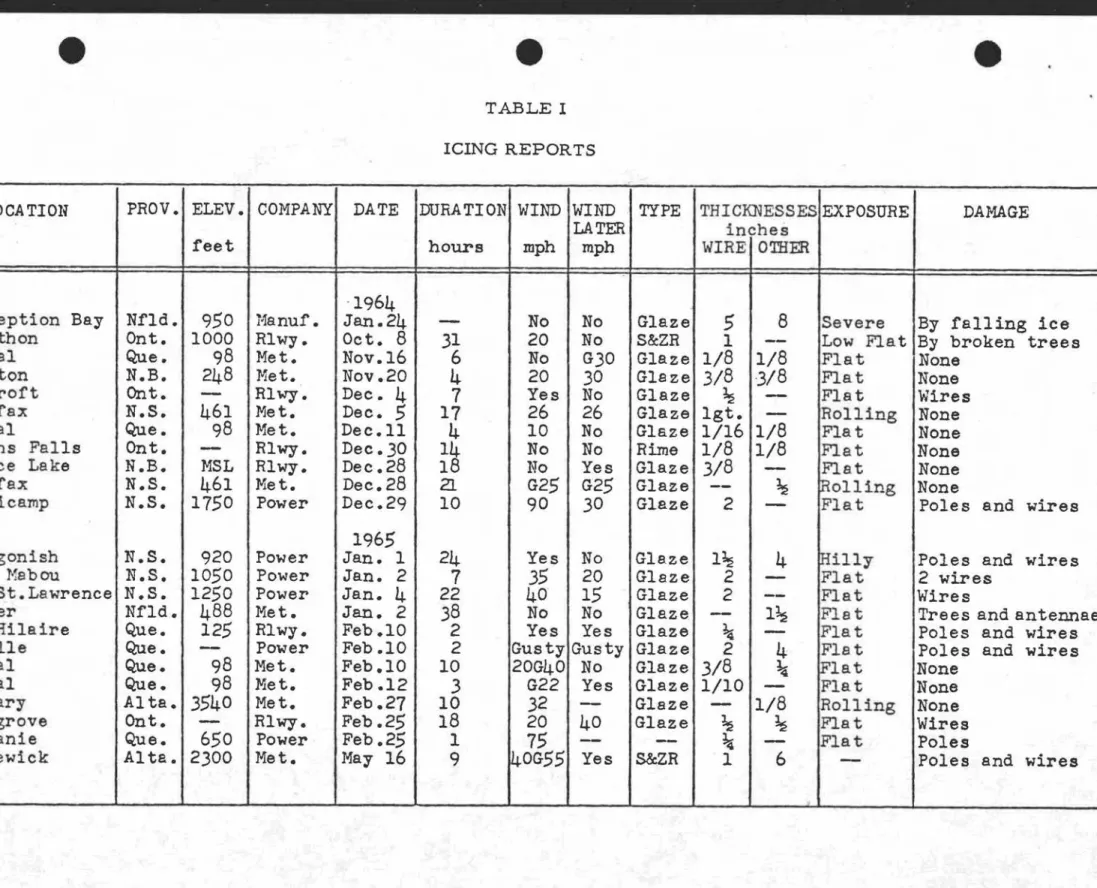
The remaining 23 reports all mentioned ice that was reported or assumed to be mostly glaze. Most of the information in these reports is summarized in Table 1. It should be noted that the first report refers to the winter of 1963- 64. It is included in this report because of its
severity. The place names are, in most cases, the nearest populated places; if needed, more precise locations are usually available from the original reports. The elevations are in feet above sea level but several of them are only approximate. The author of each report is identified only by the main busine s s of his company. The date is the one on which the icing began. Winds are in miles per hour. Values following "G" are gust speeds. "S & ZR" means snow and freezing rain. If two values of ice thicknesses (in inches) were given in the original report, the larger is included in this report. If the distribution around a wire was not uniform then the average thickness was listed. "Other" includes poles, towers, railings, and flat surfaces. The abbreviation 19t. stands for light. In the damage column:wires" or"poleJ indicates that many of these were broken. The entry "2 wires" indicates that only 2 breaks were found.
FREEZING PRECIPITATION
The occurrences of free zing precipitation at over 250 hourly-reporting weather stations are recorded on punched cards by the
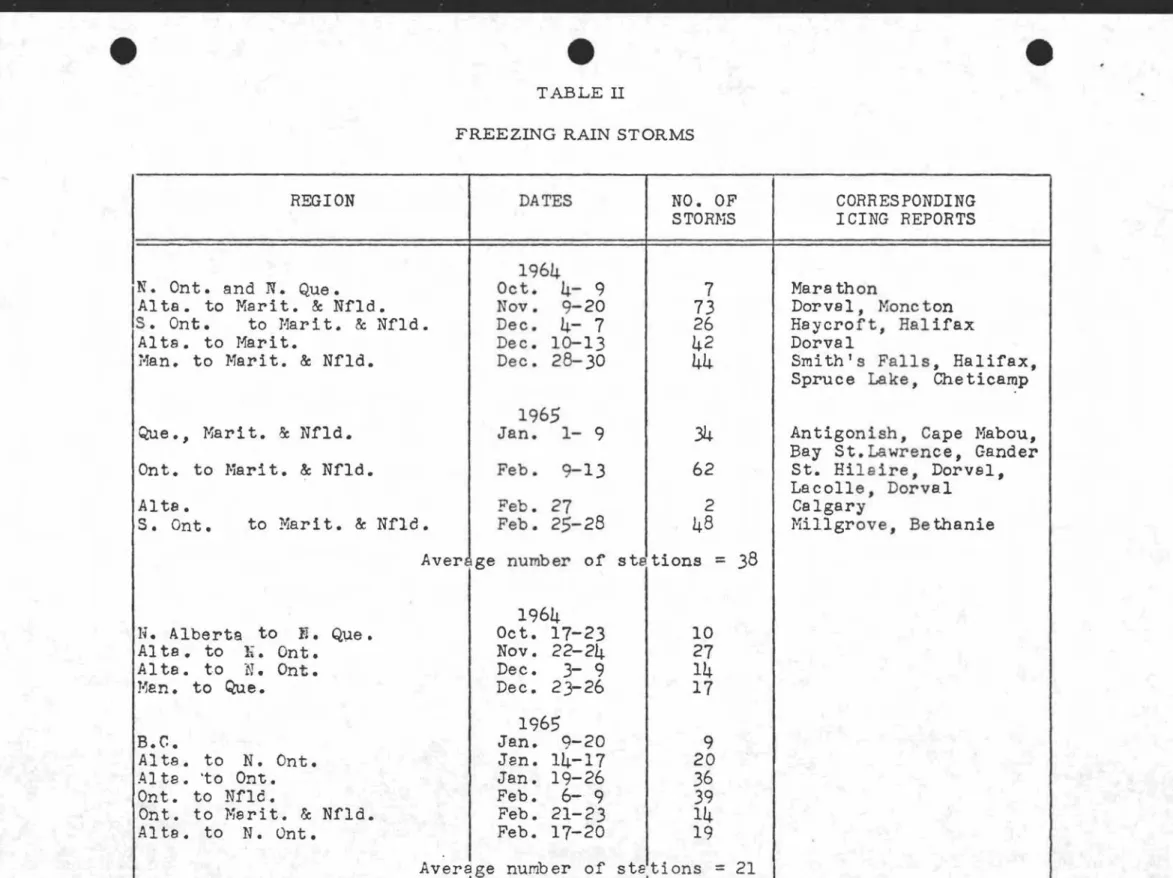
Meteorological Branch. A routine tabulation (TAB 41) prepared from these cards lists, among other items, the dates of freezing precipitation at each station. If a free zing rain storm is defined as a period of
from one to four days with freezing precipitation, then about 850 freezing rain storms were reported during the period from October 1964 to
February 1965, inclusive. The weather stations in the Northwest Territories and the Yukon were excluded from this count, leaving approximately 230 stations.
Many of these storms seemed to fall into groups as if a storm were born in Alberta, for example, and gradually moved eastward to Newfoundland and was lost at sea six or eight days later. Others seemed to enter Ontario from the southwest and cross the Maritimes a few days later. This could be confirmed or refuted in each case by studying the synoptic weather maps, but for a preliminary report the rougher method of grouping is probably adequate. Eighteen such groups were identified comprising a total of 550 indi,vidual reports. The remaining 300
,
4
-The first and last icing reports are outside the period for which freezing precipitation reports were studied. The other 21 icing reports all fell within one of the groups of freezing rain storms, except the one at Calgary for which a nineteenth group was formed. These freezing rain storms that resulted in one or more "Icing Report" are listed in the first part of Table II, The remaining freezing rain storms are listed in the latter part of that Table. The number of stations reporting each freezing rain storm is shown, and the average number of stations when there were, and were not, Icing Reports.
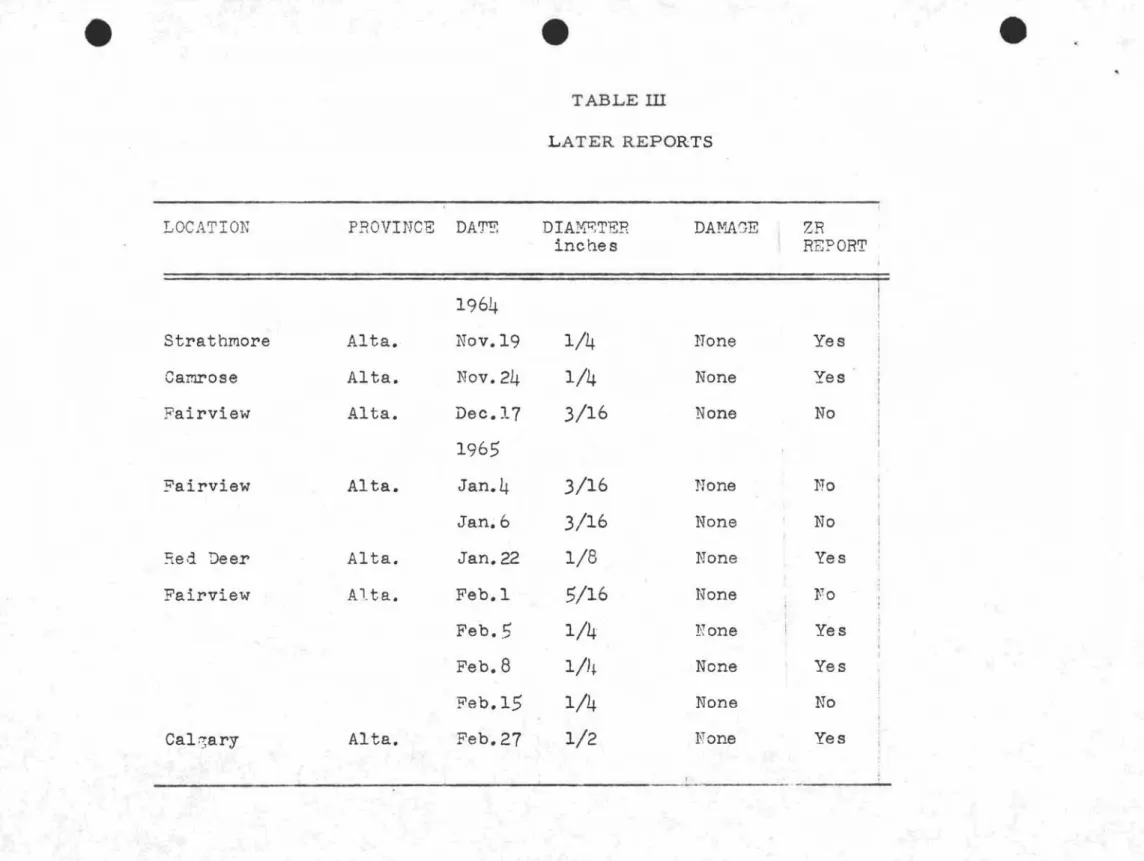
On 22 July an additional 69 Icing Report forms were received from Alberta. Of these, 44 reported frost but "no ice" and no damage. In the other reports the "diameter of ice" was reported (not the thickness as indicated on the form) and there is some doubt about what was meant because in 8 cases the "diameter of ice" was less than the diameter of the wire on which it formed. Whatever was meant, these 8 cases and 5 others marked "slight" cannot be considered to have caused appreciable loads. One report was repeated half an hour later. The remaining 11 reports are listed in Table III. The last column indicates whether there was freezing rain reported at any weather station in Alberta on that date or not. No mention of damage was made in any of these reports.
ILLUSTRATIONS
There is probably a marked correlation between the frequency of freezing rain and the thickness of icing accumulations. It was thought, therefore, that a map showing the average annual number of hours with freezing precipitation would be of sufficient interest to justify its
inclusion in the report. Figure 1 was copied from a preliminary draft of a map being prepared by the Climatology Division and it may be revised before publication.
Three of the Icing Reports included photographs, some of which are reproduced in Figure 2. Those of a tower near the south tip of
Conception Bay show that the clear ice on the guy wires was about 5 in. in radial thickness. Damage to other structures was caused by falling chunks of ice (like those shown) after melting began. On the power line near Antigonish some of the 4- by 8-in. wooden crossarms were broken. In the Gander photographs the ice on the twig is about 3/4-in. thick after some melting. On some of the small tree s the ice was 1 in. thick.
5
-DISCUSSION
Naturally it is not possible to draw even tentative conclusions about the distribution of icing in Canada from the Icing Reports for a single winter season. The number of significant reports received, however, was smaller than expected so that it will take many similar winters to collect enough information for even a tentative map of icing severity.
There were about 850 periods of freezing rain reported by
about 230 weather stations. There were 106 Icing Report forms returned, 34 of which reported measurable icing, but only 11 of which reported any damage in the period from October 1964 to February 1965. There are two possible reasons for the few reports of damage: first, that most freezing rain storms are harmless, only about ore in 77 causing damage; second, that much of the damage caused by icing was not reported. It is probable that both reasons affected the number of reports of damage but it is difficult to say which was more important.
The storms between 28 December 1964, and 9 January 1965, were severe over much of Cape Breton and part of the mainland of Nova Scotia. The four men who sent in Icing Reports from four different areas all work for the same company. It seems impropable that no other company suffered any damage.
The latest icing report from near Sedgewick, Alberta, seems to have been sent in by an off -duty meteorologist from Edmonton. He reports broken power lines and 40 telephone poles down in a 4-mile stretch, and says that "the old-timers in the place describe this storm as the worst spring storm in living memory." No report on this storm has been received yet (September 23) from any power or telephone company in Alberta.
In conclusion, it seemsエッセ「・イ・。ウッョ。「ャケ certain that the majority of occurrences of freezing precipitation do not cause any damage to power or communication lines.
On
the other hand it is evident that all the <iamage sustained last winter was not reported. It will be difficult to prepare an ice loading map of Canada based on a predetermined frequency or return period unless virtually all damaging storms are satisfactorily reported.e
e
TABLE I ICING REPORTS
e
LOCATIOli
I PROV.I ELEV.I COMPANYI DATE IDURATIONIWIND!WIND
TYPE
THICIrnESSESjEXPOSURE
I
DAMAGE
LATER
inches
feet
1
I
==i
hours
I
mph
セィ
wIRElomER
-1964
8
Conception Bay
Nfld.
950
11anuf.
Jan.24
-
No
No
Glaze
5
Severe
IBY falling ice
f-jare thon
Ont.
1000
Rlwy.
Oct. 8
31
20
No
S&ZR
1
--
Low Flat By broken trees
Dorval
Que.
98
Met.
Nov.16
6
No
G30
Glaze 1/8
1/8
Flat
None
Honcton
N.B.
248
Met.
Nov.20
4
20
30
Glaze 3/8
J/8
Flat
None
Haycroft
Ont.
-
Rlwy.
Dec. 4
7
Yes
No
Glaze
セ-
Flat
Wires
Halifax
N.S.
461
Met.
Dec. 5
17
26
26
Glaze 19t.
-
Rolling
None
Dorval
Que.
98
Met.
Dec.ll
4
10
No
Glaze 1/16 1/8
Flat
None
Smi ths Falls
Ont.
-
Rlwy.
Dec.30
14
No
No
Rime
1/8
1/8
Flat
None
Spruce Lake
N.B.
JvlSL
Rlwy.
Dec.28
18
No
Yes
Glaze 3/8
-
Flat
None
Halifax
N.S.
461
Met.
Dec.28
2lG25
G25
Glaze
--
セoIling
None
Cheticamp
N.S.
1750
Power
Dec.29
10
90
30
Glaze
2
-
Flat
Poles and wires
1965
Antigonish
N.S.
920
Power
Jan. 1
24
Yes
No
Glaze
ャセ4
illy
Poles and wires
Cape Mabeu
N.S.
1050
Power
Jan. 2
7
35
20
Glaze
2
-
Flat
2 wires
Bey St. Lawrence N.S.
1250
Power
Jan. 4
22
40
15
Glaze
2
--
Flat
Wires
Gander
Nfld.
488
Met.
Jan. 2
38
No
No
Glaze
-
ャセFlat
Trees and antennae
St. Hilaire
Que.
125
Rlwy.
Feb .10
2
Yes
Yes
Glaze
セ-
FIe t
Poles end wires
Lacol1e
Que.
-
Power
Feb .10
2
Gusty Gusty Glaze
2
4
Flat
Poles and wires
Dorval
Que.
98
Met.
Feb.lO
10
20G40 No
Glaze 3/8
セat
None
Dorval
Que.
98
Met.
Feb .12
3
G22
Yes
Glaze 1/10
-
Flat
None
Calgary
Al ta. 3540
Met.
Feb .27
10
32
-
Glaze
-
1/8
Rolling
None
Kl1lgrove
Ont.
-
Rlwy.
Feb .25
18
20
40
Glaze
セ セFlat
Wires
Bethanie
Que.
650
Power
Feb .25
1
75
-
--
セ
-
Flat
Poles
e
e
TABLE II
FREEZING RAIN STORMS
e
REGION
N. Onto and N. Que.
Alta. to Marit.
&
Nf1d.
S. Ont.
to Marit.
&
Nfld.
A1 ta. to Hari t.
Man. to Marit.
&
Nf1d.
DATES
1964
Oct.
4- 9
Nov.
9-20
Dec.
4- 7
Dec. 10-13
Dec. 28- 30
NO. OF
STORNS
7
73
26
42
44
CORRESPONDING
I CING REPORTS
Marathon
Dorval, Monc ton
Haycroft, Halifax
Dorval
Smith's Falls, Halifax,
Spruce Lake, Cheticamp
Que., Marit.
&
Nfld.
Onto to Marit.
&
Nf1d.
Al ta.
S.
Ont.
to Marit.
&
Nfld.
1965
Jan.
1- 9
Feb.
9-13
Feb. 27
Feb. 25-28
34
62
2
48
Antigonish, Cape Mabou,
Bay St. Lawrence, Gander
St. Hilaire, Dorval,
Laco11e, Dorval
Calgary
Millgrove, Bethanie
Average number of
ウエセエゥッョウ=
38
1964
N. Alberta to
N. Ql,le.
Oct. 17-23
10
Al ta. to
1\. Ont.
Nov. 22-24
27
Al ta. to
N. Ont.
Dec.
3- 9
14
ャセ・ョN
to Que.
Dec. 23-26
17
1965
B.C.
Jan.
9-20
9
Al ta. to
N. Ont.
Jan. 14-17
20
041 ta. 'to Ont.
Jan. 19-26
36
Onto to Nflc.
Feb.
6- 9
39
Onto to Marit.
&
Nfld.
Feb. 21-23
14
A1 ta. to
N. Ont.
Feb. 17-20
19
Average number of ststions
=
21
e
e
TABLE III LATER REPORTS
LOCATION
PROVINCE
DAT'S diaセter daセエセHスeI
ZR
inches
REPORT
1964
Strathmore
Alta.
Nov.19
1/4
None
Yes
Camrose
Al ta.
Nov. 24
1/4
None
Yes
?airview
Alta.
Dec.l?
3/16
None
No
1965
Pairview
Alta.
Jan.4
3/16
None
No
j。ョセV
3/16
None
No
5ed Deer
Alta.
Jan. 22
1/8
None
Yes
Fairview
Al.ta.
Feb.l
5/16
None
}10Fe b •.
5
1/4
};one
IYes
Feb.8
1/1
tNone
Yes
Feb.15
1/4
None
No
Cal::;ary
Alta.
Feb.27
1/2
Eone
Yes
•
Mean Annual Number of Hours
with Freezing Drizzle and Freezing Rain
1942-1960
Climatology Division
May 1965
...