A Computational Investigation of Nucleation
Processes in Organic Crystals
by
Gregg Tyler Beckham
BS Chemical Engineering, Oklahoma State University, 2002
MS Chemical Engineering Practice, Massachusetts Institute of Technology, 2004
Submitted to the Department of Chemical Engineering in partial fulfillment of the requirements for the degree of
Doctor of Philosophy in Chemical Engineering at the
Massachusetts Institute of Technology
October 2007
© 2007 Massachusetts Institute of Technology. All rights reserved.
Signature of Author: . , ,
Department of Chemical Engineering October 2, 2007 Certified by: Bernhardt L. Trout, Ph.D. Associate Professor Thesis Supervisor Accepted by: William M. Deen, Ph.D. Carbon P. Dubbs Professor Chairman, Committee for Graduate Students
MASSACHU
N.S
OFTEOHNOLOGY
MAR 0 6 2 ]008A
M
A Computational Investigation of Nucleation Processes in Organic Crystals
Gregg Tyler Beckham
Nucleation processes are ubiquitous in nature and technology. For instance, cloud formation in the atmosphere, the casting of metals, protein crystallization, biomineralization, the production of porous materials, and separation of pharmaceutical compounds from solution are a few examples of relevant nucleation processes. One pathway for nucleation to occur is homogeneous nucleation, in which an embryo of a more stable phase forms within an original metastable medium. Homogeneous nucleation is an activated process, meaning that a free energy barrier must be overcome for the transition to take place, and the height of the free energy barrier determines the rate at which the process will occur. Despite considerable advances in both theoretical and experimental techniques to date, determining nucleation mechanisms for real systems remains a considerable technical challenge. The aim of this thesis is therefore to apply molecular simulation techniques to elucidate nucleation mechanisms in organic crystals. Specifically, the newly developed methods of aimless shooting and likelihood maximization are applied for the first time to study nucleation processes in complex and technically relevant systems.
The first portion of the thesis examines polymorphism, or the ability of a material to pack in different crystal lattices whilst retaining the same chemical composition. Transformation to a more stable polymorph can readily occur in the solid state, which has broad implications in pharmaceutical processing. To date, over 160 mechanisms have been proposed for polymorph transitions in the solid state, but none have been definitively verified. A model compound, terephthalic acid, is chosen for computational studies because it is similar in size to a small molecule therapeutic and exhibits a common bonding motif for organic crystals. Using aimless shooting and likelihood maximization, the mechanism of the solid state polymorph transformation in terephthalic acid is shown to be comer nucleation. The mechanism shows that for a given nucleus size, the interfacial area between the crystalline domains is minimized, thus reducing the unfavorable surface free energy penalty required for nucleation to occur. Furthermore, based on the results presented, it is anticipated that corner nucleation may be a common mechanism for many polymorph transformations in hydrogen bonded crystalline materials.
The second portion of the thesis investigates the mechanism of freezing a subcooled liquid to form a crystal. This phenomenon has widespread application across many technical domains. Similar studies to date on freezing have been limited to model systems, such as Lennard-Jones particles or hard spheres. Benzene is chosen as a model compound. A periodic system is constructed and aimless shooting and likelihood maximization are applied to determine the nature of the critical nucleus. Local order analysis is implemented to distinguish among solid and liquid-like molecules. Preliminary results indicate that the critical nucleus is on the order of 200-300 molecules at 50 K subcooling.
This thesis demonstrates that the complementary molecular simulation techniques of aimless shooting and likelihood maximization offer fundamental insight into nucleation mechanisms in molecular crystals. Knowledge of the mechanism from likelihood maximization is essential for accurate free energies and pathway optimization methods, and it should therefore be applied in computational studies of rare events prior to free energy or rate constant calculations. Moreover, these methods provide quantitative understanding of the important physical variables that determine experimentally observable rates and can further aid in experimental design.
Acknowledgements
First, I would like to thank my advisor Professor Bernhardt Trout. He has instilled in me a desire to conduct rigorous work and an appreciation for the search for fundamental understanding as a prerequisite to judicious engineering. In addition, Bernhardt has created a comfortable, good-natured learning environment with friendly, professional support, afforded me a great deal of creative freedom with our research, allowed me to pursue my own interests outside of my thesis project, and has been patient with me in all things. He is an excellent and keenly insightful mentor, and for that I am earnestly grateful.
Thesis committee members Professors Michael Cima, Klavs Jensen, and Sidney Yip provided valuable advice, for which I am appreciative. They challenged me to address the research problems in different and unique ways, and this thesis benefited greatly from their questions
and insight.
The initial choice of a project for doctoral work in a new field can be daunting. In our case, we profited greatly from our industrial sponsors in both the Chemical Engineering Research and Development group and the Physical Measurements group at Merck & Co., Inc. Specifically, Michael Thien arranged the initial collaboration and was a fervent supporter of the project throughout. Cindy Starbuck generously and enthusiastically gave her time to the project, especially when I worked at Merck for extended visits. Narayan Variankaval continuously provided helpful suggestions concerning both experimental and computational work. Ivan Lee also deserves special thanks as he volunteered an empty room in his house when I summered in New Jersey to work at Merck in 2003.
Many people at MIT have contributed to the success of this work. Working with the Trout research group has significantly contributed to my overall intellectual experience at MIT. I wish to thank all members past and present for their support and camaraderie during my time at MIT. In particular, Jhih-Wei Chu and Brian Baynes both patiently instructed me in how to use CHARMM and calmed my initial frustrations in molecular simulation. Bin Pan has been a continuous source of helpful discussions and rigorous suggestions as well as a good friend. It has been comforting to have fellow crystal simulators Jie Chen and Srikanth Patala in the group to vent common frustrations with molecular simulation of crystals. Victor Ovchinnikov deserves special thanks as he bore the Promethean duty of bringing NAMD to our group, thus allowing us to answer questions for larger, more complex systems. In addition, he has volunteered substantial amounts of his time to discuss the research presented in this thesis and share his specialized codes, and the thesis has been improved greatly as a result. Gwen Wilcox, Don McGaffigan, and Angelique Scarpa have worked with our group tirelessly to help in all operational aspects. Finally, I am also grateful for generous funding from Merck & Co., Inc., the Singapore-MIT Alliance, and the National Science Foundation via a Graduate Research Fellowship.
One of the greatest friends I made at MIT is Baron Peters. Baron's genuine enthusiasm for conducting research served as an inspiration and model to me. His relentless drive to answer difficult problems led to his pioneering work on aimless shooting and likelihood maximization, which is used throughout and partially developed in this thesis. Baron served as a patient, thoughtful mentor and collaborator, and was always willing to give his time. Spending several weeks working literally side-by-side in Lyon will easily be one of my fondest memories from graduate school. I sincerely thank Baron for his great friendship and
prudent counsel. I wish Baron (and Ban) continued success and happiness, and look forward to any future collaboration in which I might be fortunate enough to participate.
MIT includes many opportunities for professional development beyond the doctoral thesis project. Attending the Practice School was undoubtedly one of the best choices that I made whilst at MIT. Claude Lupis made the experience enjoyable and worthwhile, and for that I am grateful. Counting marshmallows from bowls of Lucky Charms with Mark Sains will remain a fond memory. Belinda Akpa faithfully accompanied me to local bookstores on Sundays. Andy Rees and Iain Burns introduced me to driving on the other side of the road, listening to Tom Waits on rainy evenings, and British-style pub crawls in Hull, all of which was enjoyable and appreciated. In addition, I thank Professor Alan Hatton for providing me with the opportunity to act as the director of the Industrial Immersion program for the Singapore-MIT Alliance in Singapore.
My trajectory to MIT was aided immensely by my admittance to the Oklahoma School of Science and Mathematics. I owe a huge debt of gratitude to the school, and especially to Professors Dorothy Dodd, Jeanette Feldott, Chengde Feng, Yunhua Feng, and Russell Lawson. During undergraduate studies at Oklahoma State University, I was fortunate enough to be rejected as a teaching assistant for the conventional courses in the Chemistry Department. This steered me to work as a teaching assistant in inquiry based chemistry for three years with Dr. Smith Holt. He demonstrated how to apply science and education as complementary tools for social good, and was immensely influential in my decision to attend graduate school.
I am grateful to my mother and father for raising me to be an independent and motivated person and for exposing me to different worldviews by taking me to live abroad as a child. Brenda has been a positive influence as well and for that I thank her. Both my grandfather and father are especially hard working, dedicated people, and have both been excellent role models from my formative days of farm work to the present day as I finish my time at graduate school.
During my time at MIT, I have benefited from many great friendships. Our first year graduate class was an especially fun and diverse group of wonderful people. Kris Wood is easily the most positive person and the best storyteller that I have ever met. He has been both one of my best friends and an inspiration throughout graduate school, and for that I am exceedingly grateful. Jane Rempel, besides being a helpful genius regarding research and an unparalleled proofreader, has also been a great friend. Jane has always been ready for a non-work related diversion over the last five years, especially those involving movie-hopping or afternoon ABP runs. Sanjoy Sircar merits thanks as he was an excellent roommate for four years. Sharon Soong has been a great IM buddy on a daily basis. I was fortunate to sit across the table from the multi-talented Bernat Olle at the first dormitory social event that I attended, and we subsequently spent many evenings together sipping Onix whilst working on homework problems and telling stories. Evenings at Unos with Gwen Wilcox were a definite highlight, as she has been a good friend and a great listener throughout my graduate career; I truly appreciate her support. Shannan O'Shaughnessy and Jake Albrecht were fun-loving partners-in-crime for evenings on the town as well as supportive friends through tough times. Finally, Elizabeth Young has made my last two years at MIT a great joy, as she has been a steadfast, delightful, and goofy (in a good way) companion. My friends made at MIT have my love, respect, and best wishes for the future.
Table of Contents
CHAPTER 1: A COMPUTATIONAL INVESTIGATION OF NUCLEATION PROCESSES
IN ORGANIC CRYSTALS ... ... ... ... 12
1,1 M ethodology ... ... ... 13
1,2 Solid state Polymorph Transformation in Terephthalic Acid ... 16
1,3 Homogeneous Nucleation of Crystalline Benzene from the Melt ... 18
1,4 Thesis Outline ... ... 19
1.5 R eferences ... ... ... ... 19
CHAPTER 2: SURFACE-MEDIATED NUCLEATION IN THE SOLID STATE POLYMORPH TRANSFORMATION OF TEREPHTHALIC ACID ... 22
2,1 Introduction ... .. ... ... ... 22
.2 O verview ... ... ... ... 23
2,3 M ethodology ... ... .. ... ... ... 25
2.3.1. System Description ... 25
2.3.2 Force Field Development... ... 27
2.3.3 Order Parameters... .. ... 29
2.3.4 Aimless Shooting ... 30
2.3.5 Likelihood Maximization...32
2.3.6 Reaction Coordinate Validation... ... 32
2.4 R esults ... ... ... ... 34
2.4.1 Initial Trajectories ... .... ... ... ... 34
2.4.2 Aimless Shooting ... 41
2.4.3 Likelihood M aximization... 41
2.4.4 Reaction Coordinate Validation...42
2,5 D iscussion ... .... ... . ... ... 44
2,6 Summary and Conclusions...46
2 .7 R eferences ... ... ... 47
CHAPTER 3: EXTENSIONS TO THE LIKELIHOOD MAXIMIZATION APPROACH APPLIED TO THE SOLID STATE POLYMORPH TRANSFORMATION IN TE REPHTHALIC ACID ... 50
3,1 Introduction... 50
3,2 Two Point Version of Aimless Shooting ... ... ... 51
3,3 Half Trajectory Likelihood ... 51
3.4 Application of Half-Trajectory Likelihood Maximization to Terephthalic Acid 53 3 ,5 Sum m ary ... .... ... ... 57
3.6 References ... 57
CHAPTER 4: IDENTIFICATION OF A NON-INTUITIVE REACTION COORDINATE IN THE POLYMORPH TRANSFORMATION OF TEREPHTHALIC ACID VIA LIKELIHOOD MAXIMIZATION ... 60
4.1 Introduction... ... . ... ... ... 60
4.2 Methodology ... 62
4.2.1 Obtaining Initial Trajectories ... ...63
4.2.2 A im less Shooting ... ... .. ... 64
4.2.3 Likelihood M aximization... . ... 64
4.2.4 Committor Probability Distribution ... 65
4.2.5 Free Energy Calculations ... 66
CHt
CHt
4.4 D iscussion ... ... 71
4.4.1 Implications for Theory... 72
4.4.2 Significance for solid state polymorph transformations ... 74
4.5 Conclusions...75
4.6 References ... 76
APTER 5: HOMOGENEOUS NUCLEATION OF BENZENE FROM THE MELT...78
5.1 Introduction ... 78 5.2 Background ... 79 5.3 Methodology ... 81 5.3.1 General Approach ... 81 5.3.2 Force Field ... 82 5.3.3 Equilibration ... 83
5.3.4 Obtaining an Initial Shooting Point for Aimless Shooting Simulations...84
5.3.5 Mean Square Displacement ... ... 85
5.3.6 Molecule Labeling System...86
5.3.7 Aimless Shooting ... ... 90
5.3.8 Likelihood Maximization...90
5.4 R esults... ... 91
5.4.1 Initial Trajectory...91
5.4.2 Aimless Shooting and Likelihood Maximization ... 93
5.4.3 Characterization of Growth Time ... ... 94
5.5 D iscussion ... ... 95
5.6 Summary and Conclusions... ... 96
5.7 R eferences ... ... 96
APTER 6: SUMMARY AND FUTURE WORK ... 98
6.1 Summary ... 98
6.2 Future Work ... 99
6.2.1 Applications of Aimless Shooting and Likelihood Maximization to Nucleation Processes ... 100
6.2.2 Methodological Improvements for Nucleation Studies ... 102
6.3 R eferences ... 104
List of Figures
Figure 1-1. Snapshots along a trajectory from liquid water to hexagonal ice, reproduced from Matsumoto et al.10 The trajectory shown was obtained from an MD simulation on the timescale of hundreds of nanoseconds at 230 K. The circled region shows the first sign of order in the system . ... ... ... 14
Figure 1-2. Illustration of trial moves in transition path sampling [TPS]. Trajectory 2 is generated by perturbing the momentum slightly at a randomly selected point along trajectory 1, and propagating the forward and reverse directions along the new velocity vector. Since trajectory 2 connects the basins A and B, it is accepted as a reactive trajectory. Trajectory 3 is generated in the same manner as trajectory 2, and is an example of a rejected trajectory in that it does not connect the basins. ... 15 Figure 1-3. Six polymorphs of ROY45. The wide variety of physical properties illustrate the
diversity that arises from differences in crystal packing arrangements of the same molecule ... ... ... 17 Figure 2-1. Form I of the 216 molecule (6x6x6) TPA crystallite from the b-axis view (left)
and a-axis views (right). Hydrogen bonds that form the supramolecular synthons are shown in red-dotted lines between the carboxylic acid groups on each molecule...26 Figure 2-2. Form II of the 216 molecule (6x6x6) TPA crystallite from the b-axis view (left)
and a-axis views (right). Hydrogen bonds that form the supramolecular synthons are shown in red-dotted lines between the carboxylic acid groups on each molecule...27 Figure 2-3. RMSD as a function of the Lennard-Jones phenyl hydrogen radius for Form I (u)
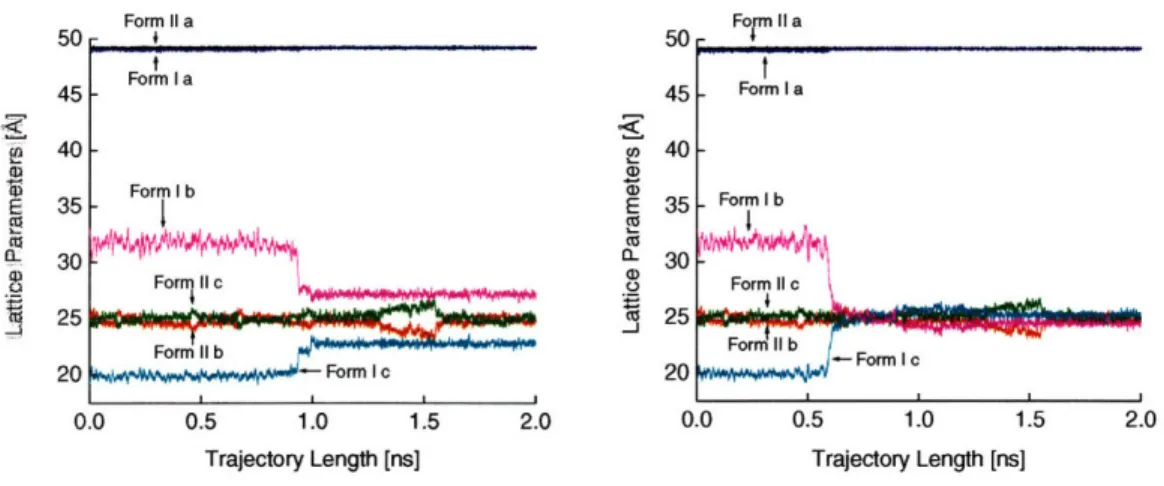
and Form II (*). Calculated with the Merz-Singh-Kollman48,49 partial atomic charge set ... ... ... ... ... 28 Figure 2-4. Single terephthalic acid molecule with atom labels ... 29 Figure 2-5. Crystal lattice parameters along a 2 ns trajectory for forms I and II of the 216
molecule system. (a) The change in the lattice parameters at approximately 1.0 ns corresponds to the unbiased nucleation event along the edge of the TPA crystal. The growth phase, however, is not seen in this trajectory as the system becomes kinetically trapped between the nucleation and growth events. (b) The change in the lattice parameters at approximately 0.6 ns corresponds to the unbiased form I to form II polymorph transformation. Excellent agreement is seen between the original form II crystal and the lattice vectors after 0.6 ns for the form I trajectory ... 35 Figure 2-6. Snapshots from the b-axis and a-axis view along the initial trajectory for the 216
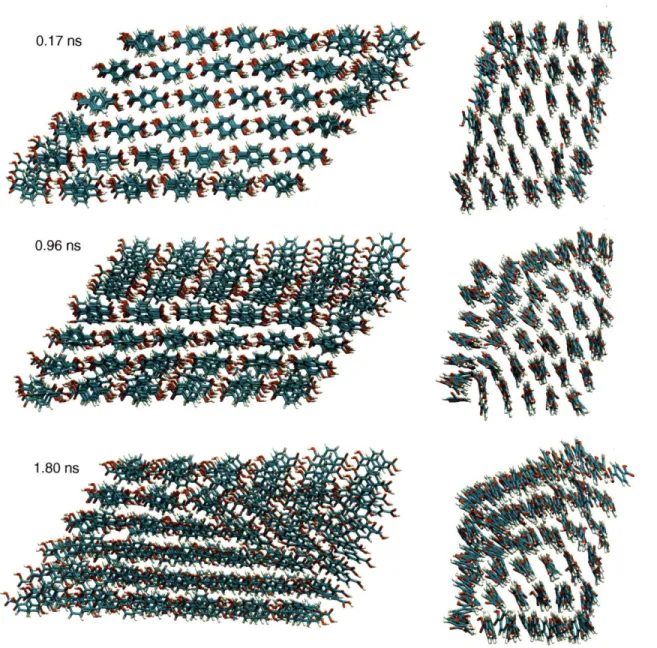
molecule system. These configurations correspond to the lattice parameters shown in Figure 4a, which becomes kinetically trapped after the nucleation event. From top to bottom, the configurations are taken at 0.17 ns (pre-transformation), 0.96 ns (during nucleation), and 1.8 ns (post-nucleation, when the crystal is kinetically trapped). Note that the nucleation event takes place at the top left corner (as seen from the a-axis view) and the molecules in the bottom right corner (again, on the a-axis view) retain their original orientation characteristic of form I ... 36 Figure 2-7. Snapshots from the b-axis and a-axis views along the initial trajectory for the 216
molecule system. These configurations correspond to the lattice parameters shown in Figure 4b, which undergoes both nucleation and growth. From top to bottom, the configurations are taken at 0.17 ns (pre-transformation), 0.60 ns (at the onset of nucleation and growth), and at 1.8 ns (in the form II basin). Note that the nucleation
event takes place at the top left corner (as seen from the a-axis view) and propagates to the bottom right corner (again, on the a-axis view) ...37 Figure 2-8. Potential of mean force for the 216 molecule TPA system calculated from 8
windows of MD umbrella sampling along the b lattice parameter ...38 Figure 2-9. Potential of mean force for the 343 molecule TPA system calculated from 8
windows of MD umbrella sampling along the b/c axis ratio ...38 Figure 2-10. Snapshots from the b-axis and a-axis views along the initial trajectory for the
343 molecule system obtained from MD umbrella sampling. These configurations correspond to the PMF curve shown in Figure 8. From top to bottom, the
configurations are taken at b/c=1.60 (pre-transformation), b/c = 1.40 (at the onset of nucleation), b/c = 1.40 (as nucleation is occurring at the peak of the PMF curve), b/c = 1.20 (as growth is occurring), and at b/c = 1.00 (in the form II basin). Note that the nucleation event takes place at the top left corner (as seen from the c-axis view) and
propagates to the bottom right corner (again, on the c-axis view) ...40 Figure 2-11. (a) Committor probability histogram for 216 molecule system with b* = 30.195
A, as predicted from the p(TPIr) model with a 1-D reaction coordinate model. / = 0.629, oh = 0.182. (b) Committor probability histogram for 216 molecule system with b* = 30.400 A. ^ih = 0.490, ah = 0.144. ... 43 Figure 2-12. Committor probability histogram for 343 molecule system with b/c* = 1.4333,
as predicted from the p(TPJr) model with a 1-D reaction coordinate model. /A =
0.520, o = 0.208 ... 43
Figure 2-13. Change in the local c lattice parameter for each layer in the polymorph transformation of TPA. The differences in the local OP denote that there is a localized event occurring during the transition, namely edgewise nucleation. This corresponds to the transformation seen in Figure 5b, in which both the nucleation and growth events occur. The inset shows the local lattice parameter measurements from
Layer 1 to Layer 6 along the crystal. ... 45
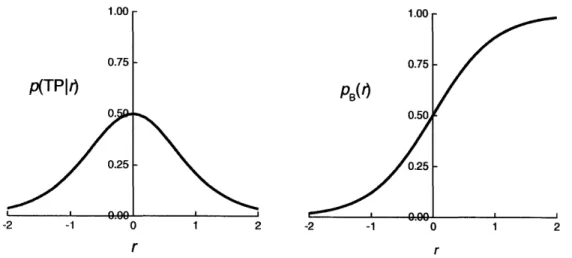
Figure 3-1. Model functions for the likelihood maximization algorithm. (a) p(TPIr) as given in Expression 3-1. The function is stationary at the transition state surface given by r = 0. (b) pB(r) as given by Expression 3-3. This model function is used in the half trajectory likelihood formulation of likelihood maximization...53 Figure 3-2. (a) Committor probability histogram for 216 molecule system with b* = 30.195
A, as predicted from the p(TPIr) model with a 1-D reaction coordinate model. (b) Committor probability histogram for 216 molecule system with b* = 30.240
A
aspredicted from the pB(r) model with a 1-D reaction coordinate model. ...54 Figure 3-3. Aimless shooting data plotted as a function of the reaction coordinate r and
compared to (a) optimized p(TPIr) function and (b) optimized pB(r) function. Note that the error bars appear on the model, not the data. The error bars show how far shooting point data should deviate from the probabilities p(TPIr) and pB(r) for a
perfect reaction coordinate model ... 55
Figure 3-4. Distributions of the maximum likelihood estimate from b* from 10000 bootstrap samples with 4000 trajectories in each sample. The red curve is from the half-trajectory likelihood of Equation 3-4, and the black curve is from the likelihood obtained via Equation 3-2. The value of b* indicated by the arrow is obtained by interpolating the location of m = 2½ from the histogram results at b* = 30.240 A and
Figure 3-5. Width of a 95% confidence interval from bootstrap sampling for the transition state value of the reaction coordinate b (in A) as a function of the number of aimless shooting trajectories used in the two likelihood functions, n. The width from LTp from
p(TPIr) is shown in black and the width from the half trajectory likelihood from pB(r) is shown in red. The half trajectory likelihood consistently provides a smaller interval that is also more accurate as evidenced by the histograms in Figure 3-2. ... 57 Figure 4-1. Form I and Form II terephthalic acid crystals from the a-axis view with the
outline of the local b/c lattice parameter ratio used to obtain the initial trajectory for input to the aimless shooting method. This particular local OP was chosen because the same crystallographically equivalent corner in the 6x6x6 and 7x7x7 molecule systems undergoes significant changes during the nucleation event. ... 63 Figure 4-2. Snapshots taken from a reactive trajectory from Form I to Form II. The
configuration shown in frame (c) is the shooting point in aimless shooting. Configurations shown in frame (a) and (e) are in the Form I and Form II basin,
respectively. ... ... ... ... ... ... 67 Figure 4-3. Endpoints of aimless shooting simulations as a function of the global b/c axis
ratio for the (a) 8x8x8 and (b) 10xl0x10 crystal. The global b/c lattice parameter ratio is used for the quantitative basin definitions in the aimless shooting procedure ... 68 Figure 4-4. Snapshots from the a-axis view of the 8x8x8 system near the transition state.
The molecules in space-fill format outline the local b/c axis ratio that is the best reaction coordinate approximation as determined by likelihood maximization. ... 70 Figure 4-5. Normalized committor probability histogram for the 8x8x8 system with a local
b/ct = 1.387, as predicted from the pB(r) model with a 1-dimensional reaction
coordinate. pUh = 0.588, c = 0.127. The intrinsic distribution with p= 0.588 and o-=
0.108, is plotted for comparison. ... 70 Figure 4-6. Potential of mean force calculated from MD umbrella sampling as a function of
the local b/c reaction coordinate from likelihood maximization for the 8x8x8 system. The weighted histogram analysis method50 73 ' is applied to combine the umbrella sam pling w indow s. ... ... ... ... 71
Figure 4-7. Snapshots from the a-axis view of the 8x8x8 system near the transition state. The molecules in blue are the molecules in the Form II lattice, whereas the green molecules are in the Form I lattice. The wireframe molecules in red are classified as being in neither basin, and form the interface between the two polymorphs...73 Figure 4-8. Snapshot from the b-axis view of the 8x8x8 system near the transition state. The
molecules in blue are the molecules in the Form II lattice, whereas the green
molecules are in the Form I lattice. The wireframe molecules in red are classified as neither crystal, and form the interface between the two polymorphs. ... 73 Figure 4-9. Form II nucleus size as a function of the local b/c reaction coordinate for the
8x8x8 crystal. The product basin is associated with large, positive r and the reactant basin corresponds to large, negative r. Therefore, as expected, the more stable Form II nucleus decreases in size as the system approaches the reactant, or Form I crystal, and increases as the system nears the product, or Form II crystal. This plot
demonstrates that even though the nucleus size is not the optimal reaction coordinate, it remains a useful illustration to explain the location of the reaction coordinate
determined from likelihood maximization. ... 74 Figure 5-1. Proposed phase diagram of benzene elucidated by metadynamics, reproduced
Figure 5-1. Number of solid molecules in a cluster at the end of 12 randomly seeded 100 ps MD trajectories. These trajectories are collected from a point along the initial melting trajectory to search for a putative transition state from which to initiate aimless
shooting. The starting configuration contains 205 molecules, as indicated by the dashed line. ... 85 Figure 5-2. Mean square displacement results for the Form I benzene crystal and liquid at
250K and 300 K and 0.1 GPa. These results indicate that benzene can remain in the liquid state at 250 K (rather than a glassy state), and that the crystals are stable over a long time scale at both 300 and 250 K at 0.1 GPa ... 86 Figure 5-3. Center of mass radial distribution functions for the Form I benzene crystal and
liquid at 250K and 300 K at 0.1 GPa. The first coordination shell for crystalline benzene exists out to approximately 8.5
A
and this distance is therefore used to search for nearest neighbors when calculating the bond orientational OPs. The radialdistribution functions for the crystals at 250 and 300 K at 0.1 GPa are identical...88 Figure 5-4. Center of mass positions for the 16 nearest neighbors of a single benzene
molecule. This snapshot is taken from an equilibrium simulation at 250 K and 0.1 GPa. The neighbors are shown as small beads and the center molecule is shown in transparent spacefill ... ... 88 Figure 5-5. Distribution of q6(i)-q6(j) function given by Equation 5-3 for all neighboring
particles i and j in an equilibrated crystal and liquid at 250 K and 0.1 GPa. These distributions are averaged over 20 independent frames ... 89 Figure 5-6. Distributions of the number of nearest neighbor connections per particle in an
equilibrated crystal and liquid at 250 K and 0.1 GPa. These distributions are averaged over 20 independent frames ... 90 Figure 5-7. Snapshots from the a-axis and c-axis views along the initial melting trajectory at
400 K. The liquid molecules are red and the solid molecules are blue. The respective views are shown in a 1:1 scale. The penultimate snapshot is similar to the
configurations used for input to aimless shooting. The last snapshot is completely liquid ... ... 93 Figure 5-8. Form I crystal nucleus from a reactive aimless shooting trajectory. The nucleus
molecules are labeled with blue surface shading and the liquid molecules are shown in red wireframe...94 Figure 5-9. Snapshots from the b-axis views along the growth trajectory at 250 K. Solid
List of Tables
Table 2-1. Lattice parameters from the experimental crystal structures ... 27 Table 2-2. Partial atomic charges from a single point energy calculation on a single gas phase molecule. Partial atomic charges are extracted using the MSK scheme ... 29 Table 2-5. Likelihood maximization approximations to the 1-dimensional reaction coordinate
for 4000 aimless shooting paths for the 216 molecule TPA system and 3500 aimless shooting paths for the 343 molecule TPA systema. ... ... 42 Table 3-1. Likelihood maximization results for the 1-dimensional reaction coordinate for
4000 aimless shooting paths for the 6x6x6 terephthalic acid system for both the p(TPIr) and pB(r) models...54 Table 3-2. Mean (u) and standard deviations (o) of the intrinsic committor probability
distribution for transition state surfaces from the two likelihood maximization schemes. The half trajectory likelihood gives a transition state surface (b* = 30.240 A) that is closer to the true transition state surface ... 55 Table 4-1. Likelihood maximization results for the reaction coordinate in the 8x8x8 and
10xl0x10 crystals. In addition, the likelihood scores are included for the 7x7x7 optimal reaction coordinate from the previous study39 along with the Form II nucleus size for com parison. ... .. ... ... ... 69 Table 5-1. Intermolecular force field parameters for benzene from the OPLS potential" ... 83 Table 5-2. Lattice parameters from the experimental crystal structure and NPT MD
CHAPTER 1: A COMPUTATIONAL INVESTIGATION OF NUCLEATION PROCESSES IN ORGANIC CRYSTALS
Nucleation processes are ubiquitous in nature and technology. For instance, cloud formation in the atmosphere, the casting of metals, protein crystallization, the formation of inorganic minerals in organisms, the production of porous materials for catalysis and gas absorption, and the separation of high value pharmaceutical compounds from solution are all examples of relevant nucleation processes1-4. One pathway by which these processes can occur is homogeneous nucleation, in which an embryo of a more stable phase forms within an original, metastable medium2. This type of phase transformation is an activated process, meaning that a free energy barrier must be overcome for the transition to take place, and the height of the free energy barrier determines the rate at which the process will occur. After the cluster is beyond some critical size, the growth of the new phase is spontaneous. In addition, the free energy barrier in nucleation processes depends strongly on temperature, which in turn means that experimental results can be astoundingly difficult to reproduce and theoretical predictions of nucleation rates are rife with uncertainty. As Oxtoby declares "[n]ucleation theory is one of the few areas of science in which agreement of predicted and measured rates to within several orders of magnitude is considered a major success"3. It is therefore evident that quantitative understanding of the events leading to nucleation and crystallization is of paramount significance in many areas of science. In light of the need for further understanding of nucleation, this thesis primarily examines two nucleation processes, both in real systems. The first case study elucidates the mechanism of a solid state polymorph transformation in an organic crystal similar in size and motif to organic crystals found in the pharmaceutical industry. The second portion of the thesis examines the mechanism of homogeneous nucleation of an organic crystal from the melt.
To date, experimental approaches for observing random, localized events leading to nucleation and crystallization are limited to relatively large monomeric units such as colloidal particles5 or to aggregated constituents like large protein nuclei6, which exist in a range of sizes between 100 nm to 1 pm. While experimental studies of nucleation are relevant for larger length scale processes, current experimental methodologies cannot offer the desired resolution and quantitative understanding for nucleation events that occur on atomic and molecular length scales ranging in magnitude from 1 A to 10-100 nm. Computational
methods, however, are able to track particles in space and time and therefore are more readily applicable in studying nucleation on a molecular level. Therefore, the approach taken in this thesis is to develop and apply sophisticated computational techniques in order to investigate nucleation events in molecular systems. This approach yields mechanistic information describing the nucleation process in systems of interest. Also, the work described here highlights the development of new computational techniques required to solve problems of this complexity.
1.1 Methodology
A number of studies have proved fruitful in the elucidation of nucleation processes for simple
systems. Previous studies can be generally separated into three types of methodological categories:
1) Using well-characterized systems for which the time scale for nucleation is computationally tractable at intermediate to high degrees of subcooling7-12
2) Selecting a mechanism a priori to force the desired transformation13-22, or 3) Collecting many unbiased pathways for the transformation23 -28
The first methodology is limited to obtaining a nucleation event in simple systems at intermediate to large subcooling. For instance, the first publication describing the nucleation of liquid water to hexagonal ice required several microseconds of simulation time to generate a single trajectory at significant subcoolingo'. Figure 1-1 shows snapshots of the trajectory. The "wall clock" time required to perform these microsecond simulations is on the year timriescale, and the simulations are not guaranteed to yield useful results a priori. The brute force nature of the first approach highlights the limitation of such a methodology for real systems"). The second methodology, pioneered by van Duijneveldt and Frenkel'3, often offers valuable insight for simple systems in which the choice of a reaction coordinate, the single variable that quantifies progress along a reaction pathway, is straightforward. However, in systems of increasing complexity, the choice of a reaction coordinate is typically nol intuitive, and incorrect reaction coordinates lead to spurious results for quantities of interest such as free energy changes, kinetic rate constants, and the mechanism itself.
C
Figure 1-1. Snapshots along a trajectory from liquid water to hexagonal ice, reproduced from Matsumoto et al.10 The trajectory shown was obtained from an MD
simulation on the timescale of hundreds of nanoseconds at 230 K. The circled region shows the first sign of order in the system.
The third methodology listed above became readily available with the development of the transition path sampling [TPS]. The TPS method, pioneered by Chandler and colleagues, is an efficient method that allows one to study unbiased, rare events in systems with no previous knowledge of the mechanisms or transition states2 9-34. The method is an iterative, Monte Carlo-like procedure in dynamic space. An initial trajectory connecting the reactant and product basins is generated, which may or may not be physical at the conditions of interest. TPS is initiated from this initial trajectory by perturbing the velocity at a randomly selected point and shooting trajectories in the forward and reverse directions along the new velocity vector. Trajectories are accepted if one end of the trajectory relaxes to the reactant basin and the other reaches the product basin. Trajectories are rejected if both ends connect a single basin. Repetition of the shooting procedure allows one to collect a set of reactive trajectories efficiently by focusing the computational time on the dynamical bottleneck. Figure 1-2 illustrates the TPS shooting algorithm.
Figure 1-2. Illustration of trial moves in transition path sampling [TPS]. Trajectory 2 is generated by perturbing the momentum slightly at a randomly selected point along trajectory 1, and propagating the forward and reverse directions along the new velocity vector. Since trajectory 2 connects the basins A and B, it is accepted as a reactive trajectory. Trajectory 3 is generated in the same manner as trajectory 2, and is an example of a rejected trajectory in that it does not connect the basins.
In addition, a variation on the TPS algorithm was developed: aimless shooting27' 35. The primary difference in TPS and aimless shooting is that the latter seeds random velocities at the shooting points, rather than perturbing the velocities from the previous trajectory, hence the term "aimless" shooting. This allows faster de-correlation of the transition paths. The other primary difference is that aimless shooting selects only from two shooting points, separated by a pre-specified time displacement whereas TPS randomly selects any point along the previous trajectory. TPS has been applied in nucleation studies such as the freezing of Lennard-Jones particles23, 25, the formation of small NaCl clusters from solution24, and nucleation in the Ising model27'
36. Other notable demonstrations of TPS across a wide variety of phenomena include the autoionization of water37, hydrophobic collapse of a polymer38, cavity formation in boiling water39, biomolecular isomerization4°, and protein folding41. After TPS has been conducted, one can determine the mechanism, or reaction coordinate, from the information contained in the transition path ensemble collected during TPS. Again, the reaction coordinate is the single variable that quantifies progress along a reaction pathway27. A good reaction coordinate yields useful insight into the factors which affect experimental reaction rates. From a computational perspective, an accurate reaction coordinate is necessary for free energy or rate constant calculations. Previous TPS studies utilize the committor probability histogram method to determine the reaction coordinate42-44 This method is a trial and error procedure that is at least as computationally expensive as TPS itself for each possible reaction coordinate tested. A more efficient method has been developed that uses an informatics approach, likelihood maximization, to extract the best
reaction coordinate from a list of candidate order parameters [OPs]2 7, 35. This method is applied after TPS has been conducted. Each OP, or combination of OPs, is assigned a likelihood score, which is used to rank the reaction coordinate approximation. The complementary methods of aimless shooting and likelihood maximization are applied in this thesis to investigate two types of nucleation events in organic crystals.
1.2 Solid state Polymorph Transformation in Terephthalic Acid
A major issue concerning nucleation and crystallization in the pharmaceutical industry is polymorphism, which is defined as the capability of a substance to crystallize into different, but chemically identical, crystalline forms'. Polymorphs typically exhibit different physical and chemical properties, which warrant specific design of processes to formulate particular products. An example of widely varying physical properties of polymorphs is illustrated in Figure 1-3, which shows six of the ten polymorphs of 5-methyl-2-[(2-nitrophenyl)amino]-3-thiophenecarbonitrile, known in the literature as ROY45. In the pharmaceutical industry, transformation to an undesired polymorph, for instance, can lead to different bioavailability in the target organism, which could render the drug useless, or increase its potency to a dangerous limit46. Oftentimes when compounds are discovered and a process is developed for its production, a more stable, undesired polymorph may appear as in the case with Abbott Laboratories' AIDS drug, Ritonavir. The occurrence of a late appearing polymorph caused setbacks in Ritonavir production as scientists were forced to discover methods to reproduce the desired, metastable polymorph47. Cases such as this arise from the exchange between kinetic and thermodynamic stability and can potentially cause extensive and costly problems in development, production, and patent rights.
I mm
Figure 1-3. Six polymorphs of ROY45. The wide variety of physical properties illustrate
the diversity that arises from differences in crystal packing arrangements of the same molecule.
Polymorph transformations often occur in the solid state. Mnyukh states that, as of 1998, over 160 mechanisms are reported for solid state polymorph transitions48. At present, however, gaining direct molecular level insight to the dynamical events occurring during solid state polymorph transformations is outside of the scope of experimental capabilities, and thus there is no definitive evidence for any particular mechanism. As remarked by Herbstein in an excellent review: "[t]here are relatively few papers about the actual transition directly viewed by microscopic techniques in order to infer the mechanism, and not many about changes in crystal structure...as the system passes through the transition."49 Two of the most common mechanisms proposed in the literature are 1) nucleation and growth48' 50-53 and 2) concerted, or martensitic, transformations54' 55. As Tuble et al. point out, however, there is increasing evidence that transformations thought to be martensitic in nature, actually occur via a nucleation and growth mechanism48' 49, 54. An accurate model which describes this process on
a molecular level would provide an improved understanding of the mechanism of solid state polymorph transformations in molecular crystals, and could ultimately provide the necessary knowledge for a priori selection of processing parameters to promote or prevent transformation from one polymorph to another.
As mentioned previously, determining molecular level pathways in a polymorph transformation is currently difficult from an experimental standpoint due to the inability to directly view morphological changes in crystal structures as a function of time. Molecular simulations, however, provide a convenient approach for the study of polymorph transformations. The objective of the research in this portion of the thesis is to therefore
apply aimless shooting and likelihood maximization27, 35 to determine the mechanism for the
solid state polymorph transformation of a model compound that is of the same approximate size as a small molecule therapeutic: terephthalic acid. Terephthalic acid is chosen as the molecule of study because:
1) it is relatively small and rigid even when completely unconstrained in a dynamic simulation at fully atomistic detail,
2) both of the polymorph crystal structures are known5 6
3) the transformation exhibits interesting macroscopic behavior that remains unexplained in the experimental literature57' 58, and
4) it represents a ubiquitous motif in organic crystallography with the hydrogen bonded carboxylic acid dimer synthons59.
1.3 Homogeneous Nucleation of Crystalline Benzene from the Melt
Nucleation of crystalline solids from the melt has been studied with both experimental and computational techniques5' 10, 12-20, 23, 25, 28, 60 In a series of three papers, ten Wolde et al. described the formation of Lennard-Jones crystals from the liquid state by applying an umbrella potential with bond-orientational order parameters used to convert liquid to solid particles in the Lennard-Jones system14-16. This study showed that the crystals typically form as body centered cubic [bcc] clusters and later convert to the more stable face centered cubic [fcc] structure. Moroni, ten Wolde, and Bolhuis later applied TPS to the same system and demonstrated that the critical nuclei can exist as large, more disordered bcc-like lattices as previously found, or as smaller, compact fcc crystals. The earlier publications of ten Wolde et al. were certainly pioneering work at the time of publication14-16, and have been generally applied to many different systems by other researchers12' 17-21, 61. However, this later study from Moroni et al., which illustrates that assuming a reaction coordinate yields a biased mechanism, highlights the need for the use of unbiased methods in determining mechanisms in nucleation problems, even for seemingly simple systems. Despite these considerable advances, there still is not a comprehensive mechanistic understanding of nucleation, especially for more complex systems in which the molecules are anisotropic, such as disk shaped molecules like benzene. It is anticipated that the anisotropy of benzene molecules will yield non-spherical critical nuclei. To investigate this, aimless shooting and likelihood
maximization are applied to determine the reaction coordinate for the mechanism of
nucleation in benzene. Benzene is chosen because:
1) it is a common model organic molecule and is fairly rigid and relatively small,
2) the OPLS potential describes the liquid and solid states adequately62 63,
3) the Form I crystal structure is known64, and
4) considerable experimental work has been conducted investigate the liquid-solid phase transition65-7
1.4 Thesis Outline
Chapter 2 describes the first application of aimless shooting and likelihood maximization to determine the mechanism for two crystal sizes in the solid state polymorph transformation in terephthalic acid. Chapter 3 outlines a methodological alteration to the likelihood
maximization algorithm that improves the ability to determine the transition state along the
transformation. Chapter 4 discusses the application of these same methods to larger
tercphthalic acid crystals, and focuses on the importance of local order to the reaction
coordinate. Also, the critical nucleus size is examined at the transition state in light of
classical nucleation theory. Chapter 5 describes the application of aimless shooting and
likelihood maximization to study benzene nucleation from the melt. The preliminary results for benzene nucleation are outlined. A summary of the research and recommendations for futLure work are outlined in Chapter 6.
1.5 References
1. Mullin, J.W., Crystallization. 4th Edition ed. 2001: Butterworth-Heinemann.
2. Debenedetti, P.G., Metastable liquids: Concepts and principles. 1st Edition ed. 1996: Princeton University Press.
3. Oxtoby, D.W. Acc. Chem. Res., 31, p. 91-97 (1998). 4. Hollingsworth, M.D. Science, 295, p. 2410-2413 (2002).
5. Gasser, U., et al. Science, 292, p. 258-262 (2001).
6. Yau, S.T. and P.G. Vekilov. Nature, 406, p. 494-497 (2000).
7. Anwar, J. and P.K. Boateng. J. Amer. Chem. Soc., 120, p. 9600-9604 (1998).
8. Berim, G.O. and E. Ruckenstein. J. Chem. Phys., 117, p. 4542-4549 (2002).
9. Berim, G.O. and E. Ruckenstein. J. Chem. Phys., 117, p. 7732-7737 (2002).
10. Matsumoto, M., S. Saito, and I. Ohmine. 416, p. 409-413 (2002).
11. Beaucage, P. and N. Mousseau. Phys. Rev. B, 71, p. 094102 (2005).
12. Leyssale, J.M., J. Delhommelle, and C. Millot. J. Chem. Phys., 122, p. 184518 (2005).
13. van Duijneveldt, J.S. and D. Frenkel. J. Chem. Phys., 96, p. 4655-4668 (1992).
14. ten Wolde, P.R., M.J. Ruiz-Montero, and D. Frenkel. Faraday Discuss., 104, p. 93-110 (1996).
15. ten Wolde, P.R., M.J. Ruiz-Montero, and D. Frenkel. J. Chem. Phys., 104, p. 9932-9947 (1996).
16. ten Wolde, P.R., M.J. Ruiz-Montero, and D. Frenkel. Phys. Rev. Lett., 75, p. 2714-2717 (1995).
17. Desgranges, C. and J. Delhommelle. J. Amer. Chem. Soc., 128, p. 15104-15105 (2006). 18. Desgranges, C. and J. Delhommelle. J. Chem. Phys., 126, p. 054501 (2007).
19. Leyssale, J.M., J. Delhommelle, and C. Millot. J. Amer. Chem. Soc., 126, p. 12286-12287 (2004). 20. Leyssale, J.M., J. Delhommelle, and C. Millot. J. Chem. Phys., 122, p. 104510 (2005).
21. Radhakrishnan, R. and B.L. Trout. J. Chem. Phys., 117, p. 1786-1796 (2002). 22. Chopra, M., Miiller, M., and de Pablo, J.J. J. Chem. Phys., 124, p. 134102 (2006). 23. Moroni, D., P.R. ten Wolde, and P.G. Bolhuis. Phys. Rev. Lett., 94, p. 235703 (2005). 24. Zahn, D. Phys. Rev. Lett., 92, p. 040801 (2004).
25. Trudu, F., D. Donadio, and M. Parrinello. Phys. Rev. Lett., 97, p. 105701 (2006). 26. Zahn, D. J. Phys. Chem. B, 111, p. 5249-5253 (2007).
27. Peters, B. and B.L. Trout. J. Chem. Phys., 125, p. 054108 (2006).
28. Radhakrishnan, R. and B.L. Trout. J. Amer. Chem. Soc., 125, p. 7743-7747 (2003). 29. Bolhuis, P.G., C. Dellago, and D. Chandler. Faraday Discuss., 110, p. 421-436 (1998). 30. Dellago, C., P.G. Bolhuis, and D. Chandler. J. Chem. Phys., 110, p. 6617-6625 (1999). 31. Dellago, C., P.G. Bolhuis, and D. Chandler. J. Chem. Phys., 108, p. 9236-9245 (1998). 32. Dellago, C., et al. J. Chem. Phys., 108, p. 1964-1977 (1998).
33. Dellago, C., P.G. Bolhuis, and P.G. Geissler. Adv. Chem. Phys., 123, p. 1-86 (2001). 34. Bolhuis, P.G., et al. Annu. Rev. Phys. Chem., 53, p. 291-318 (2002).
35. Peters, B., G.T. Beckham, and B.L. Trout. J. Chem. Phys., 127, p. 1 (2007). 36. Pan, A.C. and D. Chandler. J. Phys. Chem. B, 108, p. 19681-19686 (2004). 37. Geissler, P.G., et al. Science, 291, p. 2121-2124 (2001).
38. ten Wolde, P.R. and D. Chandler. Proc. Natl. Acad. Sci. U.S.A., 99, p. 6539-6543 (2002). 39. Zahn, D. Phys. Rev. Lett., 93, p. 227801 (2004).
40. Bolhuis, P.G., C. Dellago, and D. Chandler. Proc. Natl. Acad. Sci. U.S.A., 97, p. 5877-5882 (2000). 41. Juraszek, J. and P.G. Bolhuis. Proc. Natl. Acad. Sci. U.S.A., 103, p. 15859-15864 (2006).
42. Du, R., et al. J. Chem. Phys., 108, p. 334-350 (1998).
43. Geissler, P.G., C. Dellago, and D. Chandler. J. Phys. Chem. B, 103, p. 3706-3710 (1999). 44. Truhlar, D.G. and B.C. Garrett. J. Phys. Chem. B, 104, p. 1069-1072 (2000).
45. Yu, L., et al. J. Amer. Chem. Soc., 122, p. 585-591 (2000). 46. Caira, M.R. Topics in Curr. Chem., 198, p. 163-208 (1998).
47. Morissette, S.L., et al. Proc. Natl. Acad. Sci. U.S.A., 100, p. 2180-2184 (2003).
48. Mnyukh, Y.V., Fundamentals of solid-state phase transitions ferromagnetism and ferroelectricity. 1SI
Edition ed. 1998: 1t Books Library.
49. Herbstein, F.H. Acta Cryst., B62, p. 341-383 (2006). 50. Mnyukh, Y.V. J. Cryst. Growth, 32, p. 371-377 (1976).
51. Mnyukh, Y.V. Molec. Cryst. and Liquid Cryst., 52, p. 163-200 (1979). 52. Mnyukh, Y.V. Molec. Cryst. and Liquid Cryst., 52, p. 201-218 (1979).
53. Cardew, P.T., R.J. Davey, and A.J. Ruddick. J. Chem. Soc. -Faraday Trans., 80, p. 659-668 (1984).
54. Tuble, S.C., J. Anwar, and J.D. Gale. J. Amer. Chem. Soc., 126, p. 396-405 (2004). 55. Kaneko, F., et al. J. Phys. Chem. B, 102, p. 327-330 (1998).
56. Bailey, M. and C.J. Brown. Acta. Cryst., 22, p. 387-391 (1967).
57. Davey, R.J., et al. J. Chem. Soc. -Faraday Trans., 90, p. 1003-1009 (1994).
58. Davey, R.J., et al. Nature, 366, p. 248-250 (1993).
59. Desiraju, G.R. Angew. Chem. Int. Ed., 34, p. 2311-2327 (1995).
60. Valeriani, C., E. Sanz, and D. Frenkel. J. Chem. Phys., 122, p. 194501 (2005). 61. Shen, V.K. and P.G. Debenedetti. J. Chem. Phys., 111, p. 3581-3589 (1999).
62. Jorgensen, W.L. and D.L. Severance. J. Amer. Chem. Soc., 112, p. 4768-4774 (1990). 63. Cacelli, I., et al. J. Amer. Chem. Soc., 126, p. 14278-14286 (2004).
64. Bacon, G.E., N.A. Curry, and S.A. Wilson. Proc. Roy. Soc. London, 279, p. 98-110 (1954). 65. Bridgman, P.W. J. Chem. Phys., 9, p. 794-797 (1941).
66. Akella, J. and G.C. Kennedy. J. Chem. Phys., 55, p. 793-796 (1971). 67. Azreg-Ainou, M. J. Cryst. Growth, 299, p. 195-205 (2007).
68. Azreg-Ainou, M., A. Huseynov, and B. Ibrahimoglu. J. Chem. Phys., 124, p. 204505 (2006). 69. Craven, C.J., et al. J. Chem. Phys., 98, p. 8236-8243 (1993).
CHAPTER 2: SURFACE-MEDIATED NUCLEATION IN THE SOLID STATE POLYMORPH TRANSFORMATION OF TEREPHTHALIC ACID
Reproduced in part with permission from G.T. Beckham, B. Peters, C. Starbuck, N. Variankaval, and B.L. Trout, "Surface-Mediated Nucleation in the Solid State Polymorph Transformation of Terephthalic Acid", J. Amer. Chem. Soc., 129, 4714- 4723 (2007).
2.1 Introduction
As described in Chapter 1, polymorphism is the ability of a system to pack into different crystal lattices while retaining the same chemical composition'. It is a well known phenomenon with important technical and financial implications in a diverse range of areas in which crystalline materials play a significant role, such as geophysics2, energy storage3, biominerals4' 5, nonlinear optical materials6, and pharmaceuticals7-10. Polymorphs typically
exhibit different physical and chemical properties, thus representing an excellent framework for the study of structure-property relationships. The property differences between polymorphs can affect process and product development. The transformation to an undesired polymorph in the pharmaceutical industry, for instance, can lead to different bioavailability in the target organism, which could render the drug ineffective or increase its potency to a dangerous limit11. One prominent case is Abbott Laboratories' AIDS drug, Ritonavir: a more stable polymorph appeared after a manufacturing process was developed for its production, leading to significant production setbacks2
Polymorph transformations often occur in the solid state. Mnyukh states that, as of 1998, over 160 mechanisms are reported for solid state polymorph transitions13. However,
presently there is no definitive, verified model of the molecular mechanism of solid state polymorph transformations in molecular crystals. Two of the most common mechanisms proposed in the literature are 1) nucleation and growth13-17 and 2) concerted, or martensitic, transformations8, 9. As Tuble et al. point out, however, there is increasing evidence that transformations thought to be martensitic in nature, actually occur via a nucleation and growth mechanism 3' 18. An accurate model which describes this process on a molecular level would provide an improved understanding of the potentially localized mechanism of solid state polymorph transformations in molecular crystals, and could ultimately provide the necessary knowledge for a priori selection of processing parameters to promote or prevent transformation from one polymorph to another.
A specific molecular crystal that exhibits transformations between polymorphs is terephthalic acid, [p-C6H4-(COOH)2], which has three known polymorphs, designated as forms I-III20, 21 Our work focuses on the transformation between forms I and II, both of which pack in tric linic lattices. In a paper that for the first time demonstrated structural polymorph stabilization via twinning, Davey et al.22' 23 experimentally showed that form II is the more stable polymorph at room temperature and pressure. They also found that the transformation from form I to form II occurs in a temperature range from room temperature to 90 'C. The same authors noted that the transformation is often accompanied by a large release of mechanical energy, sufficient to make the crystal jump during the phase transition. In addition, from their microscopy studies, Davey et al.23 conclude that the overall process appears martensitic in nature. Based on an examination of the crystal structures, the authors propose a chain slide and rotation mechanism for the single crystal transformation. It should be stressed, however, that the intent of the two studies by Davey et al. was not to determine the mechanism of transformation, but rather to determine the most stable single-crystal form and then to address the question of stabilization of the metastable form in industrial crystals. Their work forms the basis and inspiration for this investigation.
Determining pathways of polymorph transformations at the molecular level is difficult from an experimental standpoint, due to the difficulty in characterizing localized fluctuations in crystal structures. As a result, the majority of studies concerned with molecular crystalline
systems typically characterize the equilibrium properties of polymorphs, rather than definitively ascertaining the molecular level events leading to transformations. Sophisticated molecular simulations, however, provide approaches that could potentially address these processes. These approaches have successfully addressed simpler problems. For example, nucleation has been studied for the freezing of a Lennard-Jones fluid24, NaCl nucleation from solution25, and the freezing of water26. The present study focuses on investigating the
molecular level events leading to the transformation in TPA from form I to form II.
2.2 Overview
To determine the transformation mechanism for any process, it is necessary to determine the reaction coordinate, or the single variable that describes the system along the reaction pathway2°. Knowledge of the reaction coordinate, and hence the mechanism, can provide
To ascertain the reaction coordinate for any system, one must perform three steps: 1. Sample the configurations in the region in which the transformation of interest occurs. 2. Approximate the reaction coordinate as a function of physically relevant parameters. 3. Validate the reaction coordinate with committor probability analysis.
Standard molecular dynamics (MD) or Monte Carlo methods can readily sample regions of stability. However, when studying transitions of interest, standard methods are not widely applicable because the transition states are typically short lived and infrequently visited. Instead one must utilize techniques designed to sample transition state regions in a more efficient manner (Step 1). Transition path sampling [TPS], a trajectory space Monte Carlo procedure, is a powerful method for sampling the ensemble of transition pathways in complex systems27-31. A recent extension of TPS, aimless shooting32, is especially useful for obtaining reaction coordinates with informatics approaches.
Once adequate sampling of the transition state region is completed, the reaction coordinate is approximated as a function of physically relevant parameters (Step 2). These parameters are termed order parameters (OP's), which describe properties of the system along reactive trajectories. Types of OP's range from bond distances33 to parameters that measure the coordination numbers and orientations25, 34, 35. For a given system, many OP's will change "adiabatically" along the reactive trajectories. A reaction coordinate, however, is one or more OP's that completely quantify the dynamical progress of the system along the reaction pathway31.
The typical method to determine the most appropriate reaction coordinate until recently was trial and error. Several recently published methods now allow one to determine the reaction coordinate in a more systematic manner32, 36-38 In this study, likelihood maximization is applied to screen candidate OP's to determine the OP or set of OP's that best approximates the reaction coordinate32
To validate the approximate reaction coordinate, one determines the average probability of reaching the product basin from the transition state region (Step 3). This method is known as committor probability analysis31, 39-41. If the true reaction coordinate is known, then firing
trajectories randomly from any configuration on the transition state isosurface should result in an equal number of trajectories that reach the reactant and product basins.
We apply this scheme to the solid state polymorph transformation in terephthalic acid (TPA). This chapter is organized into three sections: first, the details of the methodology are described. This includes the development and screening of the potential, the molecular simulation details, and the construction of the system sizes and shape. Details of the aimless shooting and likelihood maximization algorithms are also provided. Next, results are summarized for the harvesting of initial trajectories for two system sizes and from the likelihood maximization algorithm. Qualitative verification for the models obtained from likelihood maximization is given. Finally, a discussion and conclusions are provided highlighting the physical insight gained into the TPA polymorph transformation.
2.3 Methodology
This section explains the construction of the TPA crystals, and the development and validation of the CHARMM molecular force field. The order parameters that are screened as approximations to the reaction coordinate are described, as well as the computational methods of aimless shooting and likelihood maximization that are applied to the transformation of the TPA crystals. A new method is introduced to harvest independent configurations for verifying the reaction coordinate approximation, and the histogram method is also detailed.
2.3.1 System Description
Adjacent molecules in TPA are connected via 1-dimensional hydrogen-bonded carboxylic acid dimers, termed synthons42. This particular motif is ubiquitously found in molecular organic crystals. These chains, or supramolecular synthons, pack in 2-dimensional sheets. As discussed by Bailey and Brown20, neighboring chains in the form I crystal lie with benzene rings adjacent to the carboxylic acid groups in the next chain; in form II, the carboxylic acid groups from neighboring chains are adjacent to one another. The layers of chains in form I, however, lie with the benzene rings in line, whereas for form II, the benzene rings pack
alternately with the carboxylic acid groups.
Two system sizes are studied in full detail: a 6x6x6 and a 7x7x7 geometry. These sizes correspond to 216 and 343 molecules, respectively. Figures 2-1 and 2-2 illustrate the crystal
shapes for the 216 molecule system seen from the b and a axis views for forms I and II, respectively. The crystal shapes and morphologies approximate the TPA crystals studied by
Davey et a123. It should be noted that 6x6x6 is counted by the number of molecules in the supramolecular synthon, not the crystal unit cells: e.g., note that in Figure 2-1, the chains for both forms are 6 molecules long and there are 6 sets of chains in both chain-perpendicular dimensions. In addition, all molecules are hydrogen bonded through the carboxylic acid group to at least one neighbor. The experimental lattice parameters for the crystals are given in Table 2-1. The lattice vector a is equivalent for the two structures as it is the measure of the supramolecular chain length.
The crystal configurations are adopted from structures reported by Bailey and Brown. In the original crystal structure determination, the hydrogen positions are not reported for form II. Hydrogen atoms are therefore added to the molecules with the corresponding bond lengths and angles found in form I. As no constraints (such as SHAKE43) are used either in minimization or molecular dynamics, any minor errors in the hydrogen positions leading to unfavorable configurations are eliminated.
a- c
Figure 2-1. Form I of the 216 molecule (6x6x6) TPA crystallite from the b-axis view (left) and a-axis views (right). Hydrogen bonds that form the supramolecular synthons are shown in red-dotted lines between the carboxylic acid groups on each molecule.
a c
Figure 2-2. Form II of the 216 molecule (6x6x6) TPA crystallite from the b-axis view (left) and a-axis views (right). Hydrogen bonds that form the supramolecular synthons are shown in red-dotted lines between the carboxylic acid groups on each molecule.
Table 2-1. Lattice parameters from the experimental crystal structures.
Form I Form II a 9.54 9.54 b 3.19 5.02 c 6.44 5.34 (a 87.25 86.95 03 126.27 104.9 y 107.36 134.65
2.3.2 Force Field Development
Empirical force fields may not be directly suitable for modeling molecular crystals, especially if the parameters are fit using scenarios that are incongruous with crystal packing 8' 44, 45. A modified CHARMM potential" is thus applied in the simulations. Bond, angle, dihedral, and Lennard-Jones parameters (with the exception of one) are taken from the CHARMM 27 force field library. Since original Lennard-Jones parameters for the phenyl hydrogens are fit to hydration energy, which makes them unsuitable to model a packed crystal, a range of phenyl hydrogen Lennard-Jones radii is tested. In addition, partial atomic charges are extracted from single point energy calculations on a single gas phase TPA molecule with Gaussian 0347. The B3PW91 density functional48 with 6-311G++** basis set is employed. Following the approach of Tuble et al.18, partial atomic charges are calculated with both the Merz-Singh-Kollman49, 50 (MSK) and ChelpG51 schemes. Since the intramolecular geometry does not differ significantly between forms I and II, there is little difference in the partial charges calculated between molecules corresponding to the two polymorphs.

![Figure 1-2. Illustration of trial moves in transition path sampling [TPS]. Trajectory 2 is generated by perturbing the momentum slightly at a randomly selected point along trajectory 1, and propagating the forward and reverse directions alo](https://thumb-eu.123doks.com/thumbv2/123doknet/14436847.516176/15.918.136.779.113.278/illustration-transition-trajectory-generated-perturbing-trajectory-propagating-directions.webp)