* COMPOSITIONAL HETEROGENEITY WITHIN OCEANIC POM:
A STUDY USING FLOW CYTOMETRY AND MASS SPECTROMETRY
by
Elizabeth C. Minor
B.A., The College of William and Mary(1992)
submitted in partial fulfillment of the requirements for the degree of
Doctor of Philosophy
at theMassachusetts Institute of Technology
and theWoods Hole Oceanographic Institution
March 1998© Elizabeth C. Minor 1998 All rights reserved
The author hereby grants MIT and WHOI permission to reproduce and to distribute copies of this thesis in whole or in part.
Signature of author
Joint Program in Oceanography, Massachusetts Institute of Technology/Woods Hole Oceanographic Institution
Certified by
Timothy I. Eglinton Thesis Supervisor
Accepted by.
Edward A. Boyle Chair, Joint Committee for Chemical Oceanography Massachusetts Institute of Technology/W ods Hole Oceanographic Institution
MASSACHU .LWE
Compositional heterogeneity within oceanic POM: A study using flow cytometry and mass spectrometry
Elizabeth C. Minor
Submitted in March 1998 in partial fulfillment of the requirements for the degree of Doctor of Philosophy at the Massachusetts Institute of Technology and the Woods Hole Oceanographic Institution
Abstract
This thesis applied direct temperature-resolved mass spectrometry (DT-MS), flow cytometry, and multivariate statistics to the study of marine particulate organic matter (POM) collected from the North Atlantic.
DT-MS is an important asset to marine organic geochemistry as a single two minute analysis (with 16 eV, EI* ionization) provides information on polysaccharides, proteins, and lipids within concentrated and desalted samples. Although the molecular-level information obtained with DT-MS is less detailed than traditional analyses of specific compound classes, DT-MS can act as a useful molecular-level screening
technique (as illustrated in this thesis), indicating what samples and compound classes to investigate more thoroughly.
In addition to its rapidity, DT-MS only reqires microgram quantities of sample. This sensitivity permits the coupling of DT-MS and preparative flow cytometry. In this thesis, preparative flow cytometry was used to isolate "phytoplankton" and "detritus"
(i.e., non-phytoplankton particles) in 2-+53 gm POM. The molecular-level differences between and within small-particle POM (<53 gm), large-particle POM (>53 pm),
"phytoplankton" and "detritus" were explored using DT-MS and discriminant analysis. For POM collected from the Mid-Atlantic Bight and from Great Harbor, Woods Hole, MA, small-particle POM contained more phytoplankton chemical characteristics than large-particle POM. In Great Harbor, the molecular-level characteristics of large-particle POM indicated a significant grazer biomass component. On the MAB (in March 1996),
the large-particle POM appeared more phytodetrital. "Phytoplankton" was enriched in protein, chlorophyll and lipids as compared to "detritus," which was enriched in selected polysaccharides.
As the polysaccharide composition of POM subclasses was a major source of variation, polysaccharides in selected samples were further studied using ammonia and deuterated ammonia CI*DT-MS. Principal component analysis of the resulting NH3-CI*
spectra indicated that the majority of polysaccharide variation in the selected samples could be explained by a component that appeared related to the degree of degradation of the organic matter.
The results from this thesis, coupled with existing work on particulate and dissolved organic matter, were used to support a modified "size-reactivity continuum model" of organic matter cycling.
Aknowledgements
This thesis would never have been finished without the help of a great many people. I would like to thank my advisor Tim Eglinton for introducing me to the field, giving me free reign with lots of instruments, and convincing me to do more than I thought I could. Thanks to my committe members are also in order. Without Rob Olson's expertise, the flow cytometer might be in even more pieces today than it was when I started. Jaap Boon's perspective as a mass spectrometrist helped greatly in the interpretation of DT-MS data. Phil Gschwend's inciteful questions have given the thesis more coherence, comprehensibility, and depth, though Phil probably still wishes for more "oceanography." Thanks also to Jean Whelan and John Hayes for their suggestions and encouragement. Thanks to Carl Johnson for his mass spectrometry guidance and his patience with questions, frustration, and my choice of lab music. The following current and former Fye, Redfield, and Clark folks should also be recognized for their helpfulness and patience: William Little, Bob Nelson, Nelson Frew, Lorraine Eglinton, Dan Repeta, Kathy Barbeau, Ann Pearson, Liz Kujawinski, Lihini Aluwihare, Jim Moffett, Bryan Benitez-Nelson, Joyce Irvine, Diana Franks, Fredrica Valois, John Waterbury, Alexi Shalapyonok, Luda Shalapyonok, Michele Durand, Erik Zettler, and Dave Kulis.
A large portion of this thesis work took place away from the WHOI campus. Therefore, thanks are also in order for the FOM-Amolf folks including: Jos Pureveen, Gert Eijkel, Jerre van der Horst, Ron Herren, Peter Arisz, Oscar van den Brink, Gisela, and Sophie Peulve. The captains and crews of the R/V Columbus Iselin, the R/V Cape
Henlopen, and the R/V Endeavor should be ackowledged for sampling assistance. The
following people also lent a hand when sampling got difficult: Ken Buesseler, John Andrews, Melissa Bowen, Penny Chisholm, Bob Chen, Maureen Conte,...
Special thanks are due to the Houses of Angst and Good Food: Kathy Barbeau, Sue Bello, Lisa Max, Laura Magde, Jay Austin, Kelsey Jordahl, Jamie Pringle, Tad Snow. They provided support and encouragement, cared for Jack the Iguana when necessary, and listened to me "when I needed to vent." Jay, in particular, should be thanked for listening, lab assistance, graphics and computer assistance, proof reading, good cooking, bad puns, and more.
This acknowledgements section would not be complete without a mention of my parents, who, when I was growing up, were willing to find space in the house for enough books, a trunkful of rocks, a carload of fossils, a microscope, a stray cat, and a lizard. I know I would never have made it this far without their help.
Finally, this work was funded by the following agencies: the U.S. National Science Foundation (OCE-9503455), the U.S.Department of Energy-Ocean Margins Project (DE-FG02-92ER61428), and the Foundation of Fundamental Research on Matter (FOM) financed by the Dutch Organization of Scientific Research.
Table of Contents Abstract... ... 3 Acknowledgem ents... 5 Table of Contents...7 List of Tables...10 List of Figures...11 Chapter 1: Introduction General... 15
Chemical characteristics of phytoplankton... 17
Attenuation and modification of the primary producer signal... 19
Analytical techniques... 24
Cross-flow filtration... 25
Flow cytom etry... 26
Direct temperature-resolved mass spectrometry...28
M ultivariate analysis...33 References... 39 Chapter 2: Methods Introduction... 45 Experimental Analytical method... 46
Evaluation of filtration effects... 49
Evaluation of particle populations via flow cytometry vs microscopy...50
Analysis of the desalting procedure... 51
Determination and application of DT-MS response factors... 52
The comparison of DT-MS and HPLC measurements of POC/chlorophyll ratios...53
Procedural blanks... 54
Results and discussion...55
Sample handling: Contamination... 55
Sample handling: Filtration effects... 57
Sample handling: Flow cytometric separation of "phytoplankton" and "detritus"...61
Sample handling: The salt issue... 63
DT-M S considerations... 72
The comparison of DT-MS and HPLC measurements of POC/chlorophyll ratios...79
Conclusions... 82
References... 86
Chapter 3: DT-MS of North Atlantic suspended POM: An investigation of diglycerides, triglycerides, and phospholipids Abstract... 89
Introduction... 89
Experimental... 91
Results and Discussion Discriminant analysis (of spectra from DT-MS, 16 eV, EI)... 94
The "diglyceride signal"...101
Analysis of standards (EIr, NH3-CI*, ND3-CI* DT-MS)...101
Analysis of selected samples (EI*, NH3-CI*, ND3-CI* DT-MS)...106
Discussion of the "diglyceride signal"...110
Summary and Conclusions...116
References...118
Chapter 4: The compositional heterogeneity of particulate organic matter from the surface ocean: An investigation using flow cytometry and DT-MS A bstract... 12 1 Introduction...122
Experimental...123
R esults...134
Large-particle and small-particle POM: Average spectra...134
Large-particle vs small-particle POM: Discriminant analysis...140
"Phytoplankton" and "detritus": Average spectra...141
"Phytoplankton" vs "detritus": Discriminant analysis...150
Discussion...150
Summary and Conclusions...160
References...163
Chapter 5: Polysaccharides in oceanic POM as determined by chemical ionization DT-MS A bstract...167
Introduction...168
Experimental...169
Results Polysaccharides of POM subclasses...174
Discussion...187
Conclusions...195
References...197
Chapter 6: Molecular-level variations in POM subclasses along the Mid-Atlantic Bight Abstract...201
Introduction...202
Experim ental...203
Region of interest...206
Sampling method for molecular-level analyses...207
Flow cytometry...209
DT-M S and multivariate analysis...209
Ancillary data...210
Results Chlorophyll a concentrations and phytoplankton/ (phytoplankton + detritus) ratios...211
Large-particle POM ... 214 Sm all-particle POM ... 218 "Phytoplankton"...224 "Detritus"...228 Discussion...228 Conclusions...235 References...238
Chapter 7: Synthesis, conclusions, and future work General...241
A modified size-reactivity continuum model...244
Future work Organic matter cycling: Unresolved issues from this thesis...251
Additional areas for further research...253
References...256
Appendix 1: Characteristic ions in DT-M S...259
Appendix 2: GC-M S of selected samples...265
Extraction procedure...265
Results...268
Appendix 3: Ancillary data and EI* DT-MS spectra from the MAB and WHTS data sets...269
List of Tables
Chapter 1: Table Table
Chapter 2:
1.1: The major fatty acids in phytoplankton...18
1.2: Phytoplankton cultures used in the example of discriminant analysis...34
Table 2.1. Characteristic ions (16 eV, EI*) for common laboratory/ shipboard contaminants...55
Table 2.2. Characteristic ions chosen from DT-MS (16 eV, EI*) of selected standards... 72
Chapter 4: Table 4.1. Relative intensities of DT-MS signatures for lipid and biopolymer components in the average spectra of MAB POM...158
Table 4.2. Same as Table 3.1, but for the WHTS POM subclasses...158
Chapter 5: Table 5.1. Characteristic carbohydrate m/z values...173
Table 5.2. [POC]/[chlorophyll a] and (C/N)a ratios for POM samples...186
Chapter 6: Table 6.1. Ancillary data for M AB samples...212
Table 6.2. Variables used in correlation matrices...213
Appendix 1 Table Appendix 2: Table Appendix 3: Table Table Table A1.1. Characteristic ions in DT-MS...259
A2. 1. Compounds identified in GC-MS analysis of WHTS#5...266
A 3.1. M AB ancillary data...271
A 3.2. W H TS ancillary data...272
A3.3. Pigment results from HPLC analysis of WHTS and MAB samples...273
Table A3.4a. List of EI' DT-MS spectra from the MAB included in Appendix 3...275
A3.4b. List of EI* DT-MS spectra from the WHTS included in Appendix 3...276
List of Figures Chapter 1:
Fig. 1.1. The major compound classes found in oceanic organic matter...16
Fig. 1.2. Schematic of flow cytometric sorting...27
Fig. 1.3. Schem atic of DT-M S... 29
Fig. 1.4. DT-MS (low voltage EI) analysis of Pavlova lutheri...31
Fig. 1.5. DT-MS spectra from analysis of (a) whole cells and (b) a solvent extract of Isochrysis galbana...32
Fig. 1.6. Score plot from discriminant analysis of algal culture DT-MS spectra...36
Fig. 1.7. Spectra illustrating the loadings of variables in DFl and DF2 from Fig. 1.6...37
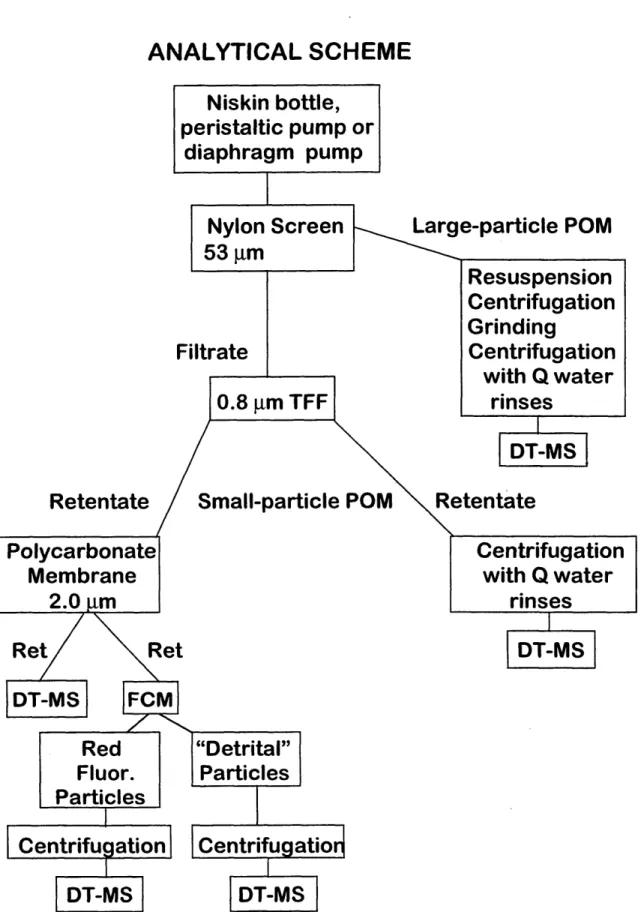
Chapter 2: Fig. 2.1. Analytical scheme for oceanic large-particle and small-particle POM ... 47
Fig. 2.2. DT-MS spectrum of a strongly contaminated Sargasso Sea sample... 56
Fig. 2.3. Flow cytometry "windows" used for determining filtration effects...58
Fig. 2.4. FCM analysis of unfiltered and filtered aliquots of two seawater samples reported as (a) counts/mL seawater and (b) the ratio of phytoplankton counts to total phytoplankton plus detritus counts...59
Fig. 2.5. (a) A comparison of phytoplankton counts/mL seawater as determined by flow cytometry and by microscopy and image analysis. (b). A comparison of the detritus counts/mL seawater as determined by flow cytometry and the detrital carbon content/mL seawater as determined by microscopy and image analysis...62
Fig. 2.6a. Score plot for principal component analysis of algal samples with and w ithout salt... 64
2.6b. Loadings plot for Principal Component 1...65
Fig. 2.7a. DT-MS (16 eV, EI*) of an Emiliana huxleyi culture suspended in a small amount of salt-water culture media b&c. Replicate DT-MS analyses of the same culture after desalting...67
Fig. 2.8. Elemental carbon analysis of each step of the desalting procedure for small-particle POM...70
Fig. 2.9. Elemental carbon analysis of the grinding and desalting procedure for >53 gm particles...71
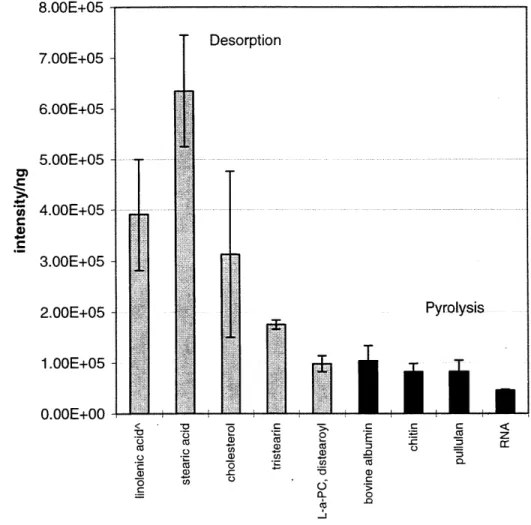
Fig. 2.1Oa. DT-MS (16 eV, EI*) response factors for selected standards in terms of TIC area/ng of standard...74
2. 1Ob. For selected standards, the amount of TIC intensity that can be accounted for by characteristic ions or ion series...75
2.1 Oc. Response factors for characteristic ions of standards
analyzed via DT-MS...77
Fig. 2.11 a. DT-MS response factors of selected fatty acids and sterols in standards with and without a particle (A1203) matrix. 2.11 b. The intensity of a constant concentration of caffeine standard in various concentrations of POM...78
Fig. 2.12. The comparison of POC/chlorophyll as determined by elemental analysis/HPLC and by DT-MS...80
Fig. 2.13a. DT-MS of a flow cytometry blank and a "phytoplankton" sample...83
2.13b. DT-MS of a homogenization/desalting procedure blank and a large-particle POM sample...84
Chapter 3: Fig. 3.1. R/V Cape Henlopen #9512 POM sampling stations...92
Fig. 3.2. Score plot from discriminant analysis of suspended POM samples...95
Fig. 3.3. Reconstructed difference spectra for Discriminant Function 1...96
Fig. 3.4. Reconstructed difference spectra for Discriminant Function 2...97
Fig. 3.5a. Seawater temperature vs Discriminant Function 1 scores 3.5b. Seawater salinity vs Discriminant Function 2 scores...99
Fig. 3.6. DT-M S analyses of the triglyceride trilinolein...102
Fig. 3.7. DT-MS analyses of the diglyceride glyceryl-1-palmitin-3-olein...103
Fig. 3.8. DT-MS analyses of the phospholipid L-x-phosphatidylcholine, j-oleoyl, y-palmitoyl...104
Fig. 3.9a, b, & c. EI*, NH3-CI*, and ND3-CI* DT-MS analyses of suspended POM sample 7B...107
Fig. 3. 10a, b, & c. EI*, NH3-CI*, and ND3-CI* DT-MS analyses of suspended POM sample 11 A-CM...108
Fig. 3.11 a & b. EI and NH3-CI* DT-MS analyses of suspended POM sample 5C-S...109
Fig. 3.12. Seawater fluorescence vs seawater temperature...113
Chapter 4: Fig. 4.1. EN279 and W HTS sampling stations...124
Fig. 4.2. The analytical scheme used for the MAB and WHTS samples...126
Fig. 4.3a. The average spectrum for large-particle POM from the MAB...130
4.3b. The average spectrum for large-particle POM from the WHTS...131
Fig. 4.4a. The average spectrum for small-particle POM from the MAB...132
4.4b. The average spectrum for small-particle POM from the WHTS...133
Fig. 4.5a. The score plot from discriminant analysis of large-particle and small-particle POM from the MAB...136
Fig. 4.6a. The score plot from discriminant analysis of large-particle and
small-particle POM from the WHTS...138
4.6b. The reconstructed spectrum for Discriminant Funtion 1...139
Fig. 4.7. The flow cytometry sort windows for sample WHTS 13...142
Fig. 4.8a. Flow cytometric analyses of total >2 gm POM, "phytoplankton," and "detritus" from the MAB...143
4.8b. Same as Fig 4.8a, but fot the WHTS sample set...144
Fig. 4.9a. The average spectrum for "phytoplankton" from the MAB...146
4.9b. The average spectrum for "phytoplankton" from the WHTS...147
Fig. 4. 1Oa. The average spectrum for "detritus" from the MAB...148
4. 1Ob. The average spectrum for "detritus" from the WHTS...149
Fig. 4.11. The total ion current and mass chromatograms for m/z 76, 64, 96, 152 from DT-MS analysis of a "detritus" sample from the MAB...151
Fig. 4.12a. The score plot from discriminant analysis of MAB "phytoplankton" and "detritus"...152
4.12b. The reconstructed spectrum for Discriminant Function 1...153
Fig. 4.13a. The score plot for discriminant analysis of WHTS "phytoplankton" and "detritus"...154
4.13b. The reconstructed spectrum for Discriminant Function 1...155
Chapter 5: Fig. 5.1. MAB and WHTS sampling stations...170
Fig. 5.2. Schematic of the three major forms of polysaccharide dissociation during DT-MS...175
Fig. 5.3a. NH3-CI mass spectrum for sample 8-S 5.3b. NH3-CI* mass spectrum for sample 8-G...177
Fig. 5.4a. NH3-CI mass spectrum for sample WHTS 13-S 5.4b. NH3-CI mass spectrum for sample WHTS13-G...178
Fig. 5.5a. NH3-CI mass spectrum for sample WHTS 13-P 5.5b. NH3-CI mass spectrum for sample WHTS 13-D...180
Fig. 5.6. Score plot for principal component analysis of NH3-CIr mass spectra...182
Fig. 5.7a. Reconstructed spectrum for Principal Component +1...183
5.7b. Reconstructed spectrum for Principal Component -1...184
Fig. 5.8a. NH3-CI* DT-MS of UDOM from Georges Bank 5.8b. NH3-CI* spectrum of DPP72...193
Chapter 6: Fig. 6.1. M AB sampling stations...204
Fig. 6.2. AVHRR image (March 4, 1996, 12:08:49 GMT) illustrating the shelf/slope front in the MAB...205
Fig. 6.3. Analytical scheme for large-volume POM samples...208 Fig. 6.4. Score plot of Discriminant Function 1 from analysis of
MAB large-particle POM...215 Fig. 6.5. Reconstructed spectrum of DF1 from analysis of
MAB large-particle POM...216 Fig. 6.6a. Plot of DF1 score (from Fig. 6.4) vs seawater temperature
6.6b. Plot of DFl score vs the unfiltered seawater ratio of
phytoplankton/total analyzed particles 6.6.c. Plot of DFl score vs phytoplankton/total analyzed particles
in 2.0-+53 gm POM...217 Fig. 6.7. Score plot of Discriminant Function 1 vs Discriminant
Function 2 from analysis of MAB small-particle POM...220 Fig. 6.8. Reconstructed spectrum for DFl from Fig. 6.7...221 Fig. 6.9. Reconstructed spectrum for DF2 from Fig. 6.7...222 Fig. 6. 1Oa. Plot of DF1 score from analysis of small-particle POM
vs P0 4 concentration
6. 1Ob. Plot of DF2 score vs. [POC]/[chlorophyll a]...223 Fig. 6.11. Score plot for discriminant analysis of MAB
"phytoplankton"...225 Fig. 6.12. Reconstructed spectrum for DF1 from Fig. 6.11...226 Fig. 6.13a. Plot of DF1 score from analysis of MAB
"phytoplankton" vs [POC]/[chlorophyll a] 6.13b. Plot of DF1 vs the ratio of phytoplankton/total analyzed
particles in 2.0-+53 gm samples...227 Fig. 6.14. Score plot showing DFl vs DF2 from analysis of MAB
"detritus"...229 Fig. 6.15. Reconstructed spectrum from DF1 in Fig. 6.14...230
Chapter 7:
Fig. 7.1. Score plot of discriminant analysis of large-particle POM
and "phytoplankton" from the MAB...246 Fig. 7.2. Reconstructed mass spectrum for DF1 from Fig. 7.1...247 Fig. 7.3. The modified size-reactivity continuum model...250
Appendix 2:
Fig. A2.1 GC-M S of W HTS#5...267
Appendix 3:
Plots of total ion chromatograms and mass spectra for the samples
Chapter 1 Introduction General
The major compound classes found in oceanic organic matter include proteins, carbohydrates, nucleic acids, aminosugars, and lipids (Fig. 1.1). These compounds perform different functions in living organisms, and the common functions (as discussed in Voet and Voet, 1990; and Chester, 1990) will be mentioned here. Proteins,
biopolymers of amino acids, are involved in the transport of molecules through cell membranes. As enzymes, proteins also catalyze reactions both within and outside a cell. Carbohydrates serve energy storage and structural functions, as illustrated by the
respective roles of starch in plants and cellulose in trees. Aminosugars, compounds in which a sugar -OH group has been replaced by an amine, are found (as chitin) in the exoskeletons of copepods and crabs and (as peptidoglycan) in bacterial cell walls.
Nucleic acids (as DNA) carry the genetic information of a cell and (as RNA) provide this information to sites of protein synthesis. Lipids, operationally defined as insoluble in water but soluble in organic solvents, perform fairly diverse functions. Triglycerides and wax esters are energy storage compounds. Triglycerides can also act as buoyancy
controls for a cell. Sterols are hormonal regulators and are also involved in determining membrane fluidity. Lipids are particularly important to the marine geochemist because, in their extractable form, they can be used as biomarkers indicating sources and
transformations of organic matter.
Reduced (organic) carbon enters the world ocean through two main sources: export from terrestrial ecosystems and autochthonous primary production.
Autochthonous primary production forms the base for food chains in the ocean and is generally the primary source of reduced carbon in surface oceans. Therefore, it is necessary to briefly describe the chemical characteristics of the main primary producers,
The major organic compound classes found in oceanic OM:
0
O
Amino acids: H2NCHC-OH
Proteins: (--NHCH-C-) n Carbohydrates: C6H1206 CH2OH CH2OH H OHH H 0 _ T-H 1oEH H OH H OH n a-amylose 0 Il C-O-C-R 0 11 C;-0-C-R 1 0 C-O-C-R triglyceride 0 II H3C(CH2)n-C--OH fatty acid C14:0 FA= myristic acid
C16:0 FA=palmitic acid Aminosugars: CH2OH H I 0 OH H OH H HO H H NH -c=o CH3 N-acetylglucosamine Nucleic acids: R- N N----0 0=P-0-R
-o
segment of a single DNA chain (the base is adenine)
sterol (cholesterol) 0 11 R-CHiO- C-R wax ester C18:0 FA=stearic acid
Fig. 1.1. The major compound classes found in oceanic organic matter. Lipids:
phytoplankton, as reported in the literature, before discussing the reactivity and fate of oceanic organic matter.
Chemical characteristics of phytoplankton
The relative abundance of lipids, protein, and carbohydrates in phytoplankton is relatively similar across species and class lines. Parsons et al. (1984) reported that the ash-free dry weight composition of phytoplankton (collected during logarithmic growth phase) ranges between 35 to 68% protein, 20 to 42% carbohydrate, and 4 to 16% lipid. Later work by Brown et al. (1996) found the composition of the diatom Thalassiosira
pseudonana (during logarithmic growth phase) to be consistent with these values, though
lipid percentages were slightly higher (23-31%, organic weight %) and carbohydrates to be slightly less prevalent (10-27%, organic weight %). These values are strongly
dependent upon growth phase, however, and may also vary with light regime or other factors (e.g., Brown et al., 1996). For example, as phytoplankton cultures shifted from logarithmic to stationary phase, the composition of T. pseudonana became depleted in protein and enriched in lipids and carbohydrate.
The lipid composition of phytoplankton has received considerable attention due to the use of cultured phytoplankton as feedstock in aquatic farming (e.g., Chu and Depuy,
1980; Volkman, 1989; Brown et al., 1996) and the use of lipids as biomarkers in the marine environment (e.g., Volkman, 1986; Prahl et al., 1988; and many others). A very brief sampling of this work will be discussed here. The principle lipids in three species of diatoms (determined by Lee et al.,1971, and reported in Parsons et al., 1984) are as
follows (in terms of percentage of total lipids): phospholipids (50 to 57%), triglycerides (12 to 16%), sterols (10 to 17%) free fatty acids (5 to 16%) and hydrocarbons (2 to 11%). These percentages are also affected by phytoplankton growth stage and other factors. Brown et al. (1996) reported a decrease in polar lipids (from 79-89% of total lipids to
48-Table 1.1. The major fatty acids in phytoplankton (from Volkman, 1989).
Phytoplankton class Major fatty acids
Bacillariphyceae 16:1 (n-7), 16:0, 14:0, 20:5(n-3) Cryptophyceae 18:4(n-3), 16:0, 18:3(n-3), 18:2 (n-6),
20:5 (n-3)
Chlorophyceae (analysis of Dunaliella) 16:0, 16:4(n-3), 18:2(n-6), 18:3(n-3) Prymnesiophyceae 16:0, 16:1 (n-7), 18:1 (n-9), 18:4(n-3),
20:5(n-3), 22:6(n-3)
Dinophyceae 16:0, 18:4(n-3), 20:5(n-3), 22:6(n-3)
and often 18:5(n-3)
57%) and an increase in triglycerides (from 10% to 22-45% of total lipids) as T.
pseudonana moved from logarithmic to stationary phase.
Fatty acids form a large proportion of the total lipid in phytoplankton as, in addition to existing as free fatty acids, they are major constituents of phospholipids and triglycerides. Their distribution in particulate organic matter (POM) has been used to indicate phytoplankton, zooplankton, and bacterial biomass contributions (as in Wakeham and Canuel, 1988; Conte, 1989; Columbo et al., 1996). The total fatty acid composition of phytoplankton classes has been reviewed by Volkman (1989), and the
major fatty acids found in each class are shown in Table 1.1. In addition to the
ubiquitous C16:0 fatty acid, other major phytoplankton fatty acids typically include C16:1, C16:4, C14:0, C18 (with various levels of unsaturation) and C2 0:5.
Sterols, like fatty acids, are also used as biomarkers in the marine environment. While a review of the literature on phytoplankton sterols is beyond the scope of this
introduction (see Volkman, 1986), it is worth mentioning three sterols that, while not unambiguous, can provide information on organic matter sources. 24-methylcholesta-5,22E-dien-3p-ol is often used as a diatom biomarker, while the presence of 4a,23,24 trimethyl-cholest-22-en-3p-ol, or dinosterol, is generally attributed to dinoflagellates. While cholesterol is synthesized by phytoplankton, it is a primary zooplankton sterol
(Volkman 1986), and is generally interpreted as an indicator of zooplankton biomass (as in Wakeham and Canuel, 1988).
Attenuation and modification of the primary producer organic matter signal
The organic matter produced during photosynthesis by phytoplankton in the surface ocean undergoes many reactions and physical transformations including incorporation into grazer biomass or egestion in fecal pellets (e.g., Harvey et al., 1987, Cowie and Hedges, 1996), incorporation into marine snow (e.g., Alldredge and Silver,
1988) and/or the dissolved organic matter pool, remineralization (the most likely eventual fate for organic carbon in the ocean, Hedges, 1992), and for a very small percentage
(<0.2% of marine primary production), burial in ocean sediments (Hedges, 1992). These chemical, biological, and physical processes not only affect the concentration of organic
matter in the water column -(or sediments) but substantially change the composition of the organic matter as well.
The attenuation and modification of the primary production organic matter signal within the oceanic water column has been explored in several ways. Vertical profiles of organic matter composition and flux have been used to obtain estimates of diagenetic reactivity (e.g., Wakeham et al., 1984; Hedges et al.,1988; Wakeham, 1997). Laboratory degradation experiments using phytoplankton cultures and various combinations of bacteria and heterotrophs have been used to monitor remineralization of organic matter (Westrich and Berner, 1984), the conversion of phytoplankton organic material into bacterial and/or grazer biomass (e.g., Harvey et al., 1987; Harvey and Macko, 1997) and the chemical composition of the remaining "detritus." Various size fractions of organic matter at field sites and within culture experiments have been analyzed to examine relationships among "sinking" particulate organic matter (POM), "suspended" POM, colloidal (or ultrafiltered) dissolved organic matter (UDOM), and/or dissolved organic matter (DOM) (e.g., Skoog and Benner, 1997, Biddanda and Benner, 1997).
Depth has been considered a proxy for extent of diagenesis, allowing the effects of diagenesis to be monitored by sediment trap deployments and/or filtration of particles at different depths (e.g., Wakeham et al., 1984; Hedges et al., 1988; Wakeham and Canuel, 1988; Wakeham and Lee, 1993; Hernes et al., 1996; Wakeham et al., 1997). Such work has led to a general measure of the reactivity of different components of POM. For example, comparison of the fluxes of organic material intercepted by sediment traps over different depths at sites in the Sargasso Sea, the equatorial Atlantic, the north Pacific, the California current, and the Peruvian upwelling region has led to the following diagenetic sequence (from most to least reactive): "hydrolyzable amino acids>total fatty
acids>lipids>POC>total particulate matter" (Wakeham et al., 1984). However, a somewhat different diagenetic sequence emerges from recent work in the equatorial Pacific: "pigments>>lipids>amino acids>carbohydrates" (Wakeham et al., 1997). Studies of sediment trap and sediment samples from a coastal site (Dabob Bay in Puget Sound, Washington) also indicate that plant pigments are more reactive than plankton lipids and that both of these are more reactive than carbohydrates (Hedges et al., 1988). Fluxes within compound classes have also been determined (e.g., for aldoses, Hernes et al., 1996; for lignin-derived phenols and for neutral sugars, Hedges et al., 1988; for lipids, Wakeham et al., 1984; Wakeham and Canuel, 1988; for amino acids, Lee and Cronin,
1984).
Laboratory degradation experiments use time rather than depth as a measure of the degree of diagenesis. From such experiments, rate constants for degradation of algal organic matter have been determined (Emerson and Hedges, 1988, and references therein). These constants appear dependent upon the experimental time scale, which is probably due, at least in part, to the fact that the particulate organic carbon consists of many compound classes with varying levels of reactivity (Westrich and Berner, 1984; Emerson and Hedges, 1988, and references therein). Such varying reactivity levels have led to the "multiple-G" model of organic matter degradation (Westrich and Berner, 1984; Boudreau and Ruddick, 1991 and references therein) and its refinement into "reactive
continuum" models (Middelburg, 1989; and Boudreau and Ruddick, 1991). In addition to the monitoring of bulk organic matter degradation, laboratory degradation studies have also monitored the preferential degradation of various compound classes. For example, Harvey et al. (1995) monitored the decay of Thalassiosira weissflogii (a diatom) and
Synechococcus sp. (a coccoid cyanobacterium) under oxic and anoxic conditions in a
flow-through system in which macrozooplankton grazers were excluded. They found that, under oxic degradation, carbohydrates are most reactive, followed by protein and then lipid. Under anoxic conditions, however, protein has higher degradation rates than carbohydrates.
The attenuation of the primary producer organic matter signal by zooplankton grazing has also been studied in laboratory experiments. These have varied widely in emphasis, from evaluations of the effects of grazing on phytoplankton lipid biomarkers (e.g., Harvey et al., 1987) to studies of the assimilation of total organic matter and quantitatively important substituents (proteins and carbohydrates, e.g., Cowie and Hedges, 1996). In feeding experiments with the dinoflagellate Scrippsiella trochoidea and the copepod Calanus helgolandicus, Harvey et al. (1987) found that polyunsaturated fatty acids (PUFA) are preferentially assimilated, and proposed that zooplankton grazing may be responsible for the lack of PUFA in sediment trap material. Harvey et al. (1987) also found that sterols were assimilated by copepods while stanols were not. Cowie and Hedges (1996) monitored the ingestion of 14C-labelled diatoms (T. weissflogii) by the copepod Calanus pacificus. They found the following sequence of digestion efficiencies
(from highest to lowest): "total N>organic C>total chlorophyll-type pigments." Amino acid and neutral aldose analyses also indicated that diatom intracellular material was preferentially assimilated.
Investigations of different size classes of organic material have also been undertaken in an attempt to further understand relationships between "sinking" POM, responsible for most of the vertical flux of organic matter in the oceans, "suspended" organic matter, responsible for most of the particulate organic mass in the ocean (McCave
et al., 1975 and Bishop et al., 1977), ultrafiltered or colloidal dissolved organic matter (UDOM), the largest "concentratable" pool of dissolved organic matter at the present time (Benner et al., 1992), and bulk DOM, the largest reactive reduced carbon pool in the
oceans.
Studies of the lipid contents of suspended and sinking POM (Wakeham and Canuel, 1988; Conte, 1989) indicate that these two pools of organic matter are chemically distinct but that suspended organic matter is more labile than the sinking pool over the entire depth range studied (the euphotic zone to 1000-1500 m). These results contradict two previously existing views concerning the relationship between these pools. It has been proposed that suspended POM should be either more refractory than sinking POM, due to a longer residence time in the water column (Tanoue and Handa, 1980), or
chemically similar to sinking POM, due to exchange between the two particle pools (Bacon et al., 1985). Results from such work on lipids (e.g., Wakeham and Canual, 1988; Conte, 1989) indicate that the distinction of POM based solely on whether it is sinking or suspended cannot fully resolve issues concerning the organic matter cycle in the ocean. Both Wakeham and Canuel (1988) and Conte (1989) suggest that the sinking particle pool contains a subset that behaves relatively conservatively (the measured sinking pool) and a subset (previously unmeasured or incorporated into other measurements) which contributes labile organic matter to the suspended pool (Conte, 1989; Wakeham and Canuel, 1988).
The lipid studies of sinking and suspended POM also appear to contradict the "size reactivity continuum model" proposed by Amon and Benner (1996) based on results from bacterial degradation experiments using different size classes of DOM, and
extended to oceanic POM in Skoog and Benner (1997). In this model, as in the Tanoue and Handa (1980) hypothesis mentioned in the previous paragraph, particles become less bioreactive and more diagenetically altered as their size decreases.
The complexity of organic matter cycling in the water column evident from the above discussion indicates the following needs: (i) to understand the composition of
organic matter particles at a level beyond the simple definitions inherent in present isolation techniques, and (ii) to encompass as broad a range of biochemicals as possible.
In this thesis the relationships among and within size classes of organic matter are further explored using direct temperature-resolved mass spectrometry (DT-MS). With low voltage electron impact ionization (EI*, 16 eV), DT-MS provides molecular-level information over a wide range of compound classes. As only microgram quantities of material are needed, larger data sets can be screened for molecular-level variations, which can be further explored by additional mass spectrometry techniques (as in Chapters 3 and
5) or by other more traditional approaches (see Appendix 2). DT-MS with ammonia chemical ionization provides polysaccharide oligomer information (also on microgram quantities of sample) and should therefore prove a useful complement to traditional neutral aldose analyses. It is used in Chapter 5 to explore polysaccharide variations in
>53 pM and >2 gm, <53gm POM.
The sensitivity of DT-MS also opens an additional avenue for exploring the attenuation of the primary production organic matter signal in the oceans. DT-MS can be coupled with flow cytometric sorting to provide molecular-level characterization of morphologically (or optically) discrete particle types such as phytoplankton in natural suspended POM samples (as in Chapters 4 and 6). This allows the direct comparison between primary producer organic matter and that of bulk small-particle (>2 pm, <53
gm) POM, bulk large-particle (>53 gm) POM, and "detritus," defined here as the non-chlorophyll fluorescing pool of small-particle POM. The variations in chemical
composition among these POM subclasses are discussed in Chapter 4. Variations within these subclasses as a function of location along the Mid-Atlantic Bight are included in Chapter 6. Chapter 7 includes discussion of the attenuation of the primary production organic matter signal along with general conclusions and suggestions for future work.
Analytical techniques
As mentioned above, direct temperature-resolved mass spectrometry (DT-MS) using low-voltage electron impact ionization (16 eV EI) is used to provide rapid broad-band molecular-level characterization of POM samples. It is used here in conjunction with multivariate analysis techniques (principal component analysis and discriminant analysis) to explore chemical variations among and within POM subclasses. Since DT-MS requires only microgram quantities of sample, it is a logical counterpart to flow cytometric separation of "phytoplankton" and "detritus" from >2 pm, <53 grm POM.
Initial 16 eV EI* characterization of POM data sets and multivariate exploration of this data indicates chemical variations worthy of further, more detailed
characterization. While detailed chemical assays are beyond the scope of the present study, different modes of MS analysis are used to provide further insights into the chemical characteristics of POM and its subclasses. In Chapter 3 initial EI* DT-MS of the Henlopen small-particle POM data set leads to more detailed analysis of triglyceride,
diglyceride, and phospholipid components via ammonia and deuterated-ammonia chemical ionization (CI*) DT-MS. Polysaccharide varitions among POM subclasses indicated by 16 eV EI* DT-MS in Chapter 4 are further explored CI* DT-MS in Chapter
5.
Flow cytometric sorting is coupled with DT-MS in order to obtain molecular-level characteristics of subclasses ("phytoplankton" and "detritus") within small-particle POM. The "phytoplankton" and "detrital" subclasses isolated from this POM are chemically distinct in both spatially varying and temporally varying data sets (Chapter 4 of this thesis).
As both flow cytometry and DT-MS require samples suspended in liquid, samples for this study were obtained using cross-flow filtration as well as conventional (gravity
filtration, flow cytometry and the various MS techniques applied in this study. The actual method development is discussed in Chapter 2.
Cross-flow Filtration
In the past decade, cross-flow filtration (CFF, also called tangential-flow
filtration) has become increasingly popular in marine chemistry studies for the processing of colloids and particles from large volume (10-1000 L) samples of seawater. It has been of particular value in investigations of the organic and trace metal constituents of marine colloids (e.g., Amon and Benner, 1994, 1996, McCarthy et al., 1996, Aluwihare et al.,
1997, Guo et al., 1996, Moran and Moore, 1989, Buesseler et al., 1996 and references therein). In this study CFF was chosen for the concentration of particulate (>0.8 Jim) organic matter for the following two reasons. First, large amounts of sample were
desirable for method development, flow cytometry, and ancillary measurements. Second, and perhaps more importantly, the fact that CFF retentate remains suspended in liquid (as opposed to becoming embedded in a filter) was considered a desirable feature because both DT-MS and flow cytometry require particle suspensions.
In all filtration techniques a concentration gradient forms between membrane and bulk sample as particles larger than the pore size are preferentially retained by the
membrane. CFF increases possible flow rates and hence sample volumes for these samples by reducing the concentration gradient that forms between membrane and bulk sample. It does this by driving the sample parallel to the membrane and filtering due to hydrostatic pressure, rather than the conventional gravity or vacuum pressure. The sample is driven past this membrane multiple times, decreasing in volume each time and concurrently increasing in the concentration of particles of interest (as described in Buesseler et al., 1996; Klap, 1997).
The ability to easily process large volume samples by CFF has been mainly responsible for its popularity in marine chemistry, however, the user must be aware that
CFF is not an easily characterized technique. Size cutoff characteristics for a particular membrane may vary with operating conditions, particle shape, and varying
physicochemical interactions between the particle and the membrane surface (Buesseler et al, 1996; Gustafsson et al., 1996). Particle adsorption and particle breakthrough at high
concentration factors are also very real concerns.
As this study is qualitative in nature, concentrating on molecular-level variations in chemical composition among and within POM subclasses, CFF performance was monitored in terms of potential fractionation of particle populations rather than absolute recoveries or mass balances (see Chapter 4).
Flow Cytometry
In flow cytometry individual particles in a stream of water are directed through a focused laser beam and are characterized on the basis of light scattering and fluorescent properties. Two properties commonly analyzed in oceanographic samples (and used in this thesis to descriminate "phytoplankton" and "detritus") are forward angle light scatter (a function of size) and red fluorescence (a function of chlorophyll content). Other properties can be used to determine phytoplankton cell type: depolarization of forward light scatter indicates the presence of a calcium carbonate shell; a high ratio of right angle light scatter to forward angle light scatter indicates that a cell is long and narrow (such as a pennate diatom); and orange fluorescence results from phycoerythrin within the cell (Olson et al., 1989, 1990). Fluorescent probes may also be used to gain additional information; for example, Dorsey et al. (1989) illustrate the usefulness of fluorescein diacetate (FDA) as a measure of cell viability for phytoplankton populations.
Flow cytometric sorting allows the physical separation of particles according to a preselected combination of the above properties. Vibration of a bimorph crystal separates the sample stream into microdroplets; those droplets containing the described particles are electrostatically charged and are then separated from the main stream of droplets as
SHEATH FWID CHARGING COLLAR DEFLECTION - + PL.ATES O + 00-0 0 S 0 E * i Pulse Time M E Signal Property
they pass through an electric field (Fig. 1.2). Sorting rate depends upon the ratio of desired and non-desired particles in a sample as each particle must pass through the laser beam individually. The biomass yield rate resulting from this sorting rate depends upon
the size (or more specifically, the biomass) of the particles being sorted. For >2 gm, <53 gm POM, an EPICS V flow cytometer (Redfield Building, WHOI), under the best conditions, yields 1-10 jg of particulate matter in three to five hours of sorting. Therefore, chemical characterization of flow cytometrically sorted particles requires techniques with sufficient sensitivity to be performed on microgram quantities of material.
Direct Temperature-resolved Mass Spectrometry
Past studies of the chemical composition of POM have been hindered by two analytical limitations. Large sample sizes were required and the existing analytical procedures were time-consuming and generally compound class specific (e.g. Repeta and Gagosian, 1983; Wakeham et al., 1984; Wakeham and Ertel, 1988; Lee and Cronin,
1984). Recently, however, DT-MS, a technique coupling thermal evaporation/pyrolysis and mass spectrometry, has been shown to provide molecular-level characterization on microgram quantities of material from both marine phytoplankton cultures and field samples of POM (Eglinton et al., 1996).
In DT-MS a sample is placed on a resistively heated probe which is inserted into the ionization chamber of the mass spectrometer. The temperature of the probe is increased at a preprogrammed rate and desorption of volatile material and subsequent thermal dissociation (pyrolysis) of polymeric material occur within the ion chamber itself (Fig. 1.3). This technique offers several advantages over the pyrolysis-mass spectrometry methods previously applied to the study of aquatic POM (see, for example, Saliot et al,
1984; Meuzelaar et al., 1982; and references therein). In previous studies, Curie-point pyrolysis was implemented outside the ion source of the mass spectrometer and the
Schematic Diagrani of Diirect Teinperature-resolved Mass Spectroimetry (DT-MS)
To analyzer and detector
Ion Trajectory Acceleration _ Section Ionization Chamber -Ionization Area Repeller Main Slit To acceleration section Deflector Focus 2 Focus 1 pecies Ionization -. fArea Insertion Probe Pt/Rh filament 4-- Probe
AT: Evaporation
+
Pyrolysis --,.... - .]
Repeller: Repulsion .of ionized speciesFig. 1.3. Schematic of DT-MS.
Ionized s -- --- i
resulting pyrolysates entered the ion source through an expansion chamber. This
geometry limited analysis to lower molecular-weight products (<250 amu); both heavier and more polar fragments condensed before reaching the ion chamber. In DT-MS this fractionation is virtually eliminated as pyrolysis and ionization occur in essentially the same location. In contrast to the near instantaneous heating of a sample in Curie point pyrolysis, in DT-MS the probe temperature is increased at a predetermined rate
(-20*C/s). This allows the sequential evolution and monitoring of volatile (primarily lipid) and biopolymeric material during a single measurement as shown in Fig. 1.4 (Eglinton et al., 1996). The scans for each region can be summed to yield composite desorption and pyrolysis mass spectra. As van der Heijden et al. (1990) and Eglinton et al. (1996) have shown, such composite desorption mass spectra appear to contain the same information as mass spectra obtained from solvent extractions of the same sample (Fig. 1.5). This implies that data obtained from DT-MS of whole cells during the course of a two minute analysis are comparable to conventional lipid measurements, although, of course, the conventional measurements provide additional structural information.
Curie-point pyrolysis-MS and DT-MS share other distinct advantages over traditional methods of characterizing POM. Both have rapid analysis times (2-5 min/sample) and can be used with relatively little pre-run sample manipulation. In addition, the data obtained is in numeric form; therefore, it can be incorporated directly into the matrix equations used in multivariate analysis. This ease in applying multivariate analysis makes DT-MS a useful technique for exploring molecular-level variations
among POM subclasses, whose DT-MS mass spectra might otherwise prove too complicated for rigorous interpretation.
DT-MS does have its limitations, too. It is not yet a quantitative technique, though the response factors of various compound classes have been determined (for 16
eV EI* conditions, see Chapter 2). It offers no isomer information. Indeed, the nature of its measurements even precludes absolute identification of the compounds contributing to a particular m/z value. Categoric compound assignments can be obtained through more
Pavlova lutheri
73 271 207 316 35? 400 43 6- 04 256A ' ' 300 ,112 ,130 163 ,185 213 ,228 356 ALL~-1 L6J. .1. U1 L * (a) Desorption 432 446 493 495 523 54 549 B!..AIL' 577 40 60 8 100 128 140 160 180 288 220 240 260 280 300 320 340 360 380 400 420 440 460 408 580 528 540 568 580 600 73 2 4 6 A 217I
90 -A 356 124 138 152 OS 203 285hh
1
9 185 00 39 99 rx18 (b) Pyroly sis 54B V q 52 2 466 4 528, .I
576 40 60 00 108 120 140 160 180 20 220 240 260 200 308 320 340 360 380 400 420 440 460 480 500 520 540 568 508 600 m/zFig. 1.4. DT-MS (low voltage EI) data from analysis of the prymnesiophyte Pavlova
lutheri. The inset is a plot of the TIC (Total Ion Chromatograph). Fig. 1.4(a). is the mass spectrum resulting from summation over the desorption region (indicated by light shading in the inset) Fig. 1.4(b) results from summation over the pyrolysis region (indicated by darker shading in the TIC). Symbols denote: * sterols, A fatty acids, V glycerides. Based on a figure from Eglinton et al., 1996.
77403
5801
42j
iII1~h~u~
Isochrysis galbana
A 220.)3 129.1 5-l 98.1 5.111.
0-5. 185.2 A 211.3 143.1 171.2 I 91 j19a Total algal cells
A 256.3 A IA
L282
.3
314.3 380.4 39Y .4 416.4 L.. IL448.6 K 528.6 K 510. ' ; 44-71K 0 0_0_1_0__'_0_24_2_0_2__3_0_3__340_3__3_0_4__4_0_44_4_0_4__S___5. _540_5 _b Solvent Extract
0 380 .4 394.46 432.5 470.6 K 520.6 54 ..7 K 510.6 56 .T40'' '~"T5 "0b' 4U'0W M 2' b b' B b' B o ' Bo' "ob I Nk o' b' 4 bo' bo' bo' s' 'ob''' m/z
Fig. 1.5. DT-MS spectra for Isochrysis galbana: (a) mass spectra summed over the
desorption section of the TIC profile; (b) mass spectra summed over the TIC peak from the measurement of a solvent (lipid) extract. Symbols denote: 0 sterols, A fatty acids, K alkenones. Based on a figure from Eglinton et al., 1996.
73.0 60.0
.3
"
L IL L 0 j ..230.3sophisticated MS techniques (high resolution MS, MS/MS), however, there is a trade-off as the techniques yielding more structural information can only be applied to reduced mass unit ranges. Pyrolysis mass spectrometry (the analytical category in which DT-MS falls) of POM results in complex spectra as POM contains nonpolar and polar organic constituents intimately associated with inorganic matrices. Although both desorption and pyrolysis yield mass spectra following certain known reaction rules, data processing
techniques such as principle component analysis/discriminant analysis and analysis through neural networks are necessary for separating important patterns from the vast array of information obtained (as illustrated by Saliot et al., 1984; de Waart et al., 1991; Eglinton et al., 1992; Smiley et al., 1994; and others). Finally, DT-MS, even with its least
selective ionization mode (low-voltage Er) does not provide an equal amount of information on all compound classes; therefore, there is a distinct possibility that important details of the chemical composition of certain samples can be obscured.
Despite these limitations, DT-MS fills an important gap in the study of POM. EI DT-MS gives rapid molecular-level information on a broad array of biochemicals (see Appendix 1) while traditional techniques tend to be limited to one or a couple of compound classes. It also requires little or no sample workup and can be performed on microgram quantities of material. Therefore, it allows the rapid analysis of large sample sets (over a hundred samples can be analyzed per week), thus providing a statistically significant framework in which to place the more laborious and more detailed molecular-level studies. It can also, perhaps, supply information as to the molecular molecular-level variations responsible for changes in bulk measurements of POM (e.g., 8"C, C/N, etc.).
Multivariate Analysis
The two multivariate analysis techniques used in this study are principal component analysis (PCA) and discriminant analysis (DA), in this case a two-stage principal component analysis (Hoogerbrugge et al., 1983). PCA is a technique for
reducing the dimensionality of a data set by creating linear combinations of the measured variables. A limited number of these linear combinations or principal components should explain most of the variance in the original data set. PCA is similar to factor analysis but where factor analysis begins with a particular model for the data, PCA places no
restrictions upon the covariance matrix which undergoes eigenanalysis (Meglen, 1992; for furthur description of PCA see Davis, 1986; Meglen, 1992). Discriminant analysis (DA), as used here, maximizes variance among samples and minimizes variance among replicate mass spectrometric analyses of the samples. This treatment, therefore, serves to reduce interference associated with sample inhomogeneity and instrument variability.
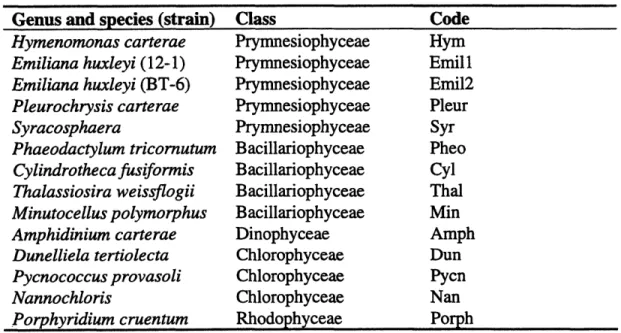
Table 1.2. Phytoplankton cultures used in the example of discriminant analysis.
Genus and species (strain) Hymenomonas carterae Emiliana huxleyi (12-1) Emiliana huxleyi (BT-6) Pleurochrysis carterae Syracosphaera Phaeodactylum tricornutum Cylindrotheca fusifornis Thalassiosira weissflogii Minutocellus polymorphus Amphidinium carterae Dunelliela tertiolecta Pycnococcus provasoli Nannochloris Porphyridium cruentum Class Prymnesiophyceae Prymnesiophyceae Prymnesiophyceae Prymnesiophyceae Prymnesiophyceae Bacillariophyceae Bacillariophyceae Bacillariophyceae Bacillariophyceae Dinophyceae Chlorophyceae Chlorophyceae Chlorophyceae Rhodophyceae
Score plots resulting from PCA or DA indicate relationships among samples. Reconstructed spectra from the principal components (or discriminant functions) indicate the relationships among variables, i.e., m/z values, responsible for the relationships
among the samples. These m/z values can be tentatively identified by comparison with literature values (Meuzelaar et al., 1982; Boon and de Leeuw, 1987; Saiz-Jiminez et al.,
Code Hym Emill Emil2 Pleur Syr Pheo Cyl Thal Min Amph Dun Pycn Nan Porph
1987; Lomax et al., 1991; Eglinton et al., 1996; and others) and values from additional analyses of standards, and the spectra can be considered illustrations of molecular-level differences among samples in the data set. It should be emphasized that the spectra resulting from PCA or DA are difference spectra; chemical characteristics shared by all samples in the data set will not appear. It should also be emphasized that DT-MS linked to PCA or DA is not a quantitative technique; with DT-MS, compound classes vary in response factor and sensitivity to matrix effects. Therefore, care must be taken in considering relative intensities of two m/z values within a difference spectrum as indicative of the relative amounts of enrichment of the precursor compounds.
A study of marine algal cultures (see Table 1.2 for cultures and their
abbreviations) is presented here to illustrate the coupling of DT-MS and multivariate analysis as a technique for determining molecular-level variance in chemically complex samples. Duplicate measurements of the 14 algal cultures were performed on a Jeol
SX-102A mass spectrometer using Electron Impact (EI) ionization (16 eV). For each measurement mass spectra summed over the peak in the Total Ion Current (TIC) curve were exported to a SUN Unix workstation for principal component and discriminant analyses using the program FOMpyroMAP (FOM Institute, the Netherlands).
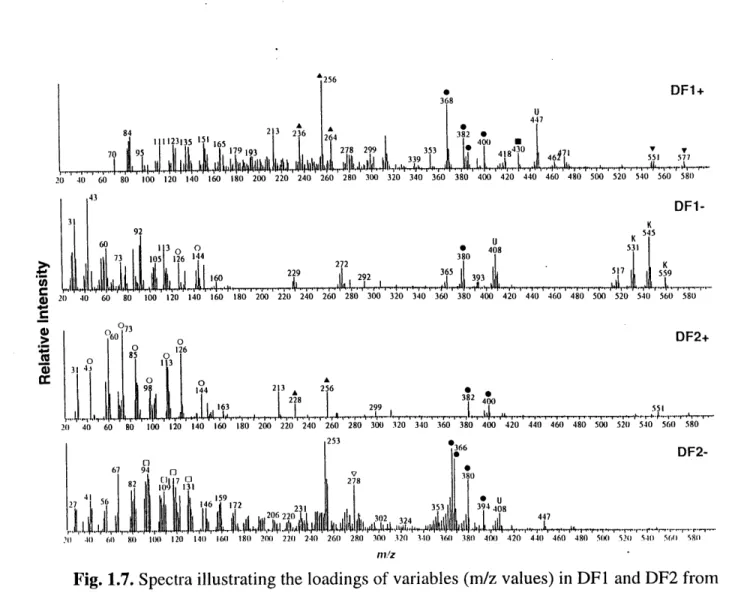
Examples of the kind of information obtained are shown in Fig. 1.6 and Fig. 1.7. In Fig. 1.6, relationships among the algal samples are illustrated by plotting sample scores in two-dimensional space with Discriminant Function 1 (DF1) and DF2, responsible for 39% and 30% of the external variance, respectively, as the x-and y-axes. The more chemically similar the samples (in DF1 and DF2), the closer together they fall in the score plot (Fig. 1.6). Abridged information on variable loadings is superimposed on this score plot, and Fig. 1.7 contains complete loading information, in the form of reconstructed
mass spectra, for DF+ 1, DF- 1, DF+2, and DF-2. As shown in Fig. 1.6, DF 1 separates
Nannochloris sp. from Emiliana huxleyi, while DF2 strongly separates Dunalliela tertiolecta from Minutocellus polymorphus and Cylindrothecafusiformis. As Fig. 1.7
Sterol C28.2
negative -' Positive
Discriminant Function 1
Fig. 1.6. Score plot from discriminant analysis of algal culture DT-MS spectra (summed over the entire TIC peak). Solid symbols indicate samples that plot above the DF1/DF2 plane (i.e., in the DF+3 region). Open symbols indicate samples falling in the DF-3 region. Loadings of the major variables (mass unit values) separating the samples are superimposed on the score plot. All data was acquired on a Jeol SX-102 instrument under EI*, 16 eV conditions. See Table 1.2 for explanation of the algal culture abbreviations. Modified from Eglinton et al., 1996.
2 5 6 368 U 447 84 1 112313 5 15 2 3 2 36 2 382 04051)4 179 93i278 29j 353 430.I 4 7 DF1+ T 551 577 20 40 60 80 100 120 140 160 180 200 220 240 260 280 300 320 340 360 380 400 420 440 460 480 500 520 540 560 581) 43 DF1-92 602105 12I6 144 ~ j~jjj1o 0 229~ 20 40 60 80 100 120 140 160 180 200 220 240 260 O 0 0 0 126 - 85 0 31 4 1 3 o A 44 213 21 6 292 U 0 408 380 365 _.j 9 K 545 539K 51 K559 280 300 320 340 360 380 400 420 440 460 480 500 520 540 560 580 DF2+ 382 32400 1 1 299 21) 40 60 80 100 120 140 160 180 200 220 240 260 280 300 320 340 360 380 400 420 440 460 480 500 521 540 56( 580 .23 U 67 94 2 56 6 146 172 4!i 172 2062202 23 366 0 280 27838 11L 11111L11 hl1. It Hal - 11,1 408 J DF2-?0 1) 61) 80 100 120 140 160 180 200 220 240 260 280 300 320 340 160 380 400 420 440 460 480 500 520 5410 560 580 mlz
Fig. 1.7. Spectra illustrating the loadings of variables (m/z values) in DF1 and DF2 from
Fig. 1.6. Symbols denote: * sterols, A fatty acids, V glycerides, Etocopherols, 0 polysaccharide fragments, V phytadienes, Eprotein fragments, K alkenones, U unknowns. Note: these spectra are not corrected for mass defect. Modified from Eglinton et al., 1996.
I253
I-T-strong fatty acid (m/z 236, 256, 264) and sterol (m/z 368, 382, 386, 400) signatures as well as tocopherol (m/z 430) and diglyceride (m/z 551, 577) peaks and an unknown peak at m/z 477. DF- 1 contains a strong signature from C37-39 alkenones (m/z 531, 545, 559), a C28:2 sterol peak (m/z 380), and an unknown peak at m/z 408. DF+2 is a function of polysaccharide pyrolysis products (m/z 144, 126, 114, 98, 85, 73, 60, 43) but also includes C16:0 and C4:O fatty acids and C28:1 sterol (m/z 400, from the molecular ion, and m/z 382, from M-H20). DF-2 contains protein fragments (m/z 94, 117, 131) phytadiene (from chlorophyll, m/z 278) and C27:2 and C28:2 sterols.
This algal study illustrates that it is possible to determine significant molecular-level variations within a data set consisting of chemically complex samples. In this thesis both principal component analysis and discriminant analysis are applied to natural
References:
Alldredge and Silver (1988). Characteristics, dynamics, and significance of marine snow.
Prog. Oceanog., 20,41-82.
Aluwihari L. I, Repeta D. J., and Chen R. F. (1997). A major biopolymeric component to dissolved organic carbon in surface seawater. Nature 387, 166-169.
Amon R.M.W. and Benner R. (1996) Bacterial utilization of different size classes of dissolved organic matter. Limnol. Oceanogr., 41(1), 41-5 1.
Bacon M. P., Hun C. A., Fleer A. P. and Deuser W. G. (1985). Seasonality in the flux of natural radionuclides and plutonium in the deep Sargasso Sea. Deep-Sea Res., 32, 273-286.
Biddanda B and Benner R. (1997). Carbon, nitrogen, and carbohydrate fluxes during the production of particulate and dissolved organic matter by marine phytoplankton. Limnol.
Oceanogr., 42(3), 506-518.
Bishop J. K. B., Edmond J. M., Ketten D. R., Bacon M. P., and Silker W. B. (1977). The chemistry, biology, and vertical flux of particulate matter from the upper 400 m of the Equatorial Atlantic Ocean. Deep-Sea Res., 24, 511-548.
Boon J.J. (1992). Analytical pyrolysis mass spectrometry: new vistas opened by
temperature-resolved in-source PYMS. Int.J.Mass.Spec and Ion Process., 118/119, 755-787.
Boon, J. J. and de Leeuw J. W. (1987). Amino acid sequence information in proteins and complex proteinaceous material revealed by pyrolysis-capillary gas chromatography-low and high resolution mass spectrometry. I. Anal. and Appl. Pyr., 11, 313-327.
Boudreau B. P. and Ruddick B. R. (1991). On a reactive continuum representation of organic matter diagenesis. Am. J. of Science, 291, 507-538.
Brown M. R., Dunstan G. A., Norwood S. J., and Miller K. A. (1996). Effects of harvest stage and light on the biochemical composition of the diatom Thalasiosira pseudonana.
J. Phycol. 32, 64-73.
Buesseler K. 0., Bauer J. E., Chen R. F., Eglinton T. I., Gustafsson 0., Landing W., Mopper K., Moran S. B., Santschi P. H., VernonClark R., Wells M. L. (1996). An intercomparison of cross-flow filtration techniques used for sampling marine colloids: Overview and organic carbon results. Mar. Chem., 55, 1-31.


![Fig. 2.12. POC/chlorophyll ratios as determined by HPLC and elemental analysis ([POC]/[chl a]) vs the analogous ratios determined by DT-MS ([TIC]/[phytadiene]).](https://thumb-eu.123doks.com/thumbv2/123doknet/14425243.514072/80.918.183.762.169.872/chlorophyll-ratios-determined-elemental-analysis-analogous-determined-phytadiene.webp)

