HAL Id: hal-02484240
https://hal.archives-ouvertes.fr/hal-02484240
Submitted on 19 Feb 2020
HAL is a multi-disciplinary open access
archive for the deposit and dissemination of
sci-entific research documents, whether they are
pub-lished or not. The documents may come from
teaching and research institutions in France or
abroad, or from public or private research centers.
L’archive ouverte pluridisciplinaire HAL, est
destinée au dépôt et à la diffusion de documents
scientifiques de niveau recherche, publiés ou non,
émanant des établissements d’enseignement et de
recherche français ou étrangers, des laboratoires
publics ou privés.
A decrease in brown adipose tissue activity is associated
with weight gain during chemotherapy in early breast
cancer patients
Angeline Ginzac, Bertrand Barres, Marion Chanchou, Emilie Gadéa, Ioana
Molnar, Charles Merlin, Bruno Coudert, Emilie Thivat, Xavier Durando
To cite this version:
Angeline Ginzac, Bertrand Barres, Marion Chanchou, Emilie Gadéa, Ioana Molnar, et al.. A decrease
in brown adipose tissue activity is associated with weight gain during chemotherapy in early breast
cancer patients. BMC Cancer, BioMed Central, 2020, 20 (1), pp.96. �10.1186/s12885-020-6591-3�.
�hal-02484240�
R E S E A R C H A R T I C L E
Open Access
A decrease in brown adipose tissue activity
is associated with weight gain during
chemotherapy in early breast cancer
patients
Angeline Ginzac
1,2,3*, Bertrand Barres
4, Marion Chanchou
4, Emilie Gadéa
5, Ioana Molnar
1,2,3, Charles Merlin
4,
Bruno Coudert
6, Emilie Thivat
1,2,3and Xavier Durando
1,2Abstract
Background: A decrease in thermogenesis is suspected to be implicated in the energy expenditure reduction during breast cancer treatment. This study aimed to investigate the impact of chemotherapy on the metabolic activity of brown adipose tissue (BAT) and the link with weight variation.
Methods: This was an ancillary analysis of a multicentre trial involving 109 HER2+ breast cancer patients treated with neoadjuvant chemotherapy. A centralised review of18F-FDG uptake intensity (SUVmax) in specific BAT regions
(cervical and supraclavicular) was conducted on two PET-CT scans for each patient (before and after the first course of chemotherapy).
Results: Overall, after one course of chemotherapy a significant decrease of 4.4% in18F-FDG-uptake intensity was observed. It was not correlated to initial BMI, age or season. During chemotherapy, 10.1% (n = 11) of the patients lost weight (− 7.7 kg ± 3.8 kg; ie, − 9.4% ± 3.7%) and 29.4% (n = 32) gained weight (+ 5.1 kg ± 1.7 kg; ie, + 8.5% ± 2.6%). Among these subgroups, only the patients who had gained weight underwent a significant decrease (13.42%) in18F-FDG uptake intensity (p = 0.042).
Conclusion: This study is the first to highlight in a large cohort of patients the negative impact of chemotherapy on brown adipose tissue activity. Weight gain during chemotherapy could thus potentially be explained in part by a decrease in brown adipose tissue activity.
Keywords: Brown adipose tissue, Energy metabolism, Weight gain, Breast cancer
Background
Excess body weight is a recognized breast cancer risk factor and also a factor of poor prognosis at diagnosis (high recurrence and mortality rates) [1,2]. Weight gain during breast cancer treatment, in particular during chemotherapy, is also linked to poor prognosis [3–7]. The mechanisms that explain weight change are not
clearly understood [8]. Weight change results from an energy imbalance, i.e. food intake versus energy expend-iture [9, 10]. Nausea, vomiting or even loss of appetite for example can disturb food intake, thus affecting en-ergy intake [9]. Energy expenditure is explored by way of resting energy expenditure (REE), physical activity and adaptive thermogenesis. BAT (brown adipose tissue) contains numerous mitochondria harbouring a particu-lar protein, the uncoupling protein-1 (UCP-1) which confers a specific function to this tissue: heat production [11]. Thus, BAT contributes to thermogenesis [12].
BAT has received considerable attention since it is considered as a potential target to limit obesity and metabolic syndromes. Its contribution to human energy
© The Author(s). 2020 Open Access This article is distributed under the terms of the Creative Commons Attribution 4.0 International License (http://creativecommons.org/licenses/by/4.0/), which permits unrestricted use, distribution, and reproduction in any medium, provided you give appropriate credit to the original author(s) and the source, provide a link to the Creative Commons license, and indicate if changes were made. The Creative Commons Public Domain Dedication waiver (http://creativecommons.org/publicdomain/zero/1.0/) applies to the data made available in this article, unless otherwise stated.
* Correspondence:[email protected]
1Centre Jean PERRIN, INSERM, U1240 Imagerie Moléculaire et Stratégies
Théranostiques, Université Clermont Auvergne, F-63011 Clermont-Ferrand, France
2Délégation Recherche Clinique & Innovation, Centre Jean PERRIN, Centre de
Lutte contre le Cancer, 58 rue Montalembert, F-63011 Clermont-Ferrand, France
metabolism needs further investigation. BAT is known to affect energy metabolism in murine models. Indeed, Lowell et al. showed that the ablation of BAT leads to obesity [13]. Feldmann et al. drew the same conclusion, showing that UCP1 ablation led to obesity in mice [14]. Studies using fluorine-18 fluorodeoxyglucose (18F-FDG) positron emission tomography (PET) scans have evi-denced the presence of BAT in adults [15–18].18F-FDG is currently used in oncology to mark tumours but it is not specific and has been found in high glucose metab-olism organs such as BAT [19–21]. BAT is localized in the cervical and supraclavicular regions [22, 23]. Only two studies, including ours, have focused on BAT activ-ity during breast cancer chemotherapy [24, 25]. Rous-seau et al. studied BAT uptake variations among 33 early breast cancer patients who had 5 FDG PET scans during chemotherapy. The authors found that BAT up-take was highly variable across patients, independently from outdoor temperatures. They also showed that pa-tients treated with taxane-based chemotherapy were those with the more significant changes on PET-CT scan compared to those treated with anthracycline-based chemotherapy [25]. Our team hypothesised that chemo-therapy decreases BAT activity and leads to weight gain. Indeed, our previous pilot study on a small sample of pa-tients (26 early breast cancer papa-tients included in the AVATAXHER trial in Jean PERRIN Comprehensive Cancer Centre) showed a decrease in18F-FDG uptake in
BAT regions after one course of chemotherapy [24].
More specifically, our team found that patients gaining weight (> 5% of initial weight) during chemotherapy underwent a significant decrease in BAT activity com-pared to patients who remained stable or lost weight [24]. One limitation of these two studies is that they were conducted on a few patients only. Data on larger cohorts is needed. The primary objective of the present study was to assess the impact of one course of chemo-therapy on BAT activity in 109 early breast cancer pa-tients. The secondary objectives were to assess the relationship between BAT activity variations and weight variations at the end of chemotherapy, and to study the factors influencing BAT activity.
Methods
Study population and clinical data
The present study was an ancillary analysis to a national prospective multicentre trial, the AVATAXHER trial (NCT01142778), approved by the local ethics committee and the competent authority. A non-opposition letter has been delivered to the patients in order to inform them about the research. Among the 128 patients poten-tially eligible for our ancillary study, 109 were included in the assessment (there were 2 oppositions to the use of
medical data and 17 had missing or uninterpretable PET/CT).
All patients had been diagnosed with HER2-positive early breast cancer and received neoadjuvant chemother-apy (2 cycles of docetaxel + trastuzumab, then patients with a decrease in SUV (< 70%) were randomized in a 2: 1 ratio to receive trastuzumab + docetaxel ± bevacizu-mab for cycles 3 to 6 whereas patients with a change in
SUV ≥70% received trastuzumab + docetaxel). Patients
were treated with 6 courses of neoadjuvant chemother-apy followed by 12 injections of trastuzumab, one of which was before surgery.
PET-CT scan review
A specific procedure for the conduct of PET-CT scans is in force in all facilities concerned. Patients were instructed to fast at least 6 h before 18F-FDG injection and to avoid muscular effort the day before. After 18 F-FDG administration, patients were asked to keep still and warm to avoid brown adipose tissue fixation. The temperature in the examination room was the same in each centre.
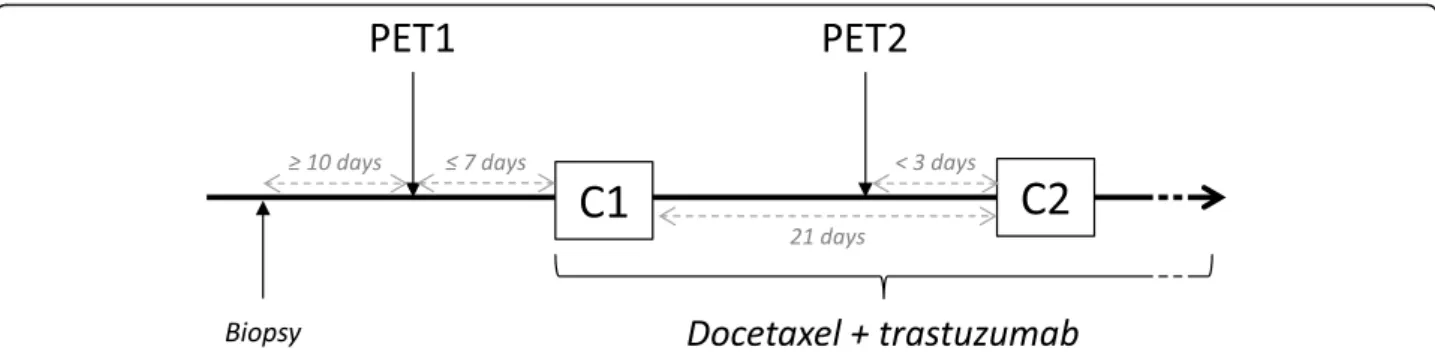
Early response to treatment was evaluated by
fluorine-18 fluorodeoxyglucose (18F-FDG) PET/CT scan before
(PET 1) and after one course of chemotherapy (PET 2) (Fig. 1). All patients received a short corticosteroid ther-apy (24 to 48 h), as part as premedication for docetaxel, which must not influenced BAT activity. Indeed, PET1 and PET2 have been realised before any steroid therapy [26] (see Additional file1). PET-CT images were visua-lised on Oasis software V1.8.3 (Segami). All the18F-FDG PET/CT scans were centralised and reviewed twice, by two physicians from our institution, experienced in nu-clear medicine. The metabolic activity of BAT was mea-sured by the maximum standard uptake value (SUVmax) [27]. A spherical region of interest (ROI) of 10 mm in
diameter was used to quantify 18F-FDG uptake
(max-imum standardized uptake value (SUVmax)) in the BAT
regions, i.e. the cervical and supraclavicular regions [28], and in control tissues. ROIs were placed manually on each image in different specific anatomical regions: the contralateral breast (white fat), the deltoid (muscle) and the liver as controls, and the supraclavicular region (right and left), and in the upper and lower cervical re-gions (right and left).
Statistical analysis
R software (version 3.5, R-Project, GNU GPL) was used to perform the statistical analyses. Patient characteristics were described using mean and standard deviation or median and range in case of a non-Gaussian distribution for quantitative parameters. For the hypothesis tests, the significance threshold was fixed at 0.05. For comparisons of before/after measures, we used Wilcoxon’s
rank test or paired Student’s t-tests. Confidence intervals were based on hypothesis-testing using these two tests. For comparisons between the groups of relative weight variation, we used ANOVA, Welch’s ANOVA or the Kruskal-Wallis’ test (with the Tukey-Kramer method, Dunn’s test with Holm correction or the Games-Howell test in a post-hoc analysis). A subgroup analysis was also conducted on the relative weight subgroups, without multiple testing corrections. It is worth noting that, for the main objective (before/after difference in SUVmax), with 109 patients it can be thought that our study had enough power (> 85%) to detect an effect size of 0.3 (paired t-test, α = 0.05). Similarly, for the secondary ob-jective of finding a correlation between the weight vari-ation and the SUVmax varivari-ation, the power to detect a coefficient equal to 0.3 can be expected to reach 80%.
Results
Patient characteristics
The characteristics of the 109 women included in this study are presented in Table1. The patients’ median age
was 48 years. Before chemotherapy, their mean BMI was 25.1 kg/m2 (SD 5.7), 25.7% (n = 28) of the population were overweight and 13.8% (n = 15) were obese. The ma-jority of the PET scans occurred in warm seasons, with 43.1% (n = 47) PET scans performed in summer, 19.3% (n = 21) in spring and 20.2% (n = 22) in autumn and 17.4% (n = 19) in winter. All patients are maintained eu-thyroid. Eight patients were under beta-blockers at PET 1 (before chemotherapy) but were not excluded from the analyses because this does not interfere with SUV-max variation after one course of chemotherapy.
Weight variation
Patient weight did not change between PET 1 and PET 2 because of the short period between these two images. In the overall population, the mean weight change from baseline to the end of neoadjuvant chemotherapy was 1.5 kg (95% CI [0.5, 2.3],p = 0.001), or, in relative differ-ence, 1.9% (95% CI [0.8, 3.02],p = 0.001): 10.1% (n = 11) of the patients lost more than 5% of their initial weight
(LOSS subgroup) and 29.4% (n = 32) gained more than 5% of their initial weight (GAIN subgroup), while 60.6% (n = 66) remained stable.
For the entire period of treatment (from baseline to the last administration of trastuzumab), the mean weight change for the overall population was a gain of 1.2 kg (95% CI [0.29, 2], p = 0.011), or, in relative difference, 2.08% (95% CI [0.56, 3.35],p = 0.007).
The treatment arm was not linked to weight variation, whether during neoadjuvant treatment (p = 0.147) or after the end of the overall period of treatment (p = 0.637).
There were significant differences between the GAIN and LOSS patient subgroups (Table 1). At baseline, pa-tients who lost weight were older compared to those who gained weight (p = 0.018) and had a higher initial BMI (31.2 kg/m2(SD 8.4) against 22.6 kg/m2(SD 3.7) for the GAIN patient subgroup) (p = 0.01). Finally, there was more axillary node involvement in the GAIN patient subgroup compared to the STABLE and LOSS sub-groups (p = 0.029).
18
F-FDG uptake variation after one course of chemotherapy
Overall, after one course of chemotherapy,18F-FDG up-take in the BAT regions decreased (weak statistical sig-nificance) by 0.05 (95% CI [− 0.1, − 0.01], p = 0.022), or, in relative difference, by 4.7% (p = 0.056).
After one course of chemotherapy, BAT activity de-creased for 57% (n = 62) of the patients and inde-creased for 43% (n = 47). No variation in18
F-FDG uptake in the muscle and liver control measures was observed. How-ever, in contralateral breast white adipose tissue there was a decrease of weak statistical significance in SUVmax
(− 0.02; 95% CI [− 0.03; 0]; p = 0.043).
Factor influencing18F-FDG uptake and the association
between weight variation and18F-FDG uptake
The mean initial18F-FDG uptake (PET1: before
chemo-therapy) in the BAT regions was correlated with initial weight but was independent from age, initial BMI and
Fig. 1 Study design. The first PET scan was realised within 7 days before the first cycle of chemotherapy (C1). The second PET scan was realised less than 3 days before the second cycle of chemotherapy (C2). PET: Positron emission tomography; C1/2: cycle 1/2
season. Although the mean initial SUVmax
(supraclavi-cular + cervical) was not statistically significantly differ-ent between subgroups, the supraclavicular initial
SUVmaxwas significantly higher in the GAIN subgroup
than in the LOSS subgroup (right side: p = 0.006; left side:p < 0.001).
18
F-FDG uptake in the BAT regions after one course of chemotherapy was not correlated with BMI (p = 0.078), age (p = 0.7) or season (p = 0.51).
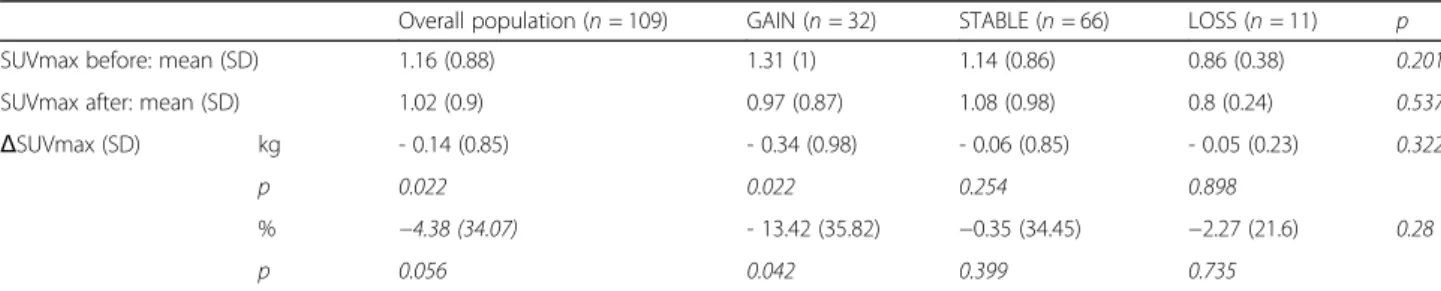
The GAIN patient subgroup underwent a significant decrease in18F-FDG after one course of treatment, with a 13.4% reduction (PET1: 1.31 (SD 1) versus PET2: 0.97
Table 1 Patient characteristics according to subgroup of weight variation during chemotherapy. (p represents thep-value based on ANOVA, Welch’s ANOVA, or Kruskal-Wallis test for continuous data, and the Chi-squared test for categorical data)
Overall GAIN STABLE LOSS p
Overall
n n n n
Median age (range)— yrs 109 48 (25–74) 32 48 (26–62) 66 49 (25–74) 11 61 (40–70) 0.024 Mean weight (SD)— kg
At baseline 109 66.5 (15.2) 32 60.2 (8.9) 66 67.1 (14.8) 11 81.5 (21.5) 0.01 At the end of chemotherapy 109 67.5 (14) 32 65.3 (9.8) 66 67.5 (14.6) 11 73.8 (19.6) 0.686 At the end of Herceptin® 109 67.1 (14.5) 32 63.9 (9.7) 61 67.6 (15.1) 10 73.8 (21.3) 0.212 BMI (SD)— kg/m2
At baseline 109 25.1 (5.7) 32 22.6 (3.7) 66 25.3 (5.2) 11 31.2 (8.4) 0.005 At the end of chemotherapy 109 25.5 (5.3) 32 24.5 (4.1) 66 25.5 (5.2) 11 28.3 (7.8) 0.579 At the end of Herceptin® 109 25.3 (5.5) 32 24.0 (4.1) 61 25.5 (5.4) 10 28.5 (8.5) 0.148
Contraceptive status— % 0.203 Yes 52 47.7 19 59.4 30 45.5 3 27.3 No 10 9.2 3 9.4 6 9.1 1 9.1 Sterile 12 11 4 12.5 8 12.1 0 0 Menopaused 35 32.1 6 18.8 22 33.3 7 63.6 Tumor— % pT 0.078 T2 84 77.1 23 71.9 55 83.3 6 54.5 T3 25 22.9 9 28.1 11 16.7 5 45.5 pN 0.048 N0 50 45.9 9 28.1 36 54.5 5 45.5 N1 59 54.1 23 71.9 30 45.5 6 54.5 M 0.745 M0 105 96.3 31 96.9 63 95.5 11 100 Mx 4 3.7 1 3.1 3 4.5 0 0 SBR grade 0.36 I 1 0.9 1 3.1 0 0 0 0 II 50 45.9 11 34.4 33 50 6 54.5 III 56 51.4 19 59.4 32 48.5 5 45.5 Unknown 2 1.8 1 3.1 1 1.5 0 0 IHC results Overexpressed 106 97.2 32 100 63 95.5 11 100 Non-determined 3 2.8 0 0 3 4.5 0 0 Treatment— %
Docetaxel + Trastuzumab + Bevacizumab 35 32.1 7 21.9 23 34.8 5 45.5
Docetaxel + Trastuzumab 74 67.9 25 78.1 43 65.2 6 54.5
(SD 0.87); p = 0.042) (Table 2). Among the GAIN sub-group patients, 69% (n = 22) had a decrease in BAT ac-tivity. Patients who lost weight and those who remained stable had no significant variation in 18F-FDG uptake. Overall, there was no significant relationship between SUVmax variation and weight variation (p = 0.181).
Discussion
This study is the first to show the impact of one course of chemotherapy on BAT activity in a large population of breast cancer patients. The patients who gained weight (> 5% of initial weight) during neoadjuvant chemotherapy were those who underwent a significant decrease in BAT activity. This study confirms the results of the previous pilot study conducted by our team, sug-gesting that chemotherapy induces a decrease in BAT activity particularly for patients who undergone weight gain [24]. Among the factors potentially implicated in BAT activity variation that were tested in our analyses (age, initial weight, BMI, season), none was found to be statistically significant. Thus, chemotherapy seems to be the only factor affecting BAT activity.
Weight variation is commonly observed among breast cancer patients in the year following diagnosis [7, 29– 36]. In the present study, 29.4% of the patients gained weight and 10.1% lost weight. This is consistent with previous results. It has been shown that during different types of chemotherapy (using the threshold of 5%), 25% of the patients gained weight, 10% lost weight and 65% remained stable [37]. In addition, patients treated with chemotherapy involving trastuzumab exhibited greater weight gain than patients treated without trastuzumab. The authors suggested that the reason was the longer duration of regimens including trastuzumab [37]. BAT activity variation could be implicated in weight variation. Gadéa et al. in a study on 26 breast cancer patients showed that patients who gained weight (after 6 courses of neoadjuvant taxane-based chemotherapy) had a sig-nificant decrease in BAT activity after the first course of treatment [24].
A recent retrospective study conducted on cancer pa-tients (n = 37) compared body fat mass in papa-tients with
and without 18F-FDG uptake [38]. The authors showed that the presence of BAT activity was associated with a low ratio of abdominal fat to total fat, and alongside less abdominal obesity. According to the literature data, it could be hypothesised that a decrease in BAT activity, associated with later weight gain, could corres-pond to a gain in abdominal fat mass. It has been shown that hibernoma resection (a benign tumor histo-logically similar to brown adipose tissue) is associated with an increase in fat mass gain (mainly abdominal) [39]. However, it is well known that the excess of ab-dominal adipose tissue is a factor for poor prognosis because of its role in different metabolic pathway dis-turbances (insulin resistance, adipokines, etc.) and oestrogen production.
The present study has some limitations. The spe-cific procedure for the conduct of PET-CT scans is not ideal for the aim of our ancillary study (designed to avoid brown adipose tissue activation). It would have been interesting to assess the evolution of the patients’ body composition to understand the fat and lean body mass changes potentially induced by BAT variations. Moreover, the information about hormone receptor status could have been correlated with these body mass changes and prognosis. Currently, the real-isation of early PET-scan routinely is not a
recom-mendation and medico-economic studies will be
required to assess feasibility. Investigations on the im-pact of BAT on energy imbalance, and particularly on energy intake, would also be an interesting perspec-tive. Furthermore, the study of long-term survival rates could provide information on the impact of such changes on prognosis.
Conclusion
To the best of our knowledge, this study is the first in a cohort of this type to evidence that one course of chemotherapy induces a decrease in BAT activity among breast cancer patients. Moreover, the patients gaining weight (> 5% of initial weight) were those who under-went the greatest BAT activity decrease compared to those who were stable or who lost weight. Further
Table 218F-FDG intensity (SUVmax) variation after one course of chemotherapy. (on lines 4 and 6, p represents the p-value based on Wilcoxon’s signed-rank test or the paired Student’s t-test for before/after variation; in the last column, p is the p-value based on Welch’s ANOVA or Kruskal-Wallis test for the differences across the three groups of weight variation)
Overall population (n = 109) GAIN (n = 32) STABLE (n = 66) LOSS (n = 11) p SUVmax before: mean (SD) 1.16 (0.88) 1.31 (1) 1.14 (0.86) 0.86 (0.38) 0.201 SUVmax after: mean (SD) 1.02 (0.9) 0.97 (0.87) 1.08 (0.98) 0.8 (0.24) 0.537 ΔSUVmax (SD) kg - 0.14 (0.85) - 0.34 (0.98) - 0.06 (0.85) - 0.05 (0.23) 0.322
p 0.022 0.022 0.254 0.898
% −4.38 (34.07) - 13.42 (35.82) −0.35 (34.45) −2.27 (21.6) 0.28
studies are warranted in order to define the relationship between chemotherapy and BAT activity more precisely. It would also be very interesting to study the evolution of body composition according to BAT activity among breast cancer patients treated with chemotherapy, and its potential impact on survival.
Supplementary information
Supplementary information accompanies this paper athttps://doi.org/10. 1186/s12885-020-6591-3.
Additional file 1: [18F]-fluorodeoxyglucose (FDG) positron emission tomography (PET) procedures (adapted from AVATAXHER trial)
Abbreviations
18F-FDG:Fluorine-18 fluorodeoxyglucose; BAT: Brown adipose tissue;
BMI: Body mass index; HER2: Human epidermal growth factor receptor 2; PET-CT: Positron emission tomography-compute tomography; REE: Resting energy expenditure; ROI: Region of interest; SUVmax: Maximum standardized
uptake value; UCP1: Uncoupling protein-1
Acknowledgments
We would like to thank ROCHE for allowing us to use the PET/CT scan data and for providing the clinical data.
Authors’ contributions
AG, ET, XD wrote the original draft of the paper and contributed to acquisition and interpretation of data; MC and BB contributed to reviewing the PET-PT scans; BB, EG, CM and BC reviewed and edited the paper. IM per-formed the formal analyses. All authors read and approved the final version of the manuscript. All authors meet the four main criteria develop by ICMJE.
Funding None.
Availability of data and materials
The data used in this study are available from the AVATAXHER study database. However, data are only available for the authors due to the legislation of data protection.
Ethics approval and consent to participate
The study was approved by the local ethics committee (Comité de Protection des Personnes Est I, Faculté de Médecine, Dijon; committee’s reference number: 2009/46) and the competent authority. The study was performed in accordance with the Declaration of Helsinki.
As this study is a retrospective one, a non-opposition letter has been deliv-ered to the patients in order to inform them about the research and their right to object to the use of their data.
Consent for publication Not applicable.
Competing interests
The authors declare that they have no competing interests.
Author details
1Centre Jean PERRIN, INSERM, U1240 Imagerie Moléculaire et Stratégies
Théranostiques, Université Clermont Auvergne, F-63011 Clermont-Ferrand, France.2Délégation Recherche Clinique & Innovation, Centre Jean PERRIN, Centre de Lutte contre le Cancer, 58 rue Montalembert, F-63011
Clermont-Ferrand, France.3Centre d’Investigation Clinique, UMR501, F-63001
Clermont-Ferrand, France.4Service de Médecine Nucléaire, Centre Jean
PERRIN, Centre de Lutte contre le Cancer, 58 rue Montalembert, F-63000 Clermont-Ferrand, France.5CH Emile ROUX, 12 Boulevard Docteur, F-43000 le
Puy en Velay, France.6Département d’oncologie médicale, Centre
Georges-François Leclerc, 1 rue du Professeur Marion, F-21000 Dijon, France.
Received: 16 October 2019 Accepted: 30 January 2020
References
1. Kroenke CH, Chen WY, Rosner B, Holmes MD. Weight, weight gain, and survival after breast cancer diagnosis. J Clin Oncol. 2005;23(7):1370–8. 2. Caan BJ, Kwan ML, Hartzell G, Castillo A, Slattery ML, Sternfeld B, et al.
Pre-diagnosis body mass index, post-Pre-diagnosis weight change, and prognosis among women with early stage breast cancer. Cancer Causes Control. 2008; 19(10):1319–28.
3. Mutschler NS, Scholz C, Friedl TWP, Zwingers T, Fasching PA, Beckmann MW, et al. Prognostic impact of weight change during adjuvant
chemotherapy in patients with high-risk early breast cancer: results from the ADEBAR study. Clinical Breast Cancer. 2018;18(2):175–83 1 avr.
4. Gadéa É, Thivat É, Wang-Lopez Q, Viala M, Paulon R, Planchat É, et al. Poor prognostic value of weight change during chemotherapy in non-metastatic breast cancer patients: causes, mechanisms involved and preventive strategies. Bull Cancer. 2013;100(9):865–70.
5. Demark-Wahnefried W, Rimer BK, Winer EP. Weight gain in women diagnosed with breast cancer. J Am Diet Assoc. 1997;97(5):519–26 529; quiz 527-8.
6. Demark-Wahnefried W, Peterson BL, Winer EP, Marks L, Aziz N, Marcom PK, et al. Changes in weight, body composition, and factors influencing energy balance among premenopausal breast cancer patients receiving adjuvant chemotherapy. J Clin Oncol. 2001;19(9):2381–9 1 mai.
7. Saquib N, Flatt SW, Natarajan L, Thomson CA, Bardwell WA, Caan B, et al. Weight gain and recovery of pre-cancer weight after breast cancer treatments: evidence from the women’s healthy eating and living (WHEL) study. Breast Cancer Res Treat. 2007;105(2):177–86.
8. Gadéa E, Thivat E, Planchat E, Morio B, Durando X. Importance of metabolic changes induced by chemotherapy on prognosis of early-stage breast cancer patients: a review of potential mechanisms. Obes Rev. 2012;13(4): 368–80.
9. Demark-Wahnefried W, Hars V, Conaway MR, Havlin K, Rimer BK, McElveen G, et al. Reduced rates of metabolism and decreased physical activity in breast cancer patients receiving adjuvant chemotherapy. Am J Clin Nutr. 1997;65(5):1495–501.
10. Harvie MN, Campbell IT, Baildam A, Howell A. Energy balance in early breast cancer patients receiving adjuvant chemotherapy. Breast Cancer Res Treat. 2004;83(3):201–10.
11. Bargut TCL, Aguila MB, Mandarim-de-Lacerda CA. Brown adipose tissue: updates in cellular and molecular biology. Tissue Cell. 2016;48(5):452–60. 12. Richard D, Picard F. Brown fat biology and thermogenesis. Front Biosci
(Landmark Ed). 2011;16:1233–60.
13. Lowell BB, S-Susulic V, Hamann A, Lawitts JA, Himms-Hagen J, Boyer BB, et al. Development of obesity in transgenic mice after genetic ablation of brown adipose tissue. Nature. 1993;366(6457):740–2.
14. Feldmann HM, Golozoubova V, Cannon B, Nedergaard J. UCP1 ablation induces obesity and abolishes diet-induced thermogenesis in mice exempt from thermal stress by living at thermoneutrality. Cell Metab. 2009;9(2):203– 9.
15. Ong FJ, Ahmed BA, Oreskovich SM, Blondin DP, Haq T, Konyer NB, et al. Recent advances in the detection of brown adipose tissue in adult humans: a review. Clin Sci. 2018;132(10):1039–54.
16. Nedergaard J, Bengtsson T, Cannon B. Three years with adult human brown adipose tissue. Ann N Y Acad Sci. 2010;1212:E20–36.
17. Cypess AM, Lehman S, Williams G, Tal I, Rodman D, Goldfine AB, et al. Identification and importance of brown adipose tissue in adult humans. N Engl J Med. 2009;360(15):1509–17.
18. Virtanen KA, Lidell ME, Orava J, Heglind M, Westergren R, Niemi T, et al. Functional brown adipose tissue in healthy adults. N Engl J Med. 2009; 360(15):1518–25.
19. Cook GJ, Fogelman I, Maisey MN. Normal physiological and benign pathological variants of 18-fluoro-2-deoxyglucose positron-emission tomography scanning: potential for error in interpretation. Semin Nucl Med. 1996;26(4):308–14.
20. Cohade C, Osman M, Pannu HK, Wahl RL. Uptake in supraclavicular area fat (« USA-Fat »): description on 18F-FDG PET/CT. J Nucl Med. 2003;44(2):170–6. 21. Rohren EM, Turkington TG, Coleman RE. Clinical applications of PET in
oncology. Radiology. 2004;231(2):305–32.
22. Nedergaard J, Bengtsson T, Cannon B. Unexpected evidence for active brown adipose tissue in adult humans. Am J Physiol Endocrinol Metab. 2007;293(2):E444–52.
23. Engel H, Steinert H, Buck A, Berthold T, Huch Böni RA, von Schulthess GK. Whole-body PET: physiological and artifactual fluorodeoxyglucose accumulations. J Nucl Med. 1996;37(3):441–6.
24. Gadea E, Thivat E, Merlin C, Paulon R, Kwiatkowski F, Chadeyras J-B, et al. Brown adipose tissue activity in relation to weight gain during chemotherapy in breast cancer patients: a pilot study. Nutr Cancer. 2014; 66(7):1092–6.
25. Rousseau C, Bourbouloux E, Campion L, Fleury N, Bridji B, Chatal JF, et al. Brown fat in breast cancer patients: analysis of serial (18) F-FDG PET/CT scans. Eur J Nucl Med Mol Imaging. 2006;33(7):785–91.
26. Coudert B, Pierga J-Y, Mouret-Reynier M-A, Kerrou K, Ferrero J-M, Petit T, et al. Use of [(18) F]-FDG PET to predict response to neoadjuvant trastuzumab and docetaxel in patients with HER2-positive breast cancer, and addition of bevacizumab to neoadjuvant trastuzumab and docetaxel in [(18) F]-FDG PET-predicted non-responders (AVATAXHER): an open-label, randomised phase 2 trial. Lancet Oncol. 2014;15(13):1493–502. 27. Bahler L, Holleman F, Booij J, Hoekstra JB, Verberne HJ. Interobserver and
intraobserver variability for the assessment of brown adipose tissue activity on 18F-FDG PET-CT. Nucl Med Commun. 2016;37(4):363–71.
28. Hany TF, Gharehpapagh E, Kamel EM, Buck A, Himms-Hagen J, von Schulthess GK. Brown adipose tissue: a factor to consider in symmetrical tracer uptake in the neck and upper chest region. Eur J Nucl Med Mol Imaging. 2002;29(10):1393–8.
29. Goodwin PJ, Ennis M, Pritchard KI, McCready D, Koo J, Sidlofsky S, et al. Adjuvant treatment and onset of menopause predict weight gain after breast cancer diagnosis. J Clin Oncol. 1999;17(1):120–9.
30. Thivat E, Thérondel S, Lapirot O, Abrial C, Gimbergues P, Gadéa E, et al. Weight change during chemotherapy changes the prognosis in non metastatic breast cancer for the worse. BMC Cancer. 2010;10:648. 31. Makari-Judson G, Judson CH, Mertens WC. Longitudinal patterns of weight
gain after breast cancer diagnosis: observations beyond the first year. Breast J. 2007;13(3):258–65.
32. Gadéa E, Thivat E, Dubray-Longeras P, Arbre M, Van-Praagh I, Mouret-Reynier M-A, et al. Prospective study on body composition, energy balance and biological factors changes in post-menopausal women with breast cancer receiving adjuvant chemotherapy including taxanes. Nutr Cancer. 2018;70(7):1–10.
33. Heideman WH, Russell NS, Gundy C, Rookus MA, Voskuil DW. The frequency, magnitude and timing of post-diagnosis body weight gain in Dutch breast cancer survivors. Eur J Cancer. 2009;45(1):119–26.
34. Irwin ML, McTiernan A, Baumgartner RN, Baumgartner KB, Bernstein L, Gilliland FD, et al. Changes in body fat and weight after a breast cancer diagnosis: influence of demographic, prognostic, and lifestyle factors. J Clin Oncol. 2005;23(4):774–82.
35. Rock CL, Flatt SW, Newman V, Caan BJ, Haan MN, Stefanick ML, et al. Factors associated with weight gain in women after diagnosis of breast cancer. Women’s healthy eating and living study group. J Am Diet Assoc. 1999; 99(10):1212–21.
36. Trédan O, Bajard A, Meunier A, Roux P, Fiorletta I, Gargi T, et al. Body weight change in women receiving adjuvant chemotherapy for breast cancer: a French prospective study. Clin Nutr. 2010;29(2):187–91.
37. Winkels RM, Beijer S, van Lieshout R, van Barneveld D, Hofstede J, Kuiper J, et al. Changes in body weight during various types of chemotherapy in breast cancer patients. e-SPEN J. 2014;9(1):e39–44.
38. Green AL, Bagci U, Hussein S, Kelly PV, Muzaffar R, Neuschwander-Tetri BA, et al. Brown adipose tissue detected by PET/CT imaging is associated with less central obesity. Nucl Med Commun. 2017;38(7):629–35.
39. Gadea E, Thivat E, Paulon R, Mishellany F, Gimbergues P, Capel F, et al. Hibernoma: a clinical model for exploring the role of brown adipose tissue in the regulation of body weight? J Clin Endocrinol Metab. 2014;99(1):1–6.
Publisher’s Note
Springer Nature remains neutral with regard to jurisdictional claims in published maps and institutional affiliations.