HAL Id: hal-00670764
https://hal.sorbonne-universite.fr/hal-00670764
Submitted on 16 Feb 2012
HAL is a multi-disciplinary open access
archive for the deposit and dissemination of
sci-entific research documents, whether they are
pub-lished or not. The documents may come from
teaching and research institutions in France or
abroad, or from public or private research centers.
L’archive ouverte pluridisciplinaire HAL, est
destinée au dépôt et à la diffusion de documents
scientifiques de niveau recherche, publiés ou non,
émanant des établissements d’enseignement et de
recherche français ou étrangers, des laboratoires
publics ou privés.
Marine Plankton: Correlates of Lorica Dimensions
John Dolan
To cite this version:
John Dolan. Morphology and Ecology in Tintinnid Ciliates of the Marine Plankton: Correlates of
Lorica Dimensions. Acta Protozoologica, Jagiellonian University, 2010, 49, pp.235-244. �hal-00670764�
Acta Protozool. (2010) 49: 235–244
http://www.eko.uj.edu.pl/ap
ActA
protozoologica
Morphology and Ecology in Tintinnid Ciliates of the Marine Plankton:
Correlates of Lorica Dimensions
John R. DOLAN
Marine Microbial Ecology, Laboratoire d’Océanographie de Villefranche-sur-Mer, UMR 7093, CNRS, Université Pierre et Marie Curie, Station Zoologique Observatoire Océanologique de Villefranche-sur-Mer, Villefranche-sur-Mer, France
Summary. Tintinnid ciliates, characterized by the possession of a lorica into which the ciliate cell can contract, are a common component
of the marine microzooplankton. Lorica architecture and size range widely and classically distinguishes species. Here relationships between ecological parameters and lorica dimensions (lorica oral diameter (LOD), lorica length (LL) and lorica volume (LV) are examined using data from literature reports. The relationships between lorica dimensions and reproductive potential, using maximum reported growth rates of natural populations (n = 52 species) are assessed. Susceptibility to copepod predation and lorica dimensions are considered based on reports of clearance rates of Acartia species feeding on tintinnid ciliates (n = 7 species). Diet and lorica dimension is analyzed using data on mean maximum food size contained in field-caught cells (n = 20 species), and preferred food size based on prey size associated with maximal reported clearance rates (n = 15 species). Overall, LOD is closely related to most of the ecological parameters. Maximum growth rate is related to LOD with smaller LODs corresponding to higher growth rates, in contrast to LL and LV. Maximum prey size is positively related to both LOD and LL but more tightly with LOD. Preferred prey size is positively related to LOD and LV but more tightly related to LOD. Clearance rates of Acartia species feeding on tintinnids are significantly related only to LOD with small LODs corresponding to lower copepod feeding rates. Relationships excluding data on species of Tintinnopsis, the species-rich genus which generally dominates coastal communities, are also examined and show similar trends. In tintinnids, LOD, known to be a conservative and relatively reliable species characteristic, appears related to a wide range of ecological characteristics.
Key words: Ciliophora, allometry, niche, morphospecies, biodiversity, zooplankton
Address for correspondence: John R. Dolan, Univ. Paris 06, CNRS, UMR 7093, Lab. Oceanog. Villefranche-sur-Mer, Stn. Zool., BP 28, F-06230 Villefranche-sur-Mer, France; E-mail: dolan@obs-vlfr.fr
INTRODUCTION
Tintinnid ciliates are a ubiquitous component of
the microzooplankton in marine systems. They feed
primarily on nano-plankton sized phytoplankton. In
the microzooplankton, tintinnids are generally a minor
group compared to the other major groups commonly
distinguished as “oligotrich ciliates” and “heterotrophic
dinoflagellates” (e.g. Dolan et al. 1999). However,
tin-tinnid feeding activity can at times dominate that of the
microzooplankton (Karayami et al. 2005). Tintinnids in
turn serve as prey for a variety of metazoan
zooplank-ters such as copepods (Stoecker and Capuzzo 1990).
Tintinnid ciliates are characterized by the
posses-sion of a tubular or vase-shaped lorica harboring the
ciliate cell. Based on molecular data, they represent
a monophyletic group (Agatha and Strüder-Kypke
2007) and are then a coherent group based on
morphol-ogy, phylogeny and ecology. The characteristics of the
lorica have traditionally been employed to distinguish
the over 1,000 described species. Among lorica
char-acteristics used to distinguish species and form groups,
the diameter of the oral end of the lorica, “lorica oral
di-ameter” (LOD) appears to be the most reliable and
con-servative characteristic distinguishing species of
oth-erwise similar lorica architecture (Balech 1959; Gold
1969; Gold and Morales 1975a, c, 1976a; Laval-Peuto
and Brownlee 1986). Thus, diversity indexes of
tintin-nid communities have been correlated with indexes of
‘morphological diversity’ calculated using size-classes
of oral diameters as proxies for species (Dolan et al.
2002, 2006).
Lorica morphology is not only a valuable
taxo-nomic characteristic but has also been linked to
eco-logical characteristics of tintinnids especially in terms
of feeding activity. The maximal prey size ingested has
been reported to be about 45% of the LOD and
pre-ferred prey size about 25% of LOD (Heinbokel 1978,
Dolan et al. 2002). In terms of average community
characteristics of tintinnids, seasonal shifts in average
tintinnid community LOD have been reported in
dif-ferent coastal systems: the New York Bight (Gold and
Morales 1975b), the Bay of Fundy (Middlebrook et
al. 1978), Narragansett Bay (Verity 1987) and
Jamai-can coastal waters (Gilron et al. 1991). Such changes
have been hypothesized as reflecting seasonal changes
in size-spectrum of phytoplankton prey (Admiral and
Venekamp 1986).
Tintinnid ciliates range widely in size, from about
20 µm in lorica length (LL) to several hundred µm.
No-tably, ciliate cell size has proven difficult to relate to the
size of the lorica in any consistent fashion, occupying
from 12–50% of the lorica (e.g. Gilron & Lynn 1989a).
In addition, there is but a weak relationship between
the oral diameter and total length of the lorica, based on
data reported in the major monographic treatments of
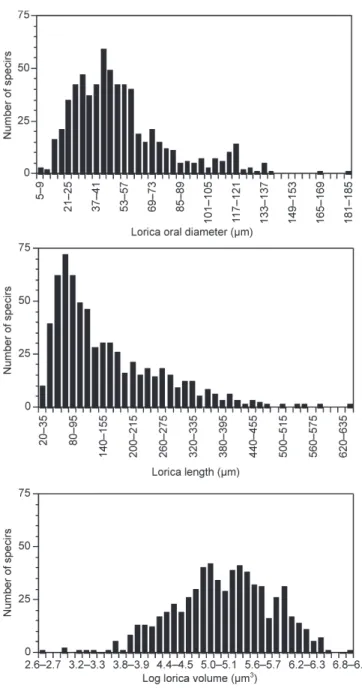
tintinnids (Fig. 1). Indeed, the distributions of the oral
diameters (LODs), lengths (LLs), and volumes (LVs),
while all non-normal (K-S normality test), appear
dis-tinct (Fig. 2). The distribution of LODs is less slightly
less right-skewed (1.2) than the distribution of LLs
(1.3). It should be noted that larger species, more
con-spicuous & easily found in net samples, may be
over-represented in monographic data. However, the trends
suggest that cell size, LL and LOD are not closely tied
together but may vary independently in response to
distinct selective forces and correlate with distinct
eco-logical characteristics.
Here data are examined from a variety of scattered
reports in an attempt to establish possible ecological
correlates of lorica dimension, specifically that of oral
diameter, length and volume, in tintinnid ciliates.
Re-lationships are examined with maximum growth rates
reported for species in natural populations. While
tin-tinnids are subject to predation by a wide variety of
or-ganisms, most of the existing data concerns copepods
for which ciliate microzooplankton are known to be
important prey (Calbet and Saiz 2005). Data from
stud-ies of predation on tintinnid ciliates by copepods of the
genus Acartia are reviewed. The relationship of
maxi-mum size of food ingested and preferred food size is
re-examined as well.
The interest in examining possible ecological
corre-lates of lorica dimensions is potentially of both
theoret-ical and practtheoret-ical value. On the one hand, relationships
Fig. 1. Scatterplot of lorica oral diameter against lorica length for
the 647 species of tintinnids for which average lorica dimensions are given in the monographs of Balech (1948), Campbell (1942), Hada (1938), Kofoid and Campbell (1929; 1939), and Marshall (1969). The two lorica dimensions are weakly related with an r2 value of 0.244.
Tintinnid Morphology and Ecology 237
Fig. 2. Distributions of lorica dimensions among tintinnids based
on the data shown and references given in Fig. 1. Note the distinct distributions of lorica oral diameters and lengths.
may in part explain the large morphological variety
displayed by the group as reflecting distinct
ecologi-cal characteristics. On practiecologi-cal grounds, lorica
dimen-sions, unlike species identifications, are amenable to
automated or semi-automated analysis. If lorica
dimen-sions can be related to ecological characteristics, it may
be possible to relate the some of the ecological
charac-teristics of a tintinnid assemblage based on simply on
lorica dimensions without recourse to expert taxonomic
knowledge. Thus, analysis of tintinnid assemblages in
terms of simple dimensions may provide information
on not only species diversity but also on the ecological
diversity of the assemblage.
MATERIALS AND METHODS
Relationships of lorica dimensions and maximum growth rates for 42 species were examined using data from studies of natural populations: Gilron and Lynn (1989b) a study in coastal Caribbean waters; Nagano and Uye (2002) an annual study in coastal waters of the Sea of Japan; Stoecker et al. (1983) in Perch Pond, NW Atlantic coast, and Verity (1986) a pluri-annual study in Narragensett Bay, NW Atlantic coast. All the rates were derived from experiments with incubations of natural populations of tintinnids in water which had been size-fractionated or filtered to remove metazoan predators. No attempt was made to correct or account for temperature as data were largely unavailable.
Lorica dimensions and susceptibility to copepod predation was examined based on data for 7 species of tintinnids. Copepod grazing, as maximal clearance rates, were extracted from reports on feeding in 3 species of Acartia which are all roughly comparable in size and represent most of the available data on copepod predation on tin-tinnids. Data on grazing by Acartia tonsa were taken from Gifford and Dagg (1988); Robertson (1983) and Stoecker and Egloff (1987). Clearance rates of Acartia clausi were extracted from Ayukai (1987) and for Acartia hudsonica from Turner & Anderson (1983).
Maximum prey size and lorica dimensions were examined using data on food vacuole contents of cells from natural populations of 20 species. Data reported in Heinbokel (1978) and Spitler (1973) on ingestion of starch particles were excluded as species-specific data were not reported. Data were extracted from Blackbourn (1974) and Kopylov and Tumantseva (1987) which reported average maximum sizes of prey found inside in food vacuoles of field-caught cells.
The relationships between preferred food size and lorica di-mensions were examined using data on 15 species feeding on ei-ther a natural prey spectrum (Capriulo 1982, Rassoulzadegan 1978, Rassoulzadegan and Etienne 1981), a wide range of cultured phyto-plankton of different sizes (Blackbourn 1974; Kamiyama and Arima 2001) or wheat starch particles (Kivi and Setälä 1995). Preferred food size was defined as the size corresponding with the maximum filtration rate reported for a given species.
Simple correlations were sought. Statistical relationships were examined using Statview (Abacus Concepts, Berkeley, CA, USA) to estimate correlation coefficients, slopes with associated error es-timates and probabilities. Simple linear regression was employed to examine relationships of maximum growth rate, maximum food size, preferred food size and lorica oral diameter, lorica length, and log lorica volume. Copepod clearance rates, which varied over or-ders of magnitude, were log transformed. Wherever reported, au-thor-supplied lorica dimensions and volumes were employed. Oth-erwise, average dimensions given in either Kofoid and Campbell (1929) or Marshall (1969) were used. Volumes were calculated us-ing formulae for appropriate shapes. As species of the coastal genus Tintinnopsis appeared over-represented in the data, analysis were also performed excluding data on Tintinnopsis species.
The complete data is available in a spread sheet as “Additional Material.”
RESULTS
Growth rate data of natural populations of the 42
species of tintinnids while dominated by species of the
genus Tintinnopsis (23 species) included maximum
ob-served rates of a wide range of species of the genera
Amphorellopsis, Codenellopsis, Eutintinnus, Favella,
Helicostomella, Metacylis, Stenosemella, and
Tintin-nidium. Results of the regression analysis are
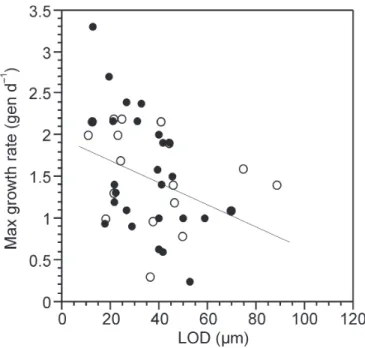
sum-marized in Table 1. Maximum observed growth rate is
significantly related only to LOD. The regression
equa-tion, “maximum generations per day = 1.95 – (0.015
*LOD),” yields estimates of 1.65 vs. 1.2 generations
d
–1for tintinnids with LODs of 20 µm and 50 µm,
re-spectively, a difference of about 40%. Examining data
on species other than Tintinnopsis, which reduces the
n from 42 to 19, no significant relationships were
de-tected. A scatterplot of the data is shown in Fig. 3.
Clearance rate of Acartia spp. feeding on tintinnids
included data on 7 species of Tintinnopsis, Favella, and
Eutintinnus. Visual inspection of scatterplots suggested
a curvilinear relationship reflecting an the expected
‘hump-shaped’ curve of feeding rate vs. prey size (Fig.
4). Results of a polynominal regression analysis are
summarized in Table 2. Clearance rate is significantly
related only to LOD, based on the probabilities of both
x and x
2. Analyzing data on species other than
Tintin-nopsis, which reduces the n from 7 to 5, did not alter
the relationships.
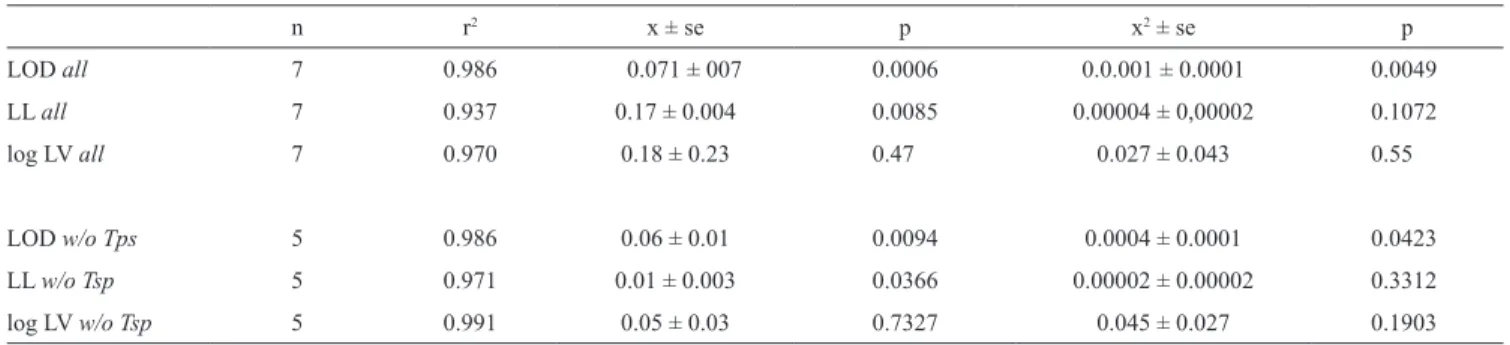
Table 1. Maximum growth rates and lorica dimensions. Results of
linear regression analysis considering lorica dimensions in microns as the independent variable and maximum growth rate as genera-tions per day as the dependant variable. Relagenera-tionships denoted all include all data while those denoted w/o Tps excluded data on spe-cies of Tintinnopsis. The scatterplot is shown in Fig. 3.
n r2 Slope ± se p LOD all 42 0.121 –0.015 ± 0.006 0.0237 LL all 42 0.002 –0.00003 ± 0.001 0.797 log LV all 42 0.044 –0.229 ± 0.168 0.1823 LOD w/o Tps 19 0.107 –0.008 ± 0.006 0.1721 LL w/o Tsp 19 0.0002 0.0008 ± 0.001 0.9524 log LV w/o Tsp 19 0.009 –0.063 ± 0.165 0.707
Fig. 3. Reproductive potential. Scatterplot of tintinnid lorica oral
diameter and the maximum observed growth rate. Filled circles rep-resent data from species Tintinnopsis. See discussion for details and Table 1 for statistics. Line represents the regresion relationship for the pooled data set.
Fig. 4. Susceptability to predation. Scatterplot of tintinnid lorica oral
diameter and the maximum observed clearance rate (log) of Acartia spp feeding on tintinnids. Filled circles represent data from species Tintinnopsis. See discussion for details and Table 2 for statistics. Line represents the regresion relationship for the pooled data set.
Tintinnid Morphology and Ecology 239
were found but not LL with the tightest relationship
be-ing with LOD. Similar relationships were evident
con-sidering data without Tintinnopsis spp., except that the
tightest correlation was found with log LV (Table 4).
A scatterplot of the data relating LOD to preferred prey
size is shown in Fig. 6. The equation relating preferred
prey size to LOD, ‘preferred prey size = (0.18 * LOD)
+ 3.3, gives an estimate of preferred prey size equal to
about 20% of LOD.
DISCUSSION
Lorica morphology in tintinnid ciliates has
histori-cally been used to distinguish species (e.g. Claparède
and Lachmann (1858–1860) and remains today the
ba-sis of tintinnid classification schemes (e.g. Lynn 2008).
Table 2. Copepod grazing rates and lorica dimensions. Results of polynominal regression analysis considering lorica dimensions (µm), asthe independent variable and maximum copepod clearance rate (log ml copepod–1 d–1) as the dependant variable. Relationships denoted all include all data while those denoted w/o Tps excluded data on species of Tintinnopsis. The scatterplot is shown in Fig. 4.
n r2 x ± se p x2 ± se p LOD all 7 0.986 0.071 ± 007 0.0006 0.0.001 ± 0.0001 0.0049 LL all 7 0.937 0.17 ± 0.004 0.0085 0.00004 ± 0,00002 0.1072 log LV all 7 0.970 0.18 ± 0.23 0.47 0.027 ± 0.043 0.55 LOD w/o Tps 5 0.986 0.06 ± 0.01 0.0094 0.0004 ± 0.0001 0.0423 LL w/o Tsp 5 0.971 0.01 ± 0.003 0.0366 0.00002 ± 0.00002 0.3312 log LV w/o Tsp 5 0.991 0.05 ± 0.03 0.7327 0.045 ± 0.027 0.1903
Table 3. Maximum average prey size and lorica dimensions.
Re-sults of linear regression analysis considering lorica dimensions in microns as the independent variable and maximum observed prey size (equivalent spherical diameter, µm) as the dependant variable. Relationships denoted all include all data while those denoted w/o Tps excluded data on species of Tintinnopsis. The scatterplot is shown in Fig. 5. n r2 Slope ± se p LOD all 20 0.763 0.32 ± 0.04 0.0001 LL all 20 0.363 0.06 ± 0.02 0.005 log LV all 20 0.719 12.4 ± 1.85 0.0001 LOD w/o Tps 15 0.702 0.32 ± 0.047 0.00001 LL w/o Tsp 15 0.332 0.06 ± 0.023 0.0246 log LV w/o Tsp 15 0.699 12.9 ± 2.35 0.001
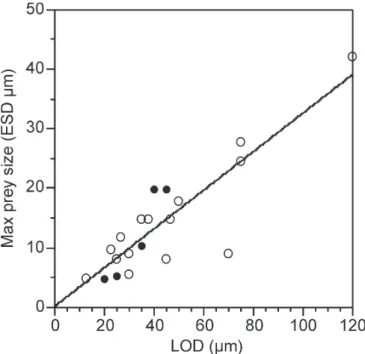
Data on the maximum prey size found in wild
in-dividuals consisted of observations on 20 species of
Epiplocylis, Eutintinnus, Favella, Helicostomella,
Pro-plectella, Rhabdonellopsis, Stenosemella, Tintinnidium
and Tintinnopsis. Maximum prey size was significantly
related to LOD, LL, and log LV with the tightest fit
as-sociated with LOD and similar relationships with and
without Tintinnopsis species (Table 3). The equation
describing the relationship between LOD and
maxi-mum observed prey size, ‘maximaxi-mum prey size = (0.325
*LOD) + 0.22, gives an estimate of about 1/3 LOD.’
A scatterplot of the data relating LOD to maximum
prey size is shown in Fig. 5.
The relationships of preferred food size, defined as
that corresponding with the highest clearance rate, drew
on data for 15 species of the genera Helicostomella,
Fa-vella, Stenosemella and Tintinnopsis. Significant
rela-tionships of preferred food size and LOD and log LV
Table 4. Preferred prey size and lorica dimensions. Results of linear
regression analysis considering lorica dimensions in microns as the independent variable and preferred prey size, (equivalent spheri-cal diameter, µm), that corresponding with the maximum reported clearance rate as the dependant variable. Relationships denoted all include all data while those denoted w/o Tps excluded data on spe-cies of Tintinnopsis. The scatterplot is shown in Fig. 6.
n r2 Slope ±se p LOD all 15 0.399 0.18 ± 0.06 0.0116 LL all 15 0.096 0.02 ± 0.02 0.2603 log LV all 15 0.368 6.24 ± 6.42 0.0165 LOD w/o Tps 6 0.801 0.18 ± 0.05 0.0159 LL w/o Tsp 6 0.192 0.02 ± 0.02 0.3480 log LV w/o Tsp 6 0.951 8.34 ± 0.5 0.0009
Fig. 5. Maximum prey size. Scatterplot of tintinnid lorica oral
di-ameter and the average maximum prey size observed in tintinnids. Filled circles represent data from species Tintinnopsis. See discus-sion for details and Table 3 for statistics. Line represents the re-gresion relationship for the pooled data set.
Fig. 6. Preferred prey size. Scatterplot of tintinnid lorica oral
diam-eter and the prey size corresponding with maximum filtration rate in tintinnids. Filled circles represent data from species Tintinnopsis. See discussion for details and Table 4 for statistics. Line represents the regresion relationship for the pooled data set.
Nonetheless, the lorica-based classification of tintinnids
has been challenged on multiple grounds. For example,
recent re-descriptions have convincingly argued that
single species have been given several different names
based on relatively slight differences in lorica shape
and size (e.g. Agatha 2010a, Agatha and Riedel-Lorjé
2006, Agatha and Tsai 2008). Indeed, very variable
lorica architecture has been documented in supposed
single species (e.g. Boltovskoy et al. 1990,
Laval-Peu-to 1981). Furthermore, molecular studies suggest that
some genera, such as Tintinnopsis may be polyphyletic
(Snoeybos-West et al. 2002). However, while lorica
morphology may be a less than certain taxonomic
char-acteristic, (e.g. Alder 1999) it does appear to correlate
with some basic ecological parameters.
Lorica oral diameter shows a significant, albeit
relatively weak, relationship with maximum observed
growth rate, in contrast to the volume or length of the
lorica which appear unrelated to maximum observed
growth rate (Table 1). Among ciliates and other
pro-tists, it is well known that maximum reproductive rate
declines with cell size (e.g. Fenchel 1974). Hence, an
explanation for the relationship of LOD and growth
rate is that oral diameter is much more closely linked
to ciliate cell size than lorica length or volume. Data
extracted from Gilron & Lynn (1989a) which examined
ciliate cell volume in 17 tintinnid species supports this
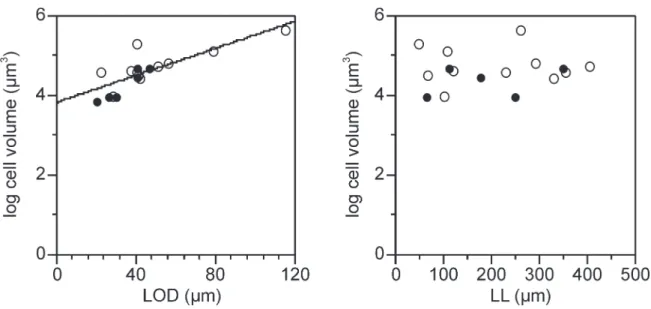
hypothesis (Fig. 7).
The scatter apparent in the data of maximum
report-ed growth rate may be genuine or in part reflect
un-corrected temperature effects as data was unavailable
for the majority of growth rate estimates. Furthermore,
it should be stressed that the data consist of maximum
observed growth rate in field experiments which may
be a poor proxy for actual reproductive potential. Given
these error sources, the finding of a weak but significant
relationship between LOD and maximum observed
growth suggests that there is a relationship between
LOD and maximum growth rate.
The data set used to probe the relationship between
lorica dimension and susceptibility to predation was
small, consisting of data on only 7 tintinnid species
subjected to predation by 3 different species of the
cala-noid copepod Acartia. None the less, a highly
signifi-cant relationship was found suggesting that small LOD
species are subject to lower predation rates, based on
the maximum filtration rates reported (Table 2; Fig. 4).
Lorica volume and length appeared unrelated to
cope-pod predation rates. The mechanism behind an
appar-Tintinnid Morphology and Ecology 241
ent preference for LOD rather than length or volume is
obscure. Possibly LOD is reflected in swimming speed,
yielding increases in predator detection or encounter
rates. Alternatively, Acartia capture success may
de-pend more on prey width than length. Given that
Acar-tia species are characteristic of estuarine and coastal
waters, the extension of the relationship to open water
systems dominated by other copepod genera, seems
plausible but remains uncertain.
The relationship found between average maximum
prey size and LOD, LL and log LV echo previous
find-ings of the relationship between LOD and maximum
food size ingested established by Spittler (1973),
Blackbourn (1974) and Heinbokel (1978). The data
analyzed here are different in that they represent only
prey found inside field-caught individuals as opposed
to including data on the ingestion of starch particles.
This likely explains the finding of maximum prey size
of about 1/3 LOD as opposed to the figure of 45% of
LOD commonly cited in reviews (e.g. Capriuolo 1990).
While the strongest relationship was found with LOD
(Fig. 5), significant relationships were also apparent
with LL and log LV (Table 3). It should be noted that
the relationships are based on the averages of
maxi-mum observed natural prey items. It is not uncommon
to find individuals having ingested extraordinarily large
prey items, e.g. Favella having ingested Tintinnopsis
cylindrica (Gavrilova and Dolan 2007).
Preferred prey size, estimated as the prey size
cor-responding with the maximum clearance rate, was
sig-nificantly related to both LOD and log LV (Table 4).
The tightest relationship was with LOD, equating
pre-ferred food size to about 20% of LOD (Fig. 6). This is
similar to relationship previously reported by Dolan et
al. (2002) of 25% based on slightly a smaller data set.
While it appears reasonable to characterize the lorica
diameter or volume of a tintinnid species as a
corre-late of its preferred prey size, it should be recalled that
selective feeding in ciliates among identical-size sized
prey is well documented (e.g. Christaki et al. 1998,
Sanders 1988). Among tintinnids, studies have argued
both for and against the phenomena in a single
spe-cies, Favella ehrenbergii (Stoecker et al. 1981, Hansen
1995). The relationships documented here most likely
reflect a mechanical effect such as increased swimming
speeds associated with larger LOD and log LV
permit-ting increased encounter rates with generally rarer large
prey items or simply spacing of oral membranelles
in-creasing with LOD and log LV.
Relationships were examined without data from
Tintinnopsis spp to see if relationships extended
be-yond the single over-represented genus. The major
trends were unchanged with the exclusion of data on
Tintinnopsis species. While this suggests that the
rela-tionships described may then be extrapolated to
tintin-nids in general, it should be noted nearly all of the data
Fig. 7. Tintinnid cell volume and lorica dimensions. Scatterplots of lorica oral diameter and lorica length against cell volumes in 17spe-cies based on data extracted from Gilron and Lynn (1989a). Filled circles represent data from spespe-cies Tintinnopsis. Lorica oral diameter is significantly related to cell volume (r2 = 0.602) in contrast to lorica length. Line represents the regresion relationship for the pooled data set.
concerned tintinnids from coastal environments. This
ad-mitted, open water tintinnid communities often contain
many of the same species as those found in near shore
environments (with the notable exception of Tintinnopsis
spp.). Therefore, there is little a priori reason to expect
that the simple relationships derived from data on coastal
tintinnids would not extend to open water tintinnids.
A question which remains is the adaptive value or
ecological correlate of lorica length. For example, the
value of quite long loricas for relatively small cell sizes
found in many open water forms (e.g. Salpingella,
Cli-macocylis). These large loricas likely represent a
con-siderable metabolic cost not only in terms of fabrication
but also in terms of cell motility. Comparing
sedimenta-tion rates of empty hyaline loricas, Suzuki and
Tanigu-chi (1995) found a positive relationship between lorica
size and sinking rate. It is tempting to speculate that
long loricas into which the cell may contract far from
lorica opening, may be provide refuge against other
protistan predators, for example heterotrophic
dinofla-gellates. Defense against physical contact with
protis-tan predators may also explain the existence of a variety
distinct forms of lorica closing apparatuses known in
tintinnids (Agatha 2010b).
The analysis presented here, showing that distinct
LODs correspond with distinct ecological correlates in
part explains the large morphological variety displayed
by the group as reflecting adaptation to distinct
ecologi-cal niches. Characterization of tintinnid assemblages
simply in terms of LODs can then provide information
on the ecological diversity of the assemblage.
Further-more, such information may be obtainable using
auto-mated or semi-autoauto-mated image analysis systems.
CONCLUSION
In tintinnid ciliates, characterized by the possession
of a lorica, diverse ecological characteristics appear to
be relatable to dimensions of the lorica and most tightly
with lorica oral diameter (LOD). Maximum observed
growth rates of wild populations is inversely related to
oral diameter as is ciliate cell size. Predation rates of
species of the copepod Acartia feeding on tintinnids
in-creases with LOD. The maximum size of natural prey
ingested and preferred prey size both scale with LOD.
Characterization of tintinnid communities simply in
terms of LODs can provide information on the
ecologi-cal characteristics of the species assemblage.
Acknowledgements. This work was conducted in the framework of
the AQUAPARADOX project financed by the ANR-BIODIVER-SITE program and the Pole-Mer PACA. The thoughtful comments of the 3 anonymous reviewers as well as those of Sabine Agatha, Urania Christaki, Wayne Coats, and Jeff Turner led to significant improvements. This work is dedicated to the memories of Gerry Capriulo and Peter Verity whose work significantly advanced our knowledge of tintinnid biology and provided much of data analyzed here.
REFERENCES
Admiraal W., Venekamp L. A. H. (1986) Significance of tintinnid grazing during blooms of Phaeocystis pouchetii (Haptophyce-ae) in Dutch coastal waters. Neth. J. Sea Res. 20: 61–66 Agatha S. (2010) Redescription of Tintinnopsis parvula Jörgensen,
1912 (Ciliophora: Spirotrichea: Tintinnina) including a novel lorica matrix. Acta Protozool. 49: 213–234
Agatha S. (2010b) A light and Scanning electron microscope study of the closing apparatus in tintinnid ciliates (Ciliphora, Spirotri-cha, Tintinna): a forgotten synapomorphy. J. Eukar. Microbiol.
57 (in press)
Agatha S., Riedel-Lorjé J. C. (2006) Redescription of Tintinnopsis cylindrica Daday, 1887 (Ciliophora: Spirotricha) and unifica-tion of tintinnid terminology. Acta Protozool. 45: 137–151 Agatha S., Strüder-Kypke M. C. (2007) Phylogeny of the order
Choreotrichida (Ciliophora, Spirotricha, Oligotrichea) as in-ferred from morphology, ultrastructure, ontogenesis, and SSrRNA gene sequences. Eur. J. Protistol. 43: 37–63
Agatha S., Tsai S.-F. (2008) Redescription of the tintinnid Stenose-mella pacifica Kofoid and Campbell, 1929 (Ciliophora, Spirot-richa) based on live observation, protargol impregnation, and scanning electron microscopy. J. Eukaryot. Microbiol. 55: 75–85 Alder V. A. (1999) Tintinnoinea in South Atlantic Zooplankton, pp.
321–384. In: South Atlantic Zooplankton, (Ed. D. Boltovskoy). Backhuys Publishers, Leiden, The Netherlands. Vol. 1 868 pp; Vol. 2 869–1706
Ayukai T. (1987) Predation by Acartia clausi (Copepoda: Cala-noida) on two species of tintinnids. Mar. Microb. Fd. Webs 2: 45–52
Balech E. (1948) Tintinnoinea de Atlantida (R. O. del Uruguay) Protozoa Ciliata Oligotr. Com. Mus. Argent. Cienc. Nat. “Ber-nardino Rivadavia” (Zool.) 7: 1–23
Balech E. (1959) Tintinnoinea del Mediterraneo. Trab. Inst. Esp. Oceanogr. 28: 1–88
Blackbourn D. J. (1974) The feeding biology of tintinnid protozoa and some other inshore microzooplankton. PhD Thesis. Univ. British Columbia, Canada.
Boltovskoy D., Dinofrio E. O., Alder V. A. (1990) Intraspecific vari-ability in Antarctic tintinnids: the Cymatocylis affinis/conval-laria species group. J. Plankton Res. 12: 403–413
Calbet A., Saiz E. (2005) The ciliate copepod link in marine ecosys-tems. Aquat. Microb. Ecol. 38: 157–167
Campbell A. S. (1942) The Oceanic Tintinnoina of the Plankton Gathered during the Last Cruise of the CARNEGIE. Carnegie Institute of Washington, Publication 537
Capriulo G. M. (1982) Feeding of field collected tintinnid micro-zooplankton on natural food. Mar. Biol. 71: 73–86
Capriulo G. M. (1990) Feeding related ecology of marine proto-zoa, pp. 186–259. In: Ecology of Marine Protoproto-zoa, (Ed. G. M. Capriulo). Oxford University Press, New York
Tintinnid Morphology and Ecology 243
Christaki U., Dolan J. R., Pelegri S., Rassoulzadegan F. (1998) Con-sumption of pico-size particles by marine ciliates: effects of the physiological state of the ciliate and particle quality. Limnol. Oceanogr. 43: 458–464
Claparède E., Lachmann J. (1858–1860) Études sur les infusoires et les rhizopodes. Mem. Inst. Genevois 5: 1–260, 6: 261–482 Dolan J. R., Claustre H., Vidussi F. (1999) Planktonic ciliates in the
Mediterranean Sea: longitudinal trends. Deep-Sea Res. I, 46: 2025–2039
Dolan J. R., Claustre H., Carlotti F., Plounevez S., Moutin T. (2002) Microzooplankton diversity: relationships of tintinnid ciliates with resources, competitors and predators from the Atlantic Coast of Morocco to the Eastern Mediterranean. Deep-Sea Res. I, 49: 1217–1232
Dolan J. R., Jacquet S., Torreton J.-P. (2006) Comparing taxonomic and morphological biodiversity of tintinnids (planktonic cili-ates) of New Caledonia. Limnol. Oceanogr. 51: 950–958 Fenchel T. (1974) Intrinsic rate of natural increase: The relationship
with body size. Oecologia 14: 317–326
Gavrilova N., Dolan J. R. (2007) A note on species lists and ecosys-tem shifts: Black Sea tintinnids, ciliates of the microzooplank-ton. Acta Protozool. 46: 279–288
Gifford D. J., Dagg M. J. (1988) Feeding of the estuarine copepod Acartia tonsa Dana: carnivory vs. herbivory in natural micro-plankton assemblages. Bull. Mar. Sci. 43: 458–468
Gilron G. L., Lynn, D. H. (1989a) Assuming a 50% cell occupancy of the lorica overestimates tintinnine ciliate biomass. Mar. Biol.
103: 413–416
Gilron G. L., Lynn D. H. (1989b) Estimates on in situ population growth rates of four tintinnine ciliate species near Kingston Harbour, Jamaica. Est. Coast. Shelf Sci. 29: 1–10
Gilron G. L., Lynn D. H., Roff J. C. (1991) The annual cycle of biomass and production of tintinnine ciliates in a tropical neretic region near Kingston, Jamaica. Mar. Microb. Fd. Webs 5: 95– 113
Gold K. (1969) Tintinnida: feeding experiments and lorica develop-ment. J. Protozool. 16: 507–509
Gold K., Morales E. A. (1975a) Tintinnida of the New York Bight: loricae of Parafavella gigantea, P. parumdentata, and Ptycho-cylis obtusa. Trans. Am. microsc. Soc. 94: 142–145
Gold K., Morales E. A. (1975b) Seasonal changes in lorica sizes and the species of Tintinnida in the New York Bight. J. Protozool.
22: 520–528
Gold K., Morales E. A. (1976c) Studies on Tintinnida using scan-ning electron microscopy. Trans. Am. microsc. Soc. 95: 707–711 Hada Y. (1938) Studies on the Tintinnoinea from the Western Tropi-cal Pacific. Journal of the Faculty of Science Hokkaido Imperial University, Series 4, Zoology 6: 87–190
Hansen P. J. (1995) Growth and grazing response of a ciliate feeding on the red tide dinoflagellate Gyrodinium aureolum in monocul-ture and in mixmonocul-ture with a non-toxic alga. Mar. Ecol. Prog. Ser.
121: 65–72
Heinbokel J. F. (1978) Studies on the functional role of tintinnids in the Southern California Bight. II. Grazing rates of field popula-tions. Mar. Biol. 47: 191–197
Kamiyama T., Arima S. (2001) Feeding characteristics of two tintin-nid ciliate species on phytoplankton including harmful species: effects of prey size on ingestion rates and selectivity. J. Exp. Mar. Biol. Ecol. 257: 281–296
Karayanni H., Christaki U., Van Wambeke F., Denis M., Moutin T. (2005) Influence of ciliated protozoa and heterotrophic
nano-flagellates on the fate of primary production in the northeast Atlantic Ocean. J. Geophys. Res – Oceans 110: (C7) no. C07S1 Kivi K., Setälä O. (1995) Simultaneous measurement of food parti-cle selection and parti-clearance rates of planktonic oligotrich ciliates (Ciliophora: Oligotrichina). Mar. Ecol. Prog. Ser. 119: 125–137 Kofoid C. A., Campbell A. S. (1929) A conspectus of the marine and
fresh-water Ciliata belonging to the suborder Tintinnoinea, with descriptions of new species principally from the Agassiz Ex-pedition to the eastern tropical Pacific 1904–1905. Univ. Calif. Publs Zool. 34: 1–403
Kofoid C. A., Campbell A. S. (1939) Reports on the scientific results of the expedition to the eastern tropical Pacific, in charge of Al-exander Agassiz, by the U. S. Fish Commission Steamer “Alba-tross,” from October, 1904, to March, 1905, Lieut.-Commander L. M. Garrett, U. S. N. Commanding. XXXVII. The Ciliata: The Tintinnoinea. Bull. Mus. comp. zool., Harv. 84: 1–473 Kopylov A. I., Tumantseva N. I. (1987) Analysis of the contents
of tintinnid food vacuoles and evaluation of thier contribution to the consumption of phytoplankton production off the Peru coast. Oceanology 27: 343–347
Laval-Peuto M. (1981) Construction of the lorica in Ciliata Tintin-nina. In vivo study of Favella ehrenbergii: variability of the phenotypes during the cycle, biology, statistics, biometry. Pro-tistologica 17: 249–272
Laval-Peuto M., Brownlee D. C. (1986) Identification and system-atics of the Tintinnina (Ciliophora): evaluation and suggestions for improvement. Annls Inst. Océanogr., Paris 62: 69–84 Lynn D. H. (2008) The Ciliated Protozoa. Characterization,
Clas-sification, and Guide to the Literature. 3rd ed. Springer, 605 pp. Middlebrook K., Emerson C. W., Roff J. C., Lynn D. H. (1987)
Dis-tribution and abundance of tintinnids in the Quoddy region of the Bay of Fundy. Can. J. Zool. 65: 594–601
Marshall S. M. (1969) Protozoa, Order: Tintinnida. In: Fiches d’identification du zooplankton, (Eds. J. H. Fraser, V. K. Han-sen). Conseil Permanent International pour l’Exploration de la Mer, Charlottenlundslot – Denmark: Sheets 117–127
Nagano N., Uye S. (2002) Seasonal variations in abundance, bio-mass, in situ growth rate and production of tintinnid ciliates in Kure Port, the inland Sea of Japan. Bull. Soc. Sea Water Sci. Jpn. 56: 142–149
Rassoulzadegan F. (1978) Dimensions et taux d’ingestion des parti-cules consommées par une tintinnide: Favella ehrenbergii (Clap et Lachm.) Jörg., cilié pélagique marin. Annls Inst. Océanogr., Paris 54: 17–24
Rassoulzadegan F., Etienne M. (1981) Grazing rate of the tintinnid Stenosemella ventricosa (Clap & Lachm.) Jörg. on the spectrum of the naturally occurring particulate matter from a Mediterra-nean neritic area. Limnol. Oceanogr. 26: 258–270
Robertson J. R. (1983) Predation by estuarine zooplankton on tin-tinnid ciliates. Est. Coast. Shelf Sci. 16: 27–36
Sanders, R.W. (1988) Feeding by Cyclidium sp. (Ciliophora, Scuti-cociliatida) on particles of different sizes and surface properties. Bull. Mar. Sci. 43: 446–457
Snoeybos-West O. L. O., Salcedo T., McManus G. B., Katz L. (2002) Insights into the diversity of choreotrich and oligotrich ciliates (class Spirotrichea) based on genealogical analyses of multilpe loci, Int. J. Syst. Evol. Microbiol. 52: 1901–1913 Suzuki T., Taniguchi A. (1995) Sinking rates of loricae of some
common tintinnid ciliates. Fish. Oceanogr. 4: 257–263 Stoecker D. K., Capuzzo J. M. (1990) Predation on protozoa: its
Stoecker D. K., Egloff D. A. (1987) Predation by Acartia tonsa Dana on planktonic ciliates and rotifers. J. Exp. Mar. Biol. Ecol.
110: 53–68
Stoecker D., Guillard R. R. L., Kavee R. M. (1981) Selective preda-tion by Favella ehrenbergii (Tintinnia) on and among dinofla-gellates. Biol. Bull. 160: 136–145
Stoecker D. K., Davis L. H., Provan A. (1983) Growth of Favella sp. (Ciliata: Tintinnina) and other microzooplankters in cages incubated in situ and comparison to growth in vitro. Mar. Biol.
75: 293–302
Turner J. T., Anderson D. M. (1983) Zooplankton grazing during dinoflagellate bloms in a Cape Cod embayment, with observa-tions of predation upon tintinnids by copepods. P.S .Z.N.I. Mar. Ecol. 4: 359–374
Verity P. G. (1986) Growth rates of natural tintinnid populations in Narragansett Bay. Mar. Ecol. Prog. Ser. 29: 117–126
Verity P. G. (1987) Abundance, community composition, size distri-bution, and production rates of tintinnids in Narragansett Bay, Rhode Island. Est. Coast. Shelf Sci. 24: 671–690
Received on 6th April, 2010; revised on 3rd May, 2010; accepted on 3rd May, 2010
Supporting information
A complete data set is available as additional material accompany-ing this paper at the journal website.

![[Transforming growth factor-betas: smad signaling and roles in physiopathology]](data:image/gif;base64,R0lGODlhAQABAIAAAP///wAAACH5BAEAAAAALAAAAAABAAEAAAICRAEAOw==)