HAL Id: hal-01401540
https://hal.sorbonne-universite.fr/hal-01401540
Submitted on 23 Nov 2016HAL is a multi-disciplinary open access archive for the deposit and dissemination of sci-entific research documents, whether they are pub-lished or not. The documents may come from teaching and research institutions in France or abroad, or from public or private research centers.
L’archive ouverte pluridisciplinaire HAL, est destinée au dépôt et à la diffusion de documents scientifiques de niveau recherche, publiés ou non, émanant des établissements d’enseignement et de recherche français ou étrangers, des laboratoires publics ou privés.
Declines in both redundant and trace species
characterize the latitudinal diversity gradient in
tintinnid ciliates
John R Dolan, Eun Jin Yang, Sung-Ho Kang, Tae Siek Rhee
To cite this version:
John R Dolan, Eun Jin Yang, Sung-Ho Kang, Tae Siek Rhee. Declines in both redundant and trace species characterize the latitudinal diversity gradient in tintinnid ciliates. ISME Journal, Nature Publishing Group, 2016, 10 (9), pp.2174 - 2183. �10.1038/ismej.2016.19�. �hal-01401540�
Declines in Both Redundant and Trace Species Characterize the Latitudinal Diversity Gradient in Tintinnid Ciliates
4
John R. Dolan1*, Eun Jin Yang2, Sung-Ho Kang3, Tae Siek Rhee4 1
Laboratoire d'Océanography de Villefranche-sur-Mer, CNRS, Université Pierre et Marie Curie (Paris 6 ) UMR 7093, Station Zoologique, B.P. 28, 06230 Villefranche-8
sur-Mer, France.
2Department of Polar Ocean Environment, Korea Polar Research Institute, 26 Songdomirae-ro, Yeonsu-gu, Incheon 406-840, South Korea ([email protected]) 12
3Department of Polar Ocean Environment, Korea Polar Research Institute, 26 Songdomirae-ro, Yeonsu-gu, Incheon 406-840, South Korea ([email protected]) 16
4Department of Polar Ocean Environment, Korea Polar Research Institute, 26 Songdomirae-ro, Yeonsu-gu, Incheon 406-840, South Korea ([email protected]) *Correspondence to: John R. Dolan, Laboratoire d'Oceanography de Villefranche-20
sur-Mer, CNRS, Université Pierre et Marie Curie (Paris 6) UMR 7093, Station
Zoologique, B.P. 28, 06230 Villefranche-sur-Mer, France ([email protected]) fax: +33 4 93 76 38 22
24
We the authors declare there are no competing financial interests in relation to the work described.
Abstract
28
The latitudinal diversity gradient is a well-known biogeographic pattern. However, rarely considered is how a cline in species richness may be reflected in the
characteristics of species assemblages. Fewer species may equal fewer distinct 32
ecological types, or declines in redundancy (species functionally similar to one another) or fewer trace species, those occurring in very low concentrations. We focused on tintinnid ciliates of the microzooplankton in which the ciliate cell is housed inside a species-specific lorica or shell. The size of lorica oral aperture, the lorica oral 36
diameter (LOD), is correlated with a preferred prey size and maximum growth rate. Consequently, species of a distinct LOD are distinct in key ecologic characteristics while those of a similar LOD are functionally similar or redundant species. We sampled from East Sea/Sea of Japan to the High Arctic Sea. We determined 40
abundance distributions of biological species and also ecological types by grouping species in LOD size-classes, sets of ecologically similar species. In lower latitudes there are more trace species, more size-classes and the dominant species are accompanied by many apparently ecologically similar species, presumably able to 44
replace the dominant species, at least with regard to the size of prey exploited. Such redundancy appears to decline markedly with latitude in assemblages of tintinnid ciliates. Furthermore the relatively small species pools of the northern high latitude assemblages suggest a low capacity to adapt to changing conditions.
48
Keywords: biodiversity, ciliata, rare species, species packing, tintinnida
Running title: High Latitude Assemblages
Introduction
A very wide variety of taxa, both multicellular and microbial, show a latitudinal diversity gradient (Gaston & Spicer 2003). Typically, species richness peaks in the tropics, often at about 20°, dips slightly at the equator and decreases markedly with 56
latitude both north and south. Tintinnid ciliates of the marine microzooplankton literally provide a textbook example of the pattern (Gaston & Spicer 2003). Slight variations of the pattern characterize other protist taxa of the marine plankton such as foraminifera (Rutherford et al. 1999) and Ceratium species of the phytoplankton 60
(Dolan 2011). The latitudinal diversity gradient is the oldest known biogeographic pattern and the mechanisms generating it have long been debated with dozens of theories proposed, none of which have found wide acceptance (Willig et al. 2003). A universal explanation of the latitudinal diversity gradient has been termed 'The Holy 64
Grail of Ecology' (Adams 2009). Thus, while there is little agreement as to why the gradient exists, most do acknowledge that species richness often declines with latitude (Adams 2009). The structure of species assemblages quite likely often differs with species richness but exactly how is difficult to predict. Declines in species 68
richness can be reflected in various ways with different consequences concerning the ecological characteristics of a species assemblage.
Fewer species can represent a reduction in the overall variety or range of species within an assemblage. Less variety among species can translate into a lower 72
capacity to respond to changes in resource compostion or predation pressure. For example, a smaller range of consumer species could have a lower capacity to exploit changes in the size or qualities of available prey items. Alternatively, lower species richness may represent only fewer forms present in very low concentrations, outside 76
their usual habitat, members of the “accidental biosphere” (Weisse 2014). These species likely have low actual or potential ecological impact. Besides a decline in variety, lower species richness may translate into fewer presumptive redundant species (i.e., species of similar ecological characteristics) able to replace dominant 80
species subject to a high specific mortality. Theoretically, the presence of redundant species should increase the resiliency of an assemblage, meaning its capacity to resist perturbation and survive changes in conditions (Naeem 1998).
Recent studies have re-emphasized the tremendous diversity of protists in the 84
marine plankton (de Vargas et al. 2015). The phylogenetic diversity and extreme ecological complexity of protistan assemblages makes assessing how assemblages are structured a daunting task (e.g., Lima-Mendez et al. 2015). Among planktonic protists, tintinnids are an example of a phylogenetically and ecologically coherent 88
group and so represent a taxon in which study of the structure of assemblages are considerably simplified. Tintinnid ciliates also represent an ideal group to examine with regard to the question of how the structure of species assemblages varies with latitude. This is because not only do they show a typical latitudinal diversity gradient 92
but also the population structure of temperate, sub-tropical and tropical populations are well known and species of similar ecology share similar morphologies allowing identification of ecologically redundant species.
Tintinnid ciliates are characterized by the possession of a shell or lorica whose 96
architecture and dimensions form the basis of classic taxonomic schemes (Figure 1). About 1,200 species are in the literature (Agatha & Strüder-Kypke 2012); virtually all are restricted to the marine plankton. The diameter of the mouth-end of the lorica, lorica oral diameter (LOD) is a conservative taxonomic character (Laval-Peuto & 100
Brownlee 1986). It does not change with development; newly divided cells form a new lorica with the same oral diameter as the fully developed organism (Agatha et al. 2013). Critically, LOD, analogous to gape-size, is related to both the size of the food items ingested and maximum growth rate. The largest prey item ingested is about 0.5 104
the LOD in longest dimension and a given species feeds most efficiently on prey about 0.25 of its LOD in size. LOD is negatively related to maximum growth rate. This is because LOD is positively related to the volume of the cell occupying the lorica (Dolan 2010) and tintinnids follow the common inverse relationship between cell size 108
and maximum specific growth rate (Montagnes 2013). Tintinnid species with a similar LOD, or mouth size, are usually similar in terms of both preferred prey size and maximum growth rate; here these similarities are taken as indicating ecological redundancy.
112
The structure of tintinnid populations, in terms of both species abundance distributions and distributions of species grouped in size-classes, has been characterized for the species-rich assemblages of tropical, sub-tropical and
temperate systems (Dolan et al. 2007; 2013). Typically in these systems, dozens of 116
species can be found in material from 10-20 l (Dolan & Stoeck 2011). In general, species abundance distributions are log-series or log-normal distributions while grouping forms by size-classes rather than species yields a geometric distribution (Dolan et al. 2007; 2013). Assemblages are overall structured by "mouth size". 120
Typically there are 4 to 10 abundant species and these are of mouth sizes distinct from one another. The other species, of markedly less abundance, can be divided into two groups. The first is composed of those with mouth sizes similar to one of the dominant species; these are ecologically redundant forms. The second group is 124
formed of species in LOD size-classes distinct from those of the dominants and these species appear to be occasional, ephemeral, or rare species (Dolan et al. 2009) and are generally present in very low concentrations (Dolan et al. 2013). However, it is important to note that the categories of ʻredundantʼ and trace or ʻrareʼ are not 128
exclusive. If a species found in trace concentrations is in a size-class with other species, then it is both redundant and rare while if alone in a size-class then it is not redundant but rare with ecological characteristics distinct from all the other species. Tropical, subtropical, and temperate assemblages are characterised by high 132
species richness reflecting both considerable species redundancy as well as the presence of species with morphologies distinct from abundant forms but found in low concentrations. In this study we address the question of how sub-arctic and arctic communities with lower species richness are structured compared to temperate 136
communities.
We characterized communities along a latitudinal gradient of decreasing species richness. We examined large-scale or metapopulation characteristics in terms of species and in terms of 'ecotypes', defined here as species of similar feeding 140
ecology and maximum growth rate based on LOD or mouth size. In 2012 we sampled populations of the East Sea/Sea of Japan, the North Pacific Ocean, the Bering Sea and the Chukchi Sea, and the High Arctic along a transect of over 43° of latitude and 5000 km (Figure 2). Notably the year 2012 was a year of record low sea ice extent 144
permitting open water sampling of plankton in the High Arctic, to our knowledge for the first time. For each system 2 to 6 stations were sampled providing at least 2000 ciliate cells representing each assemblage. The parameters estimated for each of the 5 populations were species richness, number of trace species (found as a single 148
cell), number of mouth size-classes, proportion of size-classes with multiple occupants (containing more than one species), and the number of apparently redundant species. For each assemblage the pattern of species abundance distribution was compared with modeled abundance curves constructed using 152
parameters of the particular assemblage for three common models of community organization: geometric, log-normal and log-series. Substituting size-class of oral diameter for 'species', we also determined size-class abundance distributions. Methods
156
Sampling & Sample Analysis
Data and samples were collected from onboard the Korean Research Icebreaker Araon from July to September in 2012. Data presented here are from 22 stations distributed between the Japan Sea and 82 °N as shown in Figure 1. Exact locations 160
and the Korean Polar Research Station Designations are given the supplementary data file. A Niskin bottle rosette equipped with CTD probes was used to obtain temperature profile data and discrete depth samples for chlorophyll determinations. Plankton net tows were performed to assess microplankton community composition. 164
For chlorophyll a determinations, water samples of 0.3-1 l were obtained from 7-9 discrete depths between the surface and 100 m depth. Water samples were filtered through a 0.7 µm Whatman glass fiber filter (GF/F) and chlorophyll concentrations determined onboard using a Turner Designs Trilogy model 168
fluorometer calibrated using commercial chlorophyll a standards.
Net tows were made with a 20µm mesh plankton net of 0.45 m diameter towed from 100 m depth to the surface, except at some shallow stations sampled from 50 or 30 m depth. A portion of the net tow material was fixed with Lugol's (2% final
concentration) for direct microscopic examination. In the laboratory, multiple 1 - 2 ml aliquots of net tow material were diluted and examined in 3 ml settling chambers using an inverted microscope equipped with DIC optics. The entire surface of the settling chamber was examined at 200x total magnification. Tintinnid identifications 176
were made based on lorica morphology and following Kofoid & Campbell (1929, 1939) and Hada (1937). We adopted a conservative approach, distinguishing all forms corresponding to species currently recognized as valid. Species names, occurrences and LOD diameters assigned are given in the supplementary data file. 180
As previously described and justified (Dolan et al. 2006; 2007, 2009; 2013), species of similar ecology in terms of preferred prey size and maximum growth rate were grouped based on (LOD). Each species was assigned the average dimensions reported in Kofoid & Campbell (1929, 1939) and Hada (1937). Size-class diameters 184
were binned over 4 µm intervals beginning with the overall smallest diameter (11 µm) and continuing to the largest diameter encountered in a given sample.
Total sample volumes examined varied, depending on the concentrations of organisms, and the dilutions employed varied according to concentrations of 188
phytoplankton. However, multiple aliquots were examined until material from at least 100 liters filtered by the net was analyzed for each station. Nominal concentrations of organisms (given in the supplementary file) were calculated based on the volume filtered by the net (calculated from net surface area and depth of the strata sampled) 192
and the volume of net tow material examined. It should be noted that the
concentrations reported here are the average values per liter for the portion of the water column sampled, for most stations the top 100 m.
Data Analysis 196
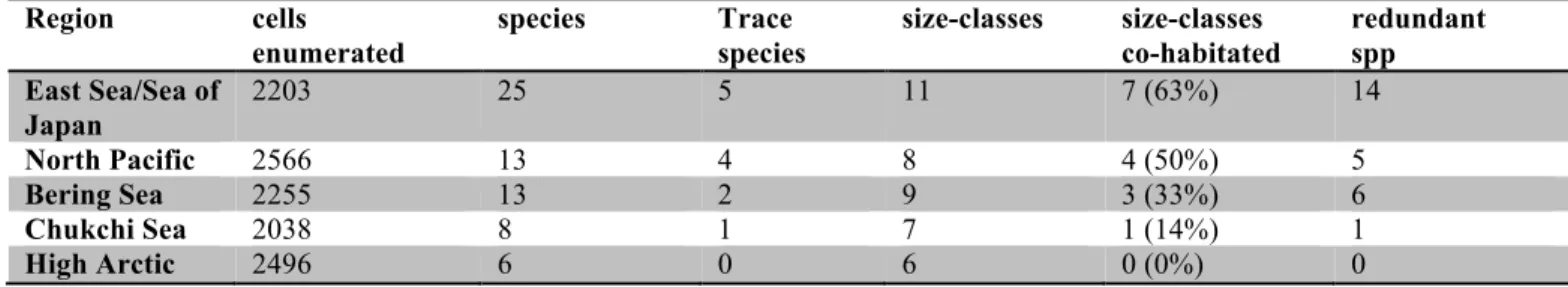
Tintinnid assemblages were characterized by pooling data by system: East Sea/Sea of Japan stations 1-2; North Pacific stations 3-8; Bering Sea stations 9-12, Chukchi Sea stations A-F, and the High Arctic Sea stations G-H. The parameters estimated for each of the 5 populations were species richness, number of trace 200
species (found as a single cell), number of mouth classes, proportion of size-classes containing more than one species (multiple occupants), and the number of apparently redundant species. We used simple linear correlation analysis to examine relationships across all stations between species richness and latitude, water
204
temperature, organismal concentrations and chlorophyll a concentrations.
For each assemblage we examined the patterns of both species abundance distribution and the abundance distributions of LOD size-classes. We first made log-rank abundance curves by calculating relative abundance for each species and 208
ranking species from highest to lowest and plotting ln(relative abundance) vs. rank. Then, we constructed hypothetical log-rank abundance curves that could fit the data by using parameters of the particular assemblage. We produced curves for three common models of community organization: geometric series, series, and log-212
normal, as in several previous studies (Claessens et al. 2010; Doherty et al. 2010; Dolan et al. 2007, 2009; 2013; Dolan & Stoeck 2011, Raybaud et al 2009).
The observed rank abundance distributions were compared to the hypothetical models using a Bayesian approach: an Akaike goodness of fit calculation (19). Using 216
this approach, an Akaike Information Criterion (AIC) was determined as the natural logarithm of the mean (sum divided by S) of squared deviations between observed and predicted ln(relative abundance) for all ranked S species plus an additional term to correct for the number of estimated parameters, k (1 for geometric series and 2 220
each for log-series and log-normal distributions): (S + k)/(S-k-2). The lower the calculated AIC value, the better the fit. A difference of 1 in AIC corresponds roughly to a 1.5 evidence ratio; we considered that a minimum difference of 1.0 between AIC values was required to represent a significantly different fit following Burnham & 224
Anderson (2002).
Results & Discussion
The expected latitudinal decline of species richness was evident. In the East Sea/Sea 228
of Japan species richness was much higher than in the higher latitude systems. The East Sea/Sea of Japan also had higher cell and chlorophyll a concentrations.
However, plotting individual station data showed the decline in species richness across the 5 systems to be more closely relatable to sea surface temperature rather 232
than latitude, and independent of the bulk characteristics of tintinnid cell or chlorophyll concentrations (Figure 3).
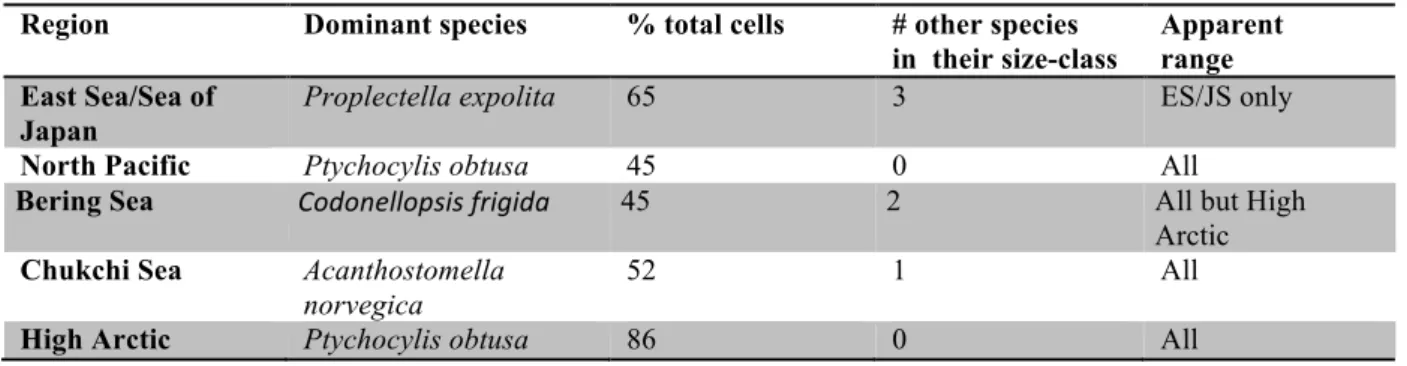
The dominant species in each assemblage (shown in Supplemental Figure 1) were small-mouthed species, Proplectella expolita, Condonellopsis frigida,
236
Acanthostomella norvegica except in the North Pacific where the relatively large-mouthed Ptychocylis obtusa dominated. In each assemblage, the dominant species accounted for 45-86% of the cells encountered (Table 2). Overall, of the 31 species found most (25) were not widely distributed but rather found in only in 1 or 2 of the 240
systems sampled. In contrast, 4 species were found in all 5 populations sampled. These widespread forms were 4 of the 6 species found in the High Arctic Sea. Thus, the few species found in the High Arctic are mostly the widely distributed forms (for
details distributions of each species distributions see the supplementary data file 244
“species data”).
Characteristics of the populations in the East Sea/Sea of Japan differed considerably from all of the high latitude assemblages (Table 1). Overall species richness was similar to that reported for stations from the California Current system in 248
the Eastern Pacific at about the same latitude (Dolan et al. 2013). The 25 species of the East Sea/Sea of Japan assemblage were distributed in 11 size-classes, most of which were occupied by more than 1 species. Thus, a large portion of the species pool was composed of ʻecological redundantsʼ, species occupying a size-class along 252
with 1 or more other species. The size class containing the largest number of species was that of the dominant species, Proplectella expolita, which was accompanied by three other species. The 5 rare or ʻtraceʼ species (those found as a single individual) were redundants with one exception. Thus only 1 rare form was distinct from all other 256
species in terms of mouth size.
Compared to the East Sea/Sea of Japan, the North Pacific assemblage was composed of fewer species and these were distributed in fewer size-classes (Table 1). Half the size-classes contained redundants as they were occupied by more than 1 260
species. The dominant species, the large-mouthed Pytchocylis obtusa, was alone in its size-class. None of the trace species formed a distinct size-class, all appeared to be redundants. The Bering Sea assemblage resembled that of the North Pacific in species richness. The assemblage formed 9 size classes with the dominant species, 264
Codonellopsis frigida, sharing a size-class with 2 redundant species. Two other redundant species shared the size class of the second most abundant species Parafavella parumdentata. The 2 trace species were alone in their size-class.
Low species richness characterised both Arctic assemblages (Table 1). In the 268
Chukchi Sea the 8 species found were distributed in 7 classes with only the size-class of the dominant species, Acanthostomella norvegica, containing a redundant species. The single trace species was alone in its size-class. The High Arctic population, dominated by Ptychocylis obtusa, was singular in having neither rare 272
species nor redundant species; all 6 species found were in distinct size-classes. The latitudinal decline in species richness we found from the East Sea/Sea of Japan to the High Arctic represented declines in numbers of redundant and trace species. Notably while there were many fewer species in the high latitudes, the total overall 276
size range of LODs found in the assemblages, 11 to 75 µm, was invariant across all the assemblages.
The data reported here are from a summer time sampling as is the case for most studies of high latitude plankton. In lower latitude coastal systems seasonal 280
changes in species richness of tintinnid assemblages are well documented and summer is usually a period of low diversity (reviewed in Dolan & Pierce 2013). Few data exist concerning seasonality in open water systems, especially in arctic and subarctic waters due to the technical difficulty of sampling in periods other than 284
summer. The gradient we found may be more prominent in other seasons, for example when the ice cover is maximal in the Chukchi Sea and High Arctic.
Also worth noting is that rather than harboring cryptic species, some species of the high latitude assemblages have long been suspected to be polymorphic, having 288
variable loricas, which perhaps have been designated wrongly as distinct species. Among these suspected polymorphs are Parafavella spp (Burkovsky 1973; Davis 1978) of which 5 are reported here (see supplemental data file). The phenomenon of
cryptic species in tintinnids (i.e., Santoferrara et al. 2015) may be less common 292
compared to polymorphism as there are species known to display different lorica morphologies, but of the same LOD, previously described as different species and/or genera (i.e., Bachy et al. 2012; Laval-Peuto, 1983; Kim et al. 2014). At present it is not clear which phenomenon is more common. Among tintinnids and foraminfera 296
cryptic species are generally segregated either temporally or spatially (e.g. de Vargas et al. 1999; Xu et al. 2012; Santoferrara et al. 2015) whereas in polymorphic species the different morphotypes occur together (e.g. Dolan et al. 2014; 2013; 2015).
The most likely candidates for crypticism are the widespread species, those 300
found from the East Sea/Sea of Japan to the high Arctic such as Ptychocylis obtusa and Acanthostomella norvegica. These species inhabit waters ranging in
temperature from 20° to -2° C. However whether or not, for example, an East
Sea/Sea of Japan population of a “species” is genetically distinct from that in the High 304
Arctic would not change species inventories or distributions for the geographically distinct assemblages. Given that cryptic forms of tintinnids appear to be segregated either temporally, i.e., seasonally (Xu et al 2015) or spatially i.e., distinct water masses (Santoferrara et al. 2015), they are unlikely to represent hidden diversity 308
within an assemblage. Hence, in comparing assemblages from different systems the true problematic phenomenon is polymorphism that may inflate apparent species richness of an assemblage. If the 5 Parafavella species distinguished here (all found in low numbers: 1-5 cells per assemblage, see supplemental data file) are revealed to 312
be a single species, the species richness of the assemblages of the East Sea/Sea of Japan, North Pacific and Bering Sea may be slightly lower then the numbers reported here.
Besides species richness, differences between the East Sea/Sea of Japan 316
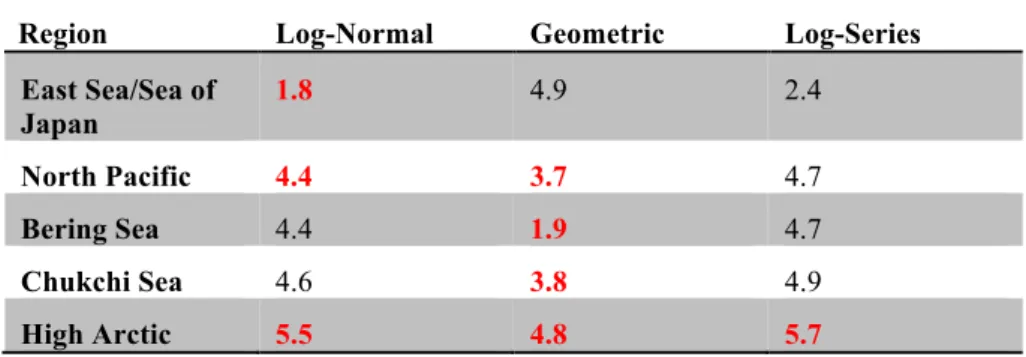
assemblage and higher latitude populations were also evident in the structures of the assemblages. The patterns of species abundance distributions as well the
abundance distributions of size-classes differed among the assemblages (Table 2 and Figure 4). Species abundance distributions of all the high latitude populations 320
were best fit by a geometric distribution in contrast to the log-series distribution of the East Sea/Sea ofJapan. Long-tailed log or log-series distributions, with large numbers of relatively rare species, are commonly observed for most natural assemblages (McGill et al. 2007). Long-tailed distributions are typical of abundance curves of 324
planktonic protists determined using molecular techniques (e.g., Bachy et al. 2013; Brown et al. 2009; Edgcomb et al. 2011; Orsi et al. 2012). Notably, the pattern can be partially the result of problems arising from sequencing errors and differential sequencing of different taxa, issues which require attention (e.g. de Vargas et al. 328
2015).
The species abundance distribution of the East Sea/Sea of Japan assemblage was best fit by a log model. Log distributions, either log-normal or log-series are associated with a multitude of factors governing relative species abundance in the 332
case of the log-normal, or immigration and extinction from a metapopulation in the case of log-series (i.e, Hubbell 2001). Substituting size-classes for species, similar differences were evident as the log-normal distribution of the East Sea/Sea of Japan population contrasted with the mostly geometric distributions of the high latitude 336
assemblages (Table 3). A geometric distribution represents the result of a priority exploitation of resources by individual species in a community and is classically associated with 'immature' or pioneer communities limited by a single resource such
as space (e.g., Whittaker 1972). This distribution is also thought to characterize 340
assemblages of low species richness or severe environments (Wilson 1991). In Antarctic waters, a geometric species abundance distribution was found to describe the species abundance distribution of the entire planktonic ciliate community
(Wickham et al. 2011). In tintinnid assemblages, the geometric distribution of LOD 344
size-class abundance is most simply attributable to availability of prey concentration and size given the close relationship between LOD size and prey exploited by tintinnids (Dolan 2010).
The species found in trace concentrations, just 1 individual in 100 liters, can be 348
considered ʻrareʼ. The phenomenon of rare species has received a good deal of attention (e.g. Gaston 1994). Rare species have become a focus in biodiversity conservation (e.g. Lyons et al. 2005). In microbial ecology, the results from high-throughput sequencing commonly suggest the existence of very large numbers of 352
apparently rare species, present in low concentrations (e.g., Dunthorn et al 2014). Rare species, although low in abundance, may have important roles if they possess key functional traits different from abundant species (Mouillot et al. 2013). In the protistan “rare biosphere”, rare species may be of importance because they can 356
become abundant if conditions change favoring different species with certain characteristics (Caron & Countway 2009). Admittedly, rare species can also be of minor ecological importance, as in members of the "accidental rare biosphere" (Weisse 2014). Regardless of the nature of the rare tintinnid species we found, their 360
numbers decreased markedly with latitude (Figure 5).
Using our non-exclusive categories, a species found as a single cell is defined as rare but if it is in the same LOD size class as another species, it is also a
redundant. However, the majority of redundant species were not rare but relatively 364
abundant, as they were found in far greater than trace concentrations. Redundants were most numerous in the size classes of the dominant species and can likely replace a dominant species, for example, one subjected to a high rate of specific mortality from a parasite or predator (i.e., Coats & Bachvaroff 2012). A species can 368
change roles from a minor to a major role. In temperate and sub-tropical assemblages of tintinnids, a species can be dominant in one population and a
redundant in another (Dolan et al. 2013). In the Bering Sea Codonellopsis frigida was the dominant form while in Chukchi Sea is a redundant species. It has been argued 372
that the existence of redundant species should increase the capability of an
assemblage to exploit changes in conditions (Naeem 1998). Like rare species, we found redundant species declined in relative importance with latitude (Figure 5). 376
Conclusion
We found the latitudinal decline in species richness of tintinnid ciliates corresponded to fewer rare species, fewer presumed redundant species, and fewer size-classes but without a reduction in the total range of size-classes present. Overall, declines were 380
in the numbers of species accompanying the dominant forms with dominant forms remaining more or less the same set of species. The declines were then in presumed redundant species and numbers of rare species. Both categories declined with
latitude to zero values in the High Arctic assemblage (Table 1 and Figure 5). The 384
decline in species richness with latitude in the Northern hemisphere represents declines in the variety of forms in an assemblage and species redundancy. Consequently there appears to be a latitudinal gradient in the capability of
assemblages to adapt to environmental changes in at least with regard to size-388
spectra of available prey items or the loss of a particular dominant species. The latitudinal diversity gradient in another group of planktonic protists, foraminifera, appears closely related to temperature over a wide variety of time scales (Yasuhara et al. 2012), suggesting temperature plays a preponderant role in determining 392
species richness. If changes in species distributions occur with distributions shifted northward, Arctic assemblages may become slightly more species rich and increases in species richness would likely increase the numbers of redundant species.
Theoretically, as redundancy among species increases ecosystem stability (Naeem 396
1998), global climate change may increase the stability of high latitude ecosystems. However, the relatively small species pools of the northern high latitude assemblages suggest a low capacity to adapt to changing conditions.
400
Supplementary information is available at The ISME Journal's website.
ACKNOWLEDGEMENTS
The comments and suggestions of Dave Montagnes, 3 reviewers and the editor on 404
previous versions led to significant improvement in the manuscript.
References
Adams J. (2009) The Holy Grail of ecology: latitudinal gradients. pp 47-95 in 'Species 408
Agatha S., Strüder-Kypke M.C. (2012). Reconciling cladistic and genetic analyses in choreotrichid ciliates (Protists, Spirotrichea, Oligotrichea). J Eukaryot Microbiol 59:325-350.
412
Agatha S., Laval-Peuto M., Simon P. 2013. The tintinnid lorica. In Dolan JR, Montagnes D.J.S., Agatha S., Coats D.W., Stoecker D.K. (eds) The Biology and Ecology of Tintinnid Ciliates: Models for Marine Plankton. Wiley-Blackwell: Oxford, pp 17–41.
416
Bachy C., Dolan J.R., López-García P., Deschamps P., Moreira D. (2013) Accuracy of protist diversity assessments: morphology compared to cloning and direct
pyrosequencing of 18S rRNA genes and ITS regions using the conspicuous tintinnid ciliates as a case study. ISME J 7: 244-255.
420
Brown M.V., Philip G.K., Bunge J.A., Smith M.C., Bissett A., Lauro F.M. et al. (2009). Microbial community structure in the North Pacific Ocean. ISME J 3:1374-1386. Burkovskii I.V. (1973). Variability of Parafavella denticulata in the White Sea. Zoologicheskii Zh, 52:1277-1285.
424
Burnham K.P., Anderson, D.R. (2002) Model selection and multi-model inference: a practical information-theoretic approach. Springer: New York:Springer.
Caron D.A., Countway P.D. (2009). Hypotheses on the role of the protistan rare biosphere in a changing world. Aquat Microb Ecol 57:227-238.
428
Claessens M., Wicjkham S.A., Post A.F., Reuter M. (2010). A paradox of the ciliates? High ciliate diversity in a resource-poor environment. Mar Biol 157:483-494.
Coats, D.W., Bachvaroff, T.R. (2012) Parasites of tintinnids. In Dolan, J.R., Montagnes DJ.S., Agatha S., Stoecker D.K. (eds) The Biology and Ecology of 432
Tintinnid Ciliates: Models for Marine Plankton. Wiley-Blackwell: Oxford, pp 146-170. Davis C.C. (1978). Variations of the lorica in the genus Parafavella (Protozoa: Tintinnida) in northern Norway waters. Can J Zool, 56:1822-1827.
De Vargas C., Norris R., Zaninetti L., Gibb, S.W., Pawlowski J. (1999) Molecular 436
evidence of cryptic speciation in planktonic foraminifers and their relation to oceanic provinces. Proc Natl Acad. Sc. (USA) 96:2864-2868.
De Vargas C., Audic S., Henry N., Decelle J., Mahé F., Logares R. et al. (2015) Eukaryotic plankton diversity in the sunlit ocean. Science 348 | doi:
440
10.1126/science.1261605.
Doherty M., Tamura M., Costas B.A., Ritchie M.E., McManus G.B., Katz L. A. (2010). Ciliate diversity and distribution across an environmental and depth gradient in Long Island Sound, USA. Environ Microbiol 12:886-898.
444
Dolan J.R. (2010). Morphology and ecology in tintinnid ciliates of the marine plankton: correlates of lorica dimensions. Acta Protoz 49:235-244.
Dolan J.R. (2011). The legacy of the last cruise of the Carnegie: a lesson in the value of dusty old taxonomic monographs. J Plank Res 33:1317-1324.
448
Dolan J.R. (2015). Planktonic protists: little bugs pose big problems for biodiversity assessments. J Plank Res 2015; e-pub ahead of print 14 September, doi:
Dolan J.R., Pierce R.W. (2013). Diversity and distributions of tintinnids. In Dolan J.R., 452
Montagnes DJ.S., Agatha S., Stoecker D.K. (eds) The Biology and Ecology of Tintinnid Ciliates: Models for Marine Plankton. Wiley-Blackwell: Oxford, pp 214-243. Dolan, J.R, Stoeck T. (2011) Repeated sampling reveals differential variability in measures of species richness and community composition in planktonic protists. 456
Environ Microbiol Rep. 3:661-666
Dolan J.R., Jacquet S., Torreton J.-P. (2006) Comparing taxonomic and
morphological biodiversity of tintinnids (planktonic ciliates) of New Caledonia. Limnol Oceanogr 51:950-958.
460
Dolan J.R., Ritchie M.R., Ras J. (2007) The neutral community structure of planktonic herbivores, tintinnid ciliates of the microzooplankton, across the SE Pacific Ocean. Biogeosciences 4:297-310.
Dolan J.R., Ritchie M.E., Tunin-Ley A., Pizay M.-D. (2009). Dynamics of core and 464
occasional species in the marine plankton: tintinnid ciliates of the N.W. Mediterranean Sea. J Biogeogr 36:887-895.
Dolan J.R., Landry M.R., Ritchie M.E. (2013) The species-rich assemblages of tintinnids (marine planktonic protists) are structured by mouth size. ISME J 7:1237-468
1243.
Dolan J.R., Yang E.J., Lee S. H., Kim S.Y. 2013. Tintinnid ciliates of the Amundsen Sea (Antarctica) Plankton Communities. Pol Res 32: 19784.
Dolan J.R., Pierce R.W., Bachy C. 2014. Cyttarocylis ampulla, a polymorphic ciliate 472
Dunthorn M., Stoeck T., Clamp J., Warren A., Mahé, F. 2014. Ciliates and the rare biosphere: a review. J Eukaryot Microbiol 61:404-409.
Edgcomb V., Orsi W., Bunge J., Jeon S., Christen R., Leslin C. et al. (2011). 476
Protistan microbial observatory in the Cariaco Basin, Caribbean. 1. Pyrosequencing vs Sanger insights into species richness. ISME J 5:1344-1356.
Gaston, K.J. & Spicer, J.I. (2003) Biodiversity: an introduction, 2nd edn. Blackwell Publishing: Oxford.
480
Gaston K.J. (1994) Rarity. Chapman & Hall: London.
Hubbell S.R. (2001). The unified neutral theory of biodiversity and biogeography. Princeton, USA, Princeton: Princeton University Press.
Hutchinson G.E. (1961) The paradox of the plankton. Amer Nat 95:137-145. 484
Hada Y. (1937) The fauna of Akkeshi Bay IV. The pelagic ciliata. J Fac. Sci. Hokkaido Imperial Univ, Series 6, Zool, 5: 147-216.
Kim S.Y., Choi J.K., Dolan J.R., Shin H.C., Lee S., Yang E.J. (2013) Morphological and ribosomal DNA-based characterization of six Antarctic ciliate 5 morphopecies 488
from the Amundsen Sea with phylogenetic analyses. J Eukaryot Microbiol 60: 497-513.
Laval-Peuto M. (1983). Sexual reproduction in Favella ehrenbergii (Ciliophora, Tintinnina). Taxonomical implications. Protistologica 29:503-512.
492
Laval-Peuto M., Brownlee D.C. (1986) Identification and systematics of the Tintinnina (Ciliophora): evaluation and suggestion for improvement. Ann Inst Océanogr Paris 62:69-84.
Lima-Mendez G., Faust K., Henry N., Decelle J., Colin S., Carcillo F. et al. (2015) 496
Determinants of community structure in the global plankton interactome. Science 348 | doi: 10.1126/science.1262073.
Lyons K.G., Brigham C.A., Traut B.H., Schwartz M.W. (2005) Rare species and ecosystem functioning. Conserv Biol 19: 1019-1024.
500
McGill B.J., Etienne R.S., Gray J.S., Alonso D., Anderson M.J., Benecha H.K et al. (2007) Species abundance distributions: moving beyond single prediction theories to integration within an ecological framework. Ecol Lett 10:995-1015.
Montagnes D.J.S. (2012) Ecophysiology and behavior of tintinnids. In Dolan J.R., 504
Montagnes DJ.S., Agatha S., Stoecker D.K. (eds) The Biology and Ecology of Tintinnid Ciliates: Models for Marine Plankton. Wiley-Blackwell: Oxford, pp 85-121. Moulllot D., Bellwood D.R., Baraloto C., Chave J., Galzin R., Harmelin-Vivien M., Kulbicki M., Lavergne S., Lavorei S., Mouquet N., Paine C.E.T., Renaud J., Thuiller 508
W. (2013) Rare species support vulnerable functions in high diversity ecosystems. PLoS Biol 11: e1001569. doi:10.1371/journal.pbio.1001569
Naeem S. (1998) Species redundancy and ecosystem reliability. Conserv Biol 12:39-45.
512
Orsi W., Song Y.C., Hallam S., Edgcomb V. (2012) Effect of oxygen minimum zone formation on communities of marine protist. ISME J 6:1586-1601.
Rombouts I., Beaugrand G., Ibanez F., Gasparini S., Chiba S., Legendre L. (2009) Global latitudinal variations in marine copepod diversity and environmental factors. 516
Rutherford S., D'Hondt S., Prell W. (1999) Environmental controls on the geographic distribution of zooplankton diversity. Nature 400:749-752.
Raybaud V., Tunin-Ley A., Ritchie M. E., Dolan J.R. (2009) Similar patterns of 520
community organization characterize distinct groups of different trophic levels in the plankton of the NW Mediterranean Sea. Biogeosciences 6:431-438.
Santoferrara L.F., Tian M., Alder V.A., McManus G.B. (2015) Discrimination of closely related species in tintinnid ciliates: New insights on crypticity and polymorphism in the 524
Genus Helicostomella. Protist 16:78-92.
Weisse T. (2014) Ciliates and the rare biospher- community ecology and population dynamics. J Eukaryot Microbiol 61: 419-433.
Whittaker R.H. (1972) Evolution and measurement of species diversity. Taxon 528
21:213-251.
Wickham S.A., Steinmair U., Kamennaya N. (2011) Ciliate distributions and forcing factors in the Amundsen and Bellinghausen Seas (Antarctic). Aquat Microb Ecol 62:215-230.
532
Willig M.R. (2003) Latitudinal gradients of biodiversity: patterns, process, scale and synthesis. Annu Rev Ecol Syst 34:273-309.
Wilson J.B. (1991) Methods for fitting dominance/diversity curves. J Veg Sci 2:35-46. Xu D., Sun, P., Shin, M.K., Kim Y.O. (2012) Species boundaries in tintinnid ciliates: A 536
case study - Morphometric variabilty, molecular characterisation, and temporal distribution of Helicostomella species (Cciliophora, Tintinnina). J Eukaryot Microbiol 59:351-358.
Yasuhara M., Hunt G., Dowsett H.J., Robinson M.M., Stoll D.K. (2012) Latitudinal 540
species diversity gradient of marine zooplankton for the last three million years. Ecol Lett 10.1111/j.1461-0248.2012.01828.x
Figure legends 544
Figure 1. Salpingella acuminata. Image of a specimen from station 10 in the Bering Sea showing the basic features of a tintinnid ciliate.
Figure 2. Locations sampled between late July and early September in 2012 ranging 548
from the East Sea/Sea of Japan (1 & 2), across the North Pacific (3-8), the Bering Sea (9-12), the Chukchi Sea (A-F) and the High Arctic (G & H). The summer of 2012 was the year of record low sea ice extent allowing sampling in the High Arctic Sea. See supplementary data file for exact station locations and summary station data. 552
Figure 3. Relationship of species richness of the tintinnid assemblages to: latitude, sea surface temperature (top 10 m), average chlorophyll concentration (top 100 m), and the abundance of tintinnids. There were significant (p < 0.01) negative linear 556
relationships between species richness and latitude (r = 0.6, n = 21) and sea surface temperature (r = 0.81, n = 20). ES/SJ indicates East Sea/Sea of Japan. See
supplementary data file for the data. 560
Figure 4. Observed abundance distributions of tintinnid assemblages: species
abundance distributions (spp) and size-class abundance (S-C) for pooled populations of each of the 5 systems sampled. ES/SJ indicates East Sea/Sea of Japan. See Table 3 for the results of modeling the abundance distribution shown.
564
Figure 5. The relationships between the average latitude sampled for each of the 5 assemblages and the portion of redundant species found (squares) and the number
trace species encountered (circles). Significant (p < 0.01) negative linear 568
relationships with latitude are evident for both the % of species pool as redundants (n = 5, r = 0.984) and the number of trace species (n = 5, r = 0.987).
Table One. Summary of data by region. Trace species are species found as a single individual. Number of size-classes containing more than one species given as size-classes co-habitated. Number of redundant species is the number of species in excess of the number of size-classes. Region cells enumerated species Trace species size-classes size-classes co-habitated redundant spp East Sea/Sea of Japan 2203 25 5 11 7 (63%) 14 North Pacific 2566 13 4 8 4 (50%) 5 Bering Sea 2255 13 2 9 3 (33%) 6 Chukchi Sea 2038 8 1 7 1 (14%) 1 High Arctic 2496 6 0 6 0 (0%) 0
Table Two. Identity of the Dominant species in the assemblages. Note that dominants accounted for a large portion of the population in all 5 systems and most had a wide apparent range.
Region Dominant species % total cells # other species in their size-class
Apparent range East Sea/Sea of
Japan
Proplectella expolita 65 3 ES/JS only
North Pacific Ptychocylis obtusa 45 0 All
Bering Sea Codonellopsis frigida 45 2 All but High Arctic
Chukchi Sea Acanthostomella norvegica
52 1 All
Table Three. Results of modeling abundance distribution patterns. Lowest AIC values (in red) indicate the best model fit. Multiple values in red indicate indistinguishable fits (differences <1).
Species Abundance Distribution fits
Size-Class Abundance Distribution fits
Region Log-Normal Geometric Log-Series East Sea/Sea of Japan 3.2 5.8 2.7 North Pacific 3.8 1.9 3.9 Bering Sea 3.3 -0.0 3.4 Chukchi Sea 4.0 2.6 4.3 High Arctic 5.5 4.8 5.7
Region Log-Normal Geometric Log-Series East Sea/Sea of Japan 1.8 4.9 2.4 North Pacific 4.4 3.7 4.7 Bering Sea 4.4 1.9 4.7 Chukchi Sea 4.6 3.8 4.9 High Arctic 5.5 4.8 5.7