HAL Id: hal-01216237
https://hal.archives-ouvertes.fr/hal-01216237
Submitted on 17 Jun 2021HAL is a multi-disciplinary open access archive for the deposit and dissemination of sci-entific research documents, whether they are pub-lished or not. The documents may come from teaching and research institutions in France or abroad, or from public or private research centers.
L’archive ouverte pluridisciplinaire HAL, est destinée au dépôt et à la diffusion de documents scientifiques de niveau recherche, publiés ou non, émanant des établissements d’enseignement et de recherche français ou étrangers, des laboratoires publics ou privés.
viscosity using HP/HT capillary devices
Bruno Pinho, Stéphane Girardon, Frédéric Bazer-Bachi, Ghislain Bergeot,
Samuel Marre, Cyril Aymonier
To cite this version:
Bruno Pinho, Stéphane Girardon, Frédéric Bazer-Bachi, Ghislain Bergeot, Samuel Marre, et al.. Si-multaneous measurement of fluids density and viscosity using HP/HT capillary devices. Journal of Supercritical Fluids, Elsevier, 2015, 105, pp.186-192. �10.1016/j.supflu.2015.04.016�. �hal-01216237�
Simultaneous measurement of fluids density and viscosity
using HP/HT capillary devices
Bruno Pinhoab, Stéphane Girardona, Frédéric Bazer‐Bachia, Ghislain Bergeota, Samuel Marreb, Cyril Aymonierb a IFPEN, Rond‐Point de l’Echangeur de Solaize, 69390 Solaize, France b CNRS, Univ. Bordeaux, ICMCB, UPR9048, F‐33600 Pessac, France Abstract : Accessing fluids thermophysical properties is crucial in chemical engineering for they are required in most of process parameter calculations. Nevertheless, these are not always available in the literature. In the present paper, we propose a fast and efficient microfluidic approach for simultaneously accessing density and viscosity of homogeneous fluids mixtures. In comparison with classical set‐ups, microfluidic devices exhibit higher heat transfer capability and small volumes, resulting in an easy control of temperature, fast conditions screening and improved operation safety. A set‐up was designed based on the subtraction of two pressures: capillary and bypass lines. The devices use a capillary system with a diameter of 73.6 μm (±0.5%). The proposed set‐up can work in a wide range of pressures (10 < P(bar) < 200) and temperatures (30 < T(°C) < 227). The developed strategy was applied to pure fluids (CO2 and N2), and to mixtures (CYC + CO2 and CO2 + H2).
Keywords : Viscosity / Density / Microfluidics / Capillary / Pressure drop
1. Introduction
Supercritical fluids (SCFs) have been used as an alternative to traditional solvents in several fields of research, such as supercritical water oxidation [1], nanotechnology [2] and catalysis [3], [4], [5], [6]. In the supercritical technologies, multicomponent flows are mostly homogeneous (above the Maxcondenbar point), regardless of their complexity [7], [8], therefore suppressing the mass transfer limitations at phases interfaces. Nevertheless, implementing supercritical fluids in a process is not straightforward, since their properties vary significantly with the pressure and temperature conditions [9], while the published data for fluid mixture properties are still scarce. The most basic fluids thermophysical properties required to develop a process are the fluid density and viscosity (in particular to evaluate residence time, mixing time and pressure drop). Although they can be estimated for several fluid mixtures with satisfactory precision [9], [10], [11], [12], there is still a huge diversity of mixtures and conditions with unknown or unverified data. For these reasons, experiments are often necessary to measure those physical properties.
To determine the density of a fluid mixture, a special attention has been put in the development of isochoric methods [13], [14]. In these methods, the density is measured by the injection of a known quantity of fluid in a high-pressure volume-calibrated cell. The density can also be measured by other techniques as the Coriolis flowmeter or the flow-rate through a restriction (which requires the previous knowledge of the fluid viscosity). In the Coriolis flow meter, the density is obtained as a function of the resonance frequency of a U-tube. Zhang et al. reduced its size to microscale, in order to increase its capability to determine densities. The small size-scale (microfluidic scale) takes advantage of better temperature and pressure control [15], [16], [17], [18], [19], [20].
The flow-rate through a restriction uses the pressure drop of a fluid through a calibrated structure to measure the fluid density.
There are commonly two methods to determine viscosities: (i) to force a body through a fluid and to measure the viscous drag [21] or (ii) to flow a fluid through a restriction and to measure the resulting force-flow diagram [22]. Both methods can give satisfactory results [22], but only the restriction method is suitable at high pressure as an absolute viscosimeter. It was reported by Ross et al. that a body falling through a fluid can create turbulence around it, which can give inaccurate values of viscosity. In the restriction method, the viscosity can be estimated by the application of an equation for non-ideal capillary tubes [23], [24]. This equation includes the Poiseuille's law with the kinetic energy and the correction factors from Hagenbach–Couette. Based on this equation, Yusibani et al., 2011 conducted viscosity measurements of H2 and N2 at high pressures and temperatures, from 10 to
200 bar and 30 to 227 °C. The authors obtained a deviation of ±2% in relation to literature data and correlation. Other methods to determine viscosity [22], [23], [25] require the prior knowledge of the density, which is not always available for multicomponent systems. Therefore, it is necessary to have another device to measure density. In the literature, some reports present devices that can measure both fluid properties simultaneously [26],
[27]. For instance, Gourgouillon et al. developed a vibrating wire instrument to make viscosity and density measurements of SCF-saturated polymers. Similar to this technology, density and viscosity can be measured by resonance with nickel microcantilevers [28], [29].
The limitations of these approaches are the heat transfer limitations, equipment costs and inability to use in situ techniques during reaction.
To overcome these limitations, this study proposes a HP/HT microfluidics-based methodology to determine simultaneously viscosity and density for homogeneous multicomponent mixtures. The main advantages of this method are the ability to combine fast measurements with low consumption of fluid and in situ characterization techniques [30], [31]. For instance, it is now possible with this HP/HT microfluidic tool to measure the evolution of the thermo physical properties of a reactive mixture, while following the chemical reaction with in situ spectroscopy techniques [32]. In addition, HP/HT microfluidic tools allow to investigate miscibility diagrams and critical coordinates in complex mixtures [20]. This experimental set-up is based on pressure drop measurements through microfluidic devices (capillaries or on chip set-up). For the validation of our HP/HT microfluidic approach, both viscosity and density data were determined at the same time for pure CO2 and N2
and for CO2 + H2 and CO2 + cyclohexane mixtures. The obtained results were compared to the NIST database [33] and Aspen® calculated values.
2. Description of the capillary densimeter/viscosimeter
This section summarizes the materials, the experimental apparatus, the working strategy and the uncertainties of the described method.
2.1. Materials
All the fluids were obtained commercially and no further purification was made. Cyclohexane (99.5% purity) was purchased from Sigma-Aldrich®. N45 Carbon dioxide, N45 hydrogen, N45 nitrogen and N45 helium were
purchased from AirLiquid®.
2.2. Apparatus
The experimental set-up can work from 10 to 200 bar and from 25 to 250 °C. The flowrates are driven by two high-pressure pumps (ISCO® 100DM) working in constant flow mode, which were thermostated by the
circulation of a 10 ± 0.05 °C glycol/water mixture controlled by the same thermal bath. Each pumps flowrate (up to 400 μL min−1) was calibrated and quantified at the outlet of the system for long periods, using ethanol at 10 °C.
CO2 was used to calibrate each pump pressure transducer. The pump inlet and outlet valves were closed, the
pressure constant mode was activated and the was compared with for known pressures (NIST). To evaluate the pressure drop in a capillary, calibrated gauge pressure transducers (Barksdale® with noise of
0.25% and an average value deviation of 0.025%) were placed upstream and downstream the capillary, respectively. This configuration is almost equivalent to a differential pressure transducer [23]. This option was preferred to a differential pressure transducer, mainly because it is possible to check individually pressure leaks in upstream (P1) and downstream lines (P2). Both pressure transducers were maintained at 25 °C using a fluid
circulation to minimize temperature variations, since piezoelectric materials are temperature sensitive. Moreover, it allows an easier supervision of possible plugging/fouling in the tubing system and checking the P2 status in
relation to the set point, which is controlled by a back pressure regulator (BPR, Equilibar® ULF). In microfluidics,
monitoring the downstream pressure behavior is essential, since a small perturbation in the pressure causes disruptions of the total flow-rate.
To evaluate the pressure drop through the capillaries, the pressure offset was estimated by a bypass-line (detailed in a later section). A scheme of the set-up is shown in Fig. 1. The feasibility of using a bypass line, while keeping the mixture molar composition constant, was verified in a previous work using a similar apparatus. In that work, we proposed the detection of the critical point for binary and ternary mixtures in a microfluidic device with the use of a bypass. The critical point can be used to check the fluid composition, because a small variation in the composition can lead to different critical pressure and temperature (for more information see [18]).
To avoid system leaks, the set-up was submitted to 3 + 3 h leak tests, first with N2 then with He at 200 bar. These
tests were considered valid if the pressures transducers monitored a variation of less than 0.1 bar. To assure the set-up is leak-free, a daily leak test was done during 1 h with He before starting the experiments.
The fused circular cross-section silica capillary tube was bought from Polymicro technologies® with an inner
diameter of 73.6 μm (±0.5%) and outer diameter of 360 μm (±0.4%). To demonstrate the reproducibility of the experiments, two capillaries were cut to 20 and 40 cm ± 0.1% in length, respectively. These measurements were carried out to confirm the existence of a fully developed velocity profile required to apply the previous equations. Additionally, the cross-sections were carefully examined with a microscope to have a square-cut end, appropriate for the Hagenbach factor (m) [23].
A Swagelok® three-way valve was implemented in order to switch flows between capillaries (20 cm/40 cm) and
an on/off valve was used to switch between capillaries and the bypass-line. Each capillary was mounted on a PEEK® tube (inner and outer diameter of 370 μm and 1/16″, respectively) with a high-pressure Swagelok® fitting.
The stainless steel tubes, located upstream and downstream the capillaries, have an inner diameter of 750 μm. Their associated pressure drop is negligible compared to the one of the capillary (9 × 10⁵ times smaller).
To achieve thermal equilibrium and good mixing, the fluid was driven through a 1 m long stainless steel tube immersed in a thermal bath before reaching the capillary/bypass section. After the thermal bath, there is a cooling module of 0.5 m surrounded by a fluid at 25 °C. This guarantees equal temperature conditions at the inlet pressure and outlet pressure, reducing noise and pressure variation with temperature.
To access accurate values of temperature, three calibrated K-type thermocouples were placed in the set-up: in the cooling fluid of the syringe pumps (T1), in the thermal bath (T2) and before the P2 transducer (T3). These three
variables were time averaged to have a representative temperature. Each average temperature was later used to determine the fluid properties. All the signals were collected every second by a multi-channel acquisition device (NI cDAQ-9188) and analyzed using Matlab® v8.0.
3. Method
In this work, we use a capillary-calibrated system to measure pressure drop and indirectly evaluate density and viscosity since the system can sustain high pressure and is relatively easy to use and to build. Furthermore, all the complex phenomena of multi-phase flows through a restriction are eradicated. In the majority of the cases, this restriction is a capillary (hydrodynamic diameter ± 70 μm). The pressure drop can be represented by Hagen–Poiseuille equation. Assuming isothermal and constant compressibility factor, the pressure drop in an ideal capillary can be written as [34]:
where μ is the fluid dynamic viscosity, A is the capillary cross-section area, P is the absolute pressure, l is the total length, W is the mass flowrate, ρ is the density, M is the molecular weight, Z is the compressibility factor in the capillary, R is the ideal gas constant and T is the temperature. All the previous physical properties variables are related with the fluid in the capillary. Ip is the polar moment of inertia [35], which is calculated by Ipcf = ∫A(x2 + y2)dA and I*p is the polar moment of inertia for a cross section area A.
Eq. (1) is a generic equation that can be applied to arbitrary cross-sections by the change of the Ip, according to
Akbari et al.
For an elliptical channel, Ip is known as:
where b and c are the major and minor semi-axes of the cross-section.
Eq. (1) assumes that the pressure drop inside the capillary is not sufficient to change the fluid thermophysical properties. However, it is only suitable for capillaries where the viscous effects prevail, i.e. ideal capillaries. For real capillaries, it is necessary to quantify other contributions as: kinematic energy, formation of the parabolic velocity profile and increase wall friction at the beginning of the capillary (le). To quantify these contributions
Hagenbach–Couette proposed the following expression:
where m is the Hagenbach factor (kinetic energy correction), n is the Couette factor (inlet/outlet effects correction) and r is the average effective radius of the capillary.
Rearranging the previous equation, the term β and α appears.
In this expression (Y = βX + α), β is the linear regression slope and it depends on Z (which is inversely proportional to ρ) and m. α is the y-intercept and it depends on μ, Z and n. Eq. (4) has four degrees of freedom, which means that n, m, Z and μ have unknown values.
For cylindrical capillaries with Reynolds numbers between 100 and 2000, m is equal to 1.12 [36]. The n factor can be neglected if l/(2r) is >2000 [23], [36]. In our case, taking the same Reynolds range and l/(2r) superior at 2000, the n and m values will not vary with the type of fluid used and can be considered as constants. To eliminate the m and n values, a calibration has been done with a reference fluid. The final expression will be
Both equations only need a reference fluid evaluated at one temperature and pressure. Therefore, no further evaluations are necessary. Then ρi and μi can be obtained as:
3.1. Uncertainties estimation
The overall uncertainty of the set-up is a set of individual uncertainties plus the association of system disturbances. Thus, for each individual measurement, the contribution of the disturbances is determined by σ2.
The uncertainties of each measured variable are presented in Table 1.
In a “F” function (i.e. the uncertainties function), the variable uncertainties (δγi) are combined by a
This equation can be used as long as:
1. All the uncertainties are independent of each other;
2. Repeated observations of each measurement display Gaussian distribution [37]. The uncertainties of ρi and μi can be expressed as:
≈8.39 × 10⁻⁷ Pa s for 4 × 10⁻⁵ Pa s (i.e. ≈2%).
In most of the measurements, the density and viscosity deviations are of 6% and 2%, respectively. The global uncertainty is mainly related to the pressure transducers measurements, because of their uncertainties and the strong dependency of β and α to the pressure. Therefore, it is likely that higher precision pressure transducers should reach improved results. For the methodology validation it can be considered that if density and viscosity values are within the calculated uncertainty, the previous expressions are valid (Eqs. (4), (5), (6)).
For more detailed information about the uncertainties, see Supplementary information.
3.2. Strategy to use the capillary apparatus
The pressure drop was obtained by using a single pressure transducer (P1). This concept was introduced by
Yusibani et al. in which the pressure drop was determined by subtracting the measured pressure when the bypass valve is closed from the measured pressure when it is opened (Eq. (15)).
In the present set-up, the pressure drop of each capillary is determined by subtracting the value obtained when the bypass valve is closed (pressure drop of a capillary and its upstream/downstream associated lines [index for formula: cap. ↑↓]) and when the bypass valve is opened (pressure drop through the bypass line and its upstream/downstream associated lines [index for formula: bypass ↑↓]). The pressure drop in P1 can be deduced
by the following expressions:
and that the stainless tubings have equivalent hydraulic diameter, the pressure drop of the capillary upstream/downstream lines can be expressed as:
Replacing Eq. (14) in Eq. (12) reaches:
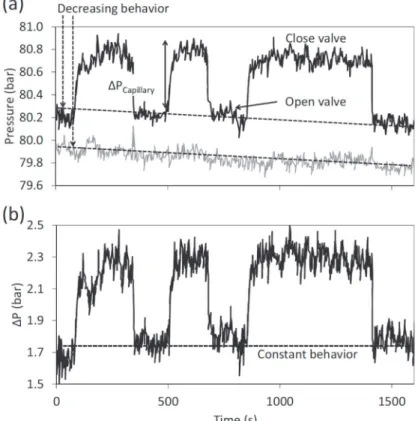
The use of a second pressure transducer (P2) allows the suppression of the pressure random behavior we can
observe on Fig. 2. Usually, it happens when there is an increase and/or a decrease of pressure with time caused by an unexpected behavior. Therefore, the corrected pressure drop through the capillary can be expressed as:
This correction can be applied because the system perturbations spread from one pressure transducer to another.
Fig. 2 shows the results before and after correction for the tests ran with CO2.
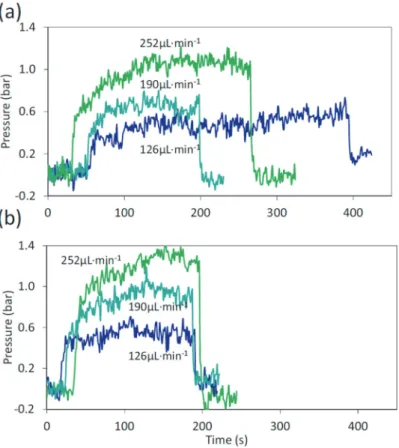
The correction factors (m and n, presented in Eqs. (5), (6)) being only dependent on the set-up itself, they can be obtained using a fluid with known thermophysical properties. In the present article, CO2 was chosen as a reference
properties. It was used in subcritical conditions (30 °C and 80 bar—near the critical point). Fig. 3a and b shows the experimental data obtained for ΔP vs time for different flowrates.
We use small to medium flowrates in order to limit the pressure drop values below 2 bar for reducing variations of the fluid thermophysical properties inside the capillary. Considering the worst scenario, a pressure variation of 2 bar results in a change of density and viscosity of 1.5% and 2.5%, respectively (for CO2 at 30 °C and 80 bar).
Thus, the overall deviation is inferior to the uncertainty value previously presented.
The flowrates range from 70 to 400 μL min−1 (400 < Re < 1900) In this range, the Reynolds number is always
below 2000, presenting a laminar flow regime (there is no evidence of turbulent flows in this range of Reynolds
[34]). For each measurement, the laminar regime was verified by a linear response of the pressure drop with the Reynolds (Fig. 4a). For a 40 cm capillary, βref is 1.069 × 10²² bar2 m3 s−1 and for a 20 cm capillary is 1.124 × 10²²
bar2 m3 s−1. Between both capillaries, the β deviation is around 5%, which is in the range of the set-up uncertainties
(Table 1 and Fig. 4b).
The experimental data follows a linear trend (Fig. 3c) with R2 > 0.95 as expected from Eq. (4). The
thermophysical properties for the reference fluid were obtained from the NIST Webbook properties database
[33]. The β values obtained from the reference case will be used in Eqs. (5), (6) to determine the density and viscosity.
4. Results and discussion
The developed strategy was applied to pure fluids (CO2 and N2), and to mixtures (CYC + CO2 and CO2 + H2) in
two calibrated silica capillaries with a circular cross-section. The CO2 properties were measured at different
homogeneous conditions: gas, liquid and supercritical. As with the capillaries calibration tests, each pressure drop measurement was repeated three times per capillary to ensure reproducibility. Fig. 5 displays typical plots of pressure drops versus time for the particular case of a CYC + CO2 mixture (90:10 mol:mol) at 130 °C and
139 bar. In these examples, the pressure drops mixture were measured for two different capillaries (Fig. 5a and b) and the β and α parameters were thus determined for each capillary.
Fig. 6 summarizes the obtained experimental values of ρ and μ for the various considered systems (i.e. pure CO2,
pure N2, CYC + CO2 and CO2 + H2 mixtures) at several temperature/pressure conditions and their comparison
with literature or calculated data. For cases where there were no literature data available, a thermodynamic model coupled with correlations was used to predict viscosity and density. The AspenPlus® software was used for
calculating data (using the PR78 thermodynamic package). It can be noticed that the viscosity values have a maximum and average deviation of 7% and 4%, respectively, while the density values have a maximum and average deviation of 6% and 4%, respectively. As previously mentioned, better results should be achieved with the use of more precise pressure transducers, specifically for low viscosity fluids generating low pressure drops.
5. Conclusion
We have demonstrated the possibility of using a pressure drop method in microdevices (silica capillaries with an inner diameter of 73.6 μm) for measuring simultaneously viscosity and density of homogeneous pure fluids and mixtures in a wide range of pressures and temperatures. The proposed set-up can work in a wide range of pressures (10 < P(bar) < 200) and temperatures (30 < T(°C) < 227). The developed strategy was applied to determine the viscosity and density of pure fluids (CO2 and N2), and mixtures (CYC + CO2 and CO2 + H2). The
reliability was determined by comparing the obtained density and viscosity values with these from the NIST Webbook database [33] or calculated with Aspen® PR78. The overall average relative deviation obtained was
around 4%.
This approach allows to: (i) decrease the analysis time, (ii) coupled viscosity/density measurements, (iii) improve heat exchange and (iv) couple thermophysical fluid properties measurements with in situ characterization techniques. Furthermore, this approach exhibit high operation safety, thanks to the small quantities of fluids used.
Acknowledgements : The authors would like to thank the IFPEN, the ANR (through the SEED “CGSμLab” project and the international “Sustainable manufacturing” project – ANR‐12‐SEED‐0001), the CNES and the Région Aquitaine for financial support. Appendix A. Supplementary data associated with this article can be found, in the online version : https://doi.org/10.1016/j.supflu.2015.04.016
References
1. Loppinet-Serani, C. Aymonier, F. Cansell. Supercritical water for environmental technologies. J. Chemical Technology and Biotechnoly, 85 (2010), pp. 583-589.
2. F. Cansell, C. Aymonier. Design of functional nanostructured materials using supercritical fluids. J. Supercritical Fluids, 47 (2009), pp. 508-516.
3. J.D. Grunwaldt, R. Wandeler, A. Baiker. Supercritical fluids in catalysis: opportunities of in situ
spectroscopic studies and monitoring phase behavior. Catalysis Reviews: Science and Engineering, 45 (2003), pp. 1-96.
4. R. Gläser, R. Josl, J. Williardt. Selective oxidation of 1- and 2-propanol with molecular oxygen by noble metal catalysis in ‘supercritical’ carbon dioxide. Topics in Catalysis, 22 (2003), pp. 31-39.
5. A.C.J. Koeken, L.J.P. Van Den Broeke, B.J. Deelman, J.T.F. Keurentjes. Full kinetic description of 1-octene hydroformylation in a supercritical medium. J. Molecular Catalysis A Chemical, 346 (2011), pp. 1-11. 6. N.E. Musko, A.D. Jensen, A. Baiker, G.M. Kontogeorgis, J.D. Grunwaldt. Fluid phase equilibria of the
reaction mixture during the selective hydrogenation of 2-butenal in dense carbon dioxide. Applied Catalysis A: General, 443–444 (2012), pp. 67-75.
7. J. Ke, H. Buxing, M.W. George, H. Yan, M. Poliakoff. How does the critical point change during a chemical reaction in supercritical fluids? A study of the hydroformylation of propene in supercritical CO2. J.
American Chemical Society, 123 (2001), pp. 3661-3670.
8. M. Härröd, M.B. Macher, S. van den Hark, P. Møller. 9.3 Hydrogenation under supercritical single-phase conditions. Industrial Chemistry Library, 9 (2001), pp. 496-508.
9. P. Carlès. A brief review of the thermophysical properties of supercritical fluids. J. Supercritical Fluids, 53 (2010), pp. 2-11.
10. Pioro, S. Mokry. Thermophysical properties at critical and supercritical conditions, heat transfer. Belmiloudi (Ed.), Theoretical Analysis, Experimental Investigations and Industrial Systems, INTECH, Rijeka, Croatia (2011), pp. 573-592.
11. B.E. Poling, J.M. Prausnitz, J.P. O’Connell. The Properties of Gases & Liquids. (fifth ed.), The McGraw-Hill Companies (2001).
12. C.-B. Soo, P. Théveneau, C. Coquelet, D. Ramjugernath, D. Richon. Determination of critical properties of pure and multi-component mixtures using a dynamic–synthetic apparatus. J. Supercritical Fluids, 55 (2010), pp. 545-553.
13. Y. Sanchez-Vicente, T.C. Drage, M. Poliakoff, J. Ke, M.W. George. Densities of the carbon
dioxide + hydrogen, a system of relevance to carbon capture and storage. International J. Greenhouse Gas Control, 13 (2013), pp. 78-86.
14. Fenghour, W.A. Wakeham, D. Fergunson, A.C. Scott, J.T.R. Watson. Automated isochoric apparatus for the measurement of density of fluid mixtures at temperatures from 298.15 K to 773.15 K and pressures up to 40 MPa: results for helium and for nitrogen. J. Chemical Thermodynamics, 25 (7) (1993), pp. 831-845. 15. N. Liu, C. Aymonier, C. Lecoutre, Y. Garrabos, S. Marre. Microfluidic approach for studying CO2 solubility
in water and brine using confocal Raman spectroscopy. Chemical Physics Letters, 551 (2012), pp. 139-143. 16. A.L. Dessimoz, L. Cavin, A. Renken, L. Kiwi-Minsker. Liquid–liquid two-phase flow patterns and mass
transfer characteristics in rectangular glass microreactors. Chemical Engineering Science, 63 (2008), pp. 4035-4044.
17. F. Mostowfi, S. Molla, P. Tabeling. Determining phase diagrams of gas–liquid systems using a microfluidic PVT. Lab on a Chip, 12 (2012), pp. 4381-4387.
18. S. Marre, K.F. Jensen. Synthesis of micro and nanostructures in microfluidic systems. Chemical Society Reviews, 39 (2010), pp. 1183-1202.
19. S. Marre, A. Adamo, S. Basak, C. Aymonier, K.F. Jensen. Design and packaging of microreactors for high pressure and high temperature applications. Industrial and Engineering Chemistry Research, 49 (2010), pp. 11310-11320.
20. Pinho, S. Girardon, F. Bazer-Bachi, G. Bergeot, S. Marre, C. Aymonier. A microfluidic approach for
investigating multicomponent systems thermodynamics at high pressures and temperatures. Lab on a Chip, 14 (2014), pp. 3843-3849.
21. S. Goldstein, J.M. Burgers. The forces on a solid body moving through viscous fluid. Proceeding of the Royal Society A Mathematical Physical and Engineering Sciences, 131 (1931), pp. 198-208.
22. J.F. Ross, G.M. Brown. Viscosities of gases at high pressures. Industrial and Engineering Chemistry, 49 (1957), pp. 2026-2033.
23. E. Yusibani, Y. Nagahama, M. Kohno, Y. Takata, P.L. Woodfield, K. Shinzato, et al. A capillary tube viscometer designed for measurements of hydrogen gas viscosity at high pressure and high temperature. International J. Thermophysics, 32 (2011), pp. 1111-1124.
24. M. Kawata, K. Kurase, K. Yoshida. Kinetic energy correction in viscosity measurement with capillary method. Rheologica Acta, 13 (1974), pp. 757-760.
25. N. Gascoin, G. Fau, P. Gillard. Novel viscosity determination method: validation and application to fuel flow. Flow Measurement and Instrumentation, 22 (2011), pp. 529-536.
26. Gourgouillon, H.M.N.T. Avelino, J.M.N. a Fareleira, M. Nunes da Ponte. Simultaneous viscosity and density measurement of supercritical CO2-saturated PEG 400. J. Supercritical Fluids, 13 (1998), pp. 177-185.
27. A.R.H. Goodwin, E.P. Donzier, O. Vancauwenberghe, A.D.K. Fitt, a.W. Ronaldson, a. Wakeham, et al. A Vibrating edge supported plate, fabricated by the methods of micro electro mechanical system for the simultaneous measurement of density and viscosity: results for methylbenzene and octane at temperatures between (323 and 423) K and pressures in the range (0.1 to 68) MPa. J. Chemical Engineering Data, 51 (2006), pp. 190-208.
28. Uzunlar, B. Beykal, K. Ehrlich, D. Sanli, A. Jonáš, B.E. Alaca, et al. Frequency response of microcantilevers immersed in gaseous, liquid, and supercritical carbon dioxide. J. Supercritical Fluids, 81 (2013), pp. 254-264. 29. N. McLoughlin, S.L. Lee, G. Hähner. Simultaneous determination of density and viscosity of liquids based
on resonance curves of uncalibrated microcantilevers. Applied Physics Letters, 89 (2006), 184106–184106-3 30. S. Marre, Y. Roig, C. Aymonier. Supercritical microfluidics: opportunities in flow-through chemistry and
materials science. J. Supercritical Fluids, 66 (2012), pp. 251-264.
31. T. Gervais, K.F. Jensen. Mass transport and surface reactions in microfluidic systems. Chemical Engineering Science, 61 (2006), pp. 1102-1121.
32. Urakawa, F. Trachsel, P.R. von Rohr, A. Baiker. On-chip Raman analysis of heterogeneous catalytic reaction in supercritical CO2: phase behaviour monitoring and activity profiling. Analyst, 133 (2008), pp. 1352-1354.
33. E.W. Lemmon, M.O. McLinden, D.G. Friend. Thermophysical Properties of Fluid Systems in NIST Chemistry WebBook. NIST Standard Reference Database Number, vol. 69 (2005).
34. M. Akbari, D. Sinton, M. Bahrami. Pressure drop in rectangular microchannels as compared with theory based on arbitrary cross section. J. Fluids Engineering, 131 (2009), p. 041202.
35. M. Bahrami, M.M. Yovanovich, J.R. Culham. Pressure drop of fully-developed, laminar flow in microchannels of arbitrary cross-section. J. Fluids Engineering, 128 (2006), p. 1036.
36. J. Kestin, M. Sokolov, W. Wakeham. Theory of capillary viscometers. Applied Science Research, 27 (1973), pp. 241-264.
37. R.J. Moffat. Describing the uncertainties in experimental results. Experimental Thermal and Fluid Science, 1 (1988), pp. 3-17.