HAL Id: hal-00296124
https://hal.archives-ouvertes.fr/hal-00296124
Submitted on 24 Jan 2007
HAL is a multi-disciplinary open access
archive for the deposit and dissemination of
sci-entific research documents, whether they are
pub-lished or not. The documents may come from
teaching and research institutions in France or
abroad, or from public or private research centers.
L’archive ouverte pluridisciplinaire HAL, est
destinée au dépôt et à la diffusion de documents
scientifiques de niveau recherche, publiés ou non,
émanant des établissements d’enseignement et de
recherche français ou étrangers, des laboratoires
publics ou privés.
Mid-winter lower stratosphere temperatures in the
Antarctic vortex: comparison between observations and
ECMWF and NCEP operational models
M. C. Parrondo, M. Yela, M. Gil, P. von der Gathen, H. Ochoa
To cite this version:
M. C. Parrondo, M. Yela, M. Gil, P. von der Gathen, H. Ochoa. Mid-winter lower stratosphere
temperatures in the Antarctic vortex: comparison between observations and ECMWF and NCEP
operational models. Atmospheric Chemistry and Physics, European Geosciences Union, 2007, 7 (2),
pp.435-441. �hal-00296124�
www.atmos-chem-phys.net/7/435/2007/ © Author(s) 2007. This work is licensed under a Creative Commons License.
Atmospheric
Chemistry
and Physics
Mid-winter lower stratosphere temperatures in the Antarctic
vortex: comparison between observations and ECMWF and NCEP
operational models
M. C. Parrondo1, M. Yela1, M. Gil1, P. von der Gathen2, and H. Ochoa3 1Instituto Nacional de T´ecnica Aeroespacial, Torrej´on de Ardoz, Spain
2Alfred Wegener Institute for Polar and Marine Research, Research Unit Potsdam, Germany 3Direcci´on Nacional de Ant´artico, Buenos Aires, Argentina
Received: 18 April 2006 – Published in Atmos. Chem. Phys. Discuss.: 9 August 2006 Revised: 2 November 2006 – Accepted: 15 December 2006 – Published: 24 January 2007
Abstract. Radiosonde temperature profiles from Belgrano
(78◦S) and other Antarctic stations have been compared with European Centre for Medium-Range Weather Forecast-ing (ECMWF) and National Centers for Environmental Pre-diction (NCEP) operational analyses during the winter of 2003. Results show good agreement between radiosondes and NCEP and a bias in the ECMWF model which is height and temperature dependent, being up to 3◦C too cold at 80 and 25–30 hPa, and hence resulting in an overestimation of the predicted potential PSC areas. Here we show the results of the comparison and discuss the potential implications that this bias might have on the ozone depletion computed by Chemical Transport Models based on ECMWF temperature fields, after rejecting the possibility of a bias in the sondes at extreme low temperatures.
1 Introduction
The study of processes in the lower stratosphere related to the depletion of ozone in polar regions, such as polar strato-spheric cloud (PSC) formation, chemical reaction rates or air mass trajectory calculations rely on winds and temperatures obtained from analyses and forecasts of operational meteo-rological models. Those models are fed in almost real time by atmospheric data of very diverse origin. In particular, temperatures in the lower stratosphere are mainly based on radiosonde and satellite data. Over the Antarctic region ra-diosonde stations are scarce (fewer than 16 stations report daily to ECMWF) and forecasts rely basically on satellite radiances from the Advanced Microwave Sounding Unit-A (AMSU-A).
Trends in stratospheric temperatures have become a sub-ject of increasing interest as they might impact the ozone
Correspondence to: M. C. Parrondo
concentration, although a large degree of uncertainty re-mains. From climate model runs some authors find a de-lay in the time of the expected ozone recovery as a conse-quence of increased radiative cooling by greenhouse gases (Shindell et al., 1998). Others expect a faster recovery as the O3 column increases by reducing the rate of gas-phase
loss processes (Chipperfield and Feng, 2003). For this rea-son, in recent years much effort has been devoted to quan-tifying the accuracy of the analyses. Manney et al. (2003) compared six meteorological analyses for two Arctic winters finding that the area with temperatures below a PSC forma-tion threshold commonly varies by ∼25%, with some differ-ences larger than 50% between them. Moreover, the biases between analyses vary from year to year. A direct compar-ison between the radiosonde network in the Arctic and the ECMWF for the period 1996–2003 (Knudsen, 2003) shows agreement in some years up to few tenth of K (i.e. 1996/1997 and 1999/2000) while in others a bias larger than 1.5 K is found. We are not aware of similar studies for the Antarc-tic except for the unusual winter of 2002 (Manney et al., 2005) when the first major warming ever observed in the southern hemisphere took place. They used ECMWF Re-Analysis 40 (ERA-40) data and found persistent, unrealistic vertically oscillatory structure in the temperature field. Go-biet et al. (2005) found a similar vertical wave-like structure bias over the Antarctic latitudes in the 2003 winter months (±2 K) after analysing global coverage data derived by radio-occultation methods onboard the CHAllenging Minisatellite Payload (CHAMP). A vertically-dependent temperature bias in ECMWF data was also found by H¨opfner et al. (2006a) from McMurdo.
Assessment of trends in a consistent manner based on all available datasets of stratospheric temperatures was per-formed by Ramaswamy et al. (2001) showing a significant negative trend of more than –1 K/decade over Antarctica from the NOAA Geophysical Fluid Dynamics Laboratory (GFDL) database (Oort and Liu, 1993). Roscoe et al. (2003)
436 M. C. Parrondo et al.: Stratospheric temperatures over the Antarctic region 150 180 210 240 270 300 330 -70 -65 -60 -55 -50 -45 -40 -35 -30 -25 Po te n ti a l vo rt ic it y ( PVU ) Day number
Jun Jul Aug Sep Oct Nov Dec
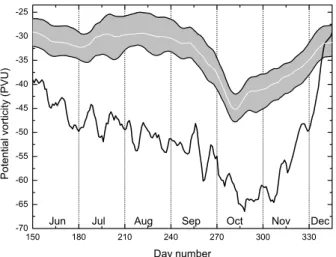
Fig. 1. Seasonal evolution of the potential vorticity at the 475 K
level for Belgrano station (black line) as compared with the edge belt of the Antarctic vortex (shadowed areas) computed by the Nash criteria (see text) for the year 2003.
found a close value of 1.6/1.8±0.6 K at Halley/Antarctica for June–July during the period 1980-2000. During the Quanti-tative Understanding of Ozone losses by Bipolar Investiga-tions (QUOBI) Antarctic 2003 campaign (http://www.nilu. no/quobi/), ECMWF forward trajectories were required to estimate the ozone losses based on the well established La-grangian approach developed for the Arctic, known as the Match technique (von der Gathen et al., 1995; Rex et al., 1997; Streibel et al., 2005). For that purpose 9 Antarctic ozone sounding stations coordinated and extended the num-ber of launchings. An additional effort was expended to increase the number of radiosondes launched from the sta-tions to one per day during the winter-spring season in order to feed the ECMWF model. The dataset produced within QUOBI over Belgrano station has been used here to carry out a comparison with data provided by the ECMWF and NCEP models. Differences in temperature are discussed in terms of their impact on the PSC area probability after reject-ing the possibility of sonde calibration errors at extreme low temperatures.
2 Data
Daily Vaisala RS80 radiosondes flown on Totex TX500 bal-loons were launched during the winter of 2003, extending from 14 June to 12 October. Balloons were dip-oil treated to reduce low – level burst due to loss of elasticity under very cold conditions. A Vaisala Digicora-MW15 receiver system collected and processed the signal. A total of 88 soundings contributed to the comparison up to the 550 K level, decreas-ing to 50 at 650 K due to premature balloon bursts in dark and cold conditions.
The sensor lag is 20 s at 10 hPa (V¨ais¨al¨a, 1963), less than 100 m in height. RS80 temperature accuracy is 0.2◦C up to 50 hPa and 0.3◦C between 50 and 15 hPa (WMO, 1987; WMO, 1991). The error can be up to 1◦C larger above 100 hPa under day conditions (most August and September) due to radiation effects. Radiosondes were launched at lo-cal noon following the recommendations of WMO (1996). ECMWF temperature data from cy26r1 run up to 6 October and cy26r3 afterwards (ECMWF, 2005) at 12:00 UTC have been extracted from NADIR (NILU’s Atmospheric Database for Interactive Retrieval) where they are stored in spectral form truncated to T106 resolution (1.125◦×1.125◦). The NCEP/NCAR temperature data have been extracted from the reanalysis project which uses a global numerical weather analysis/forecast system to perform data assimilation using historical observations (Kistler et al., 2001). The model has 28 vertical pressure levels extending from the surface to
∼40 km with a spatial resolution of 2.5◦×2.5◦.
For means of comparison, the closest data to the model levels from the radiosonde temperature profiles were used without any interpolation. Differences between them are never larger than 0.1 hPa. (mean = 0.034±0.032 hPa).
Areas of potential PSC-I (NAT) and PSC-II (ICE) pres-ence have been calculated from ECMWF temperature fields based on threshold temperatures computed from commonly assumed values of 5 ppmv H2O and 9–10 ppbv HNO3
(M¨uller et al., 2001). Thresholds at the isentropic level of 475 K are 193 K and 188 K for PSC-I and PSC-II, respec-tively, decreasing almost linearly with height to 190 K and 181 K at 700 K.
3 Meteorology
Belgrano (78◦S, 34◦W) is representative of an in-vortex sta-tion during the winter-spring season. In Fig. 1 the potential vorticity (PV) at the station during 2003 is plotted together with the edge of the Antarctic vortex at the 475 K level, as representative of the height where the chemical depletion takes place. The edge is defined for each day by the Nash cri-teria (Nash et al., 1996) as the belt lying between the maxima of the second derivative of PV in equivalent latitudes (shaded lines) rather than a physically unrealistic PV isopleth. This procedure provides information on the position of the station relative to the edge of the vortex. The Belgrano PV has been smoothed by a 5 day running mean to avoid spatial PV inho-mogeneities. In 2003 the station was located well inside the vortex during the whole season until the vortex dilution.
4 Results
Differences in temperature between observations and ECMWF analyses (DT = T(ECMWF) – T(Sonde) in the fol-lowing text) in the lower stratosphere show a systematic bias, with its magnitude dependent on the level considered. The
150 180 210 240 270 300 -6 -5 -4 -3 -2 -1 0 1 2 3 4 5 6 152 180 210 240 270 300 -6 -5 -4 -3 -2 -1 0 1 2 3 4 5 6 Day number in 2003
T
EC MW F-T
ra d io s o n d e s Level 19 = 28.9 hPa ECMWF Level 18 = 23.3 hPaT
EC MW F-T
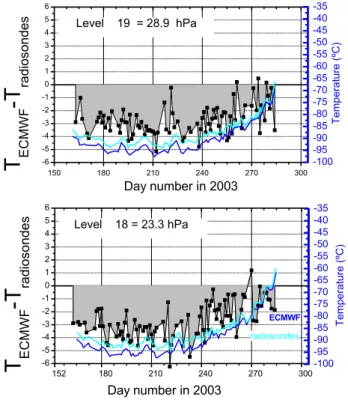
ra d io so n d e s Day number in 2003 -100 -95 -90 -85 -80 -75 -70 -65 -60 -55 -50 -45 -40 -35 T e mp e ra tu re (º C ) T e m p e ra tu re (º C ) -100 -95 -90 -85 -80 -75 -70 -65 -60 -55 -50 -45 -40 -35 radiosondesFig. 2. Evolution of temperatures during winter 2003 for
radioson-des and EMCWF model at the lower stratosphere representative lev-els of 28.9 and 23.3 hPa (right axis) and 1T (left axis) above Bel-grano.
maximum discrepancy occurs in the layer 30–25 hPa where stratospheric temperature reaches its lowest values, being be-low –90◦C during July and August (Fig. 2). The difference is reduced as the temperature increases in September, suggest-ing a correlation between DT and stratospheric temperatures below –85◦C but not at higher temperatures.
A more detailed analysis, that takes into account all ECMWF levels in the radiosonde range, displays a bi-modal structure of DT (Fig. 3). In two ranges centred at 375 K (80 hPa) and 510 K (30 hPa) ECMWF underestimates the temperature while a layer in-between, around 450 K (50 hPa), slightly overestimates it. This behaviour is not vis-ible in the NCEP model. Temperatures are always higher in this model, but differences remain below 1◦C in a layer be-tween 150 and 50 hPa.
Only at 30 hPa or above does NCEP depart positively by 2◦C or more, while below the differences remain below 1◦C. To prove that the observed behaviour is a general feature and not locally-induced or resulting from instrumental fail-ure, the same exercise was performed for the 180 available profiles from 9 stations covering the whole of Antarctica par-ticipating in the QUOBI-Match campaign (Neumayer, Mc-Murdo, Amundsen-Scott, Syowa, Dumont d’Urville, Bel-grano, Davis, Marambio and Rothera). The results display the same bimodal vertical structure with an almost identical
10 10 20 30 40 50 60 70 80 90 100 100 200 300 -4 -3 -2 -1 0 1 2 3 4
Dif (T
model-T
radiosonde) (ºC)
Pre
ssu
re
(h
Pa
)
ECMWF NCEPFig. 3. Differences in temperature between radiosondes and
opera-tional models for Belgrano. Horizontal bars represent one standard deviation.
magnitude.
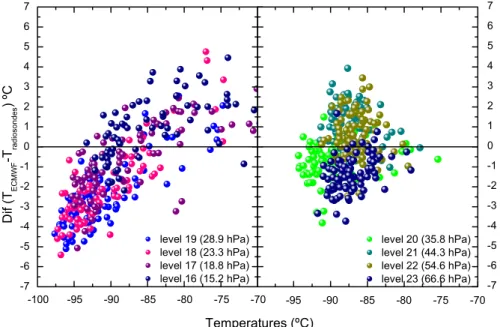
The temperature-dependent bias is not constant with height. It takes place at the ECMWF levels 16–19 (ap-prox. 15.2–28.9 hPa) but not at the 20–23 levels (35.8– 66.6 hPa) (Fig. 4). The discrepancy appears at the tempera-ture of ice PSC-II formation and below, resulting in a model overestimate of the available surface area for heterogeneous reactions with potential implications for the amount of the overall depletion computed by the models for Antarctica.
5 Discussion
The fact that the height-structured discrepancy is not ob-served in NCEP data suggest a problem related to changes in ECMWF Cycle 26 run. Bi-modal structures in DT are usually associated to a shift in the height register of satellite data but it is difficult to attribute to an effect of this nature in the Antarctic winter temperatures since the vertical gradient displays only slow changes with altitude.
As mentioned in a previous section, RS80 radiosondes accuracy lies in the 0.2–0.3◦C range. The sensor is a
438 M. C. Parrondo et al.: Stratospheric temperatures over the Antarctic region -100 -95 -90 -85 -80 -75 -70 -7 -6 -5 -4 -3 -2 -1 0 1 2 3 4 5 6 7 level 19 (28.9 hPa) level 18 (23.3 hPa) level 17 (18.8 hPa) level 16 (15.2 hPa) D if ( TEC M W F -T ra d io s o n d e s ) ºC -95 -90 -85 -80 -75 -70 -7 -6 -5 -4 -3 -2 -1 0 1 2 3 4 5 6 7 level 20 (35.8 hPa) level 21 (44.3 hPa) level 22 (54.6 hPa) level 23 (66.6 hPa) Temperatures (ºC)
Fig. 4. Temperature versus 1T dependent levels (left panel) and independent levels (right panels) for data from Belgrano.
-100 -95 -90 -85 -80 -75 -1.0 -0.5 0.0 0.5 1.0 1.5 2.0 2.5 D if (T ra d io so n d e -T ca lib ra to r ) ºC Chamber temperature (ºC)
Fig. 5. Low temperature calibration of the RS80 radiosonde at
INTA facilities.
THERMOCAP capacitive bead encapsulated in glass, with water-repellent treatment and metallised to minimise radi-ation sensitivity. The radiosonde is calibrated prior to the flight and the offset, if any, corrected in the evaluation anal-ysis. The mean value of the offset corrections in the studied dataset is –0.2◦C with a standard deviation of 0.3◦C. Calibra-tion of the radiosondes is based on 4 points, the lowest one being at –80◦C.
Although no significant departure from the calibration curve is expected for the capacitive beads at lower tem-peratures, we have calibrated a standard RS80 down to – 105◦C to cover the range of temperatures encountered in
the Antarctic stratosphere. For that purpose the SUN Sys-tem 500 environmental chamber facility at the Institute for Aerospace Technology of Spain (INTA) has been used. The sonde was located inside the chamber and operated in nom-inal mode. Temperature inside the chamber was cooled down in 5◦C steps until complete stabilization. Five plat-inum thermo-resistence PT100 (DIN 43760) traceable to the National Standards maintained at CEM (Centro Espa˜nol de Metrolog´ıa) were used for control.
Results show a positive departure from the reference as the chamber was cooled down to temperatures below –90◦C (Fig. 5). However, the bias was of only 0.5◦C at –100◦C, and unable to explain the larger 3◦C difference between sondes and ECMWF model.
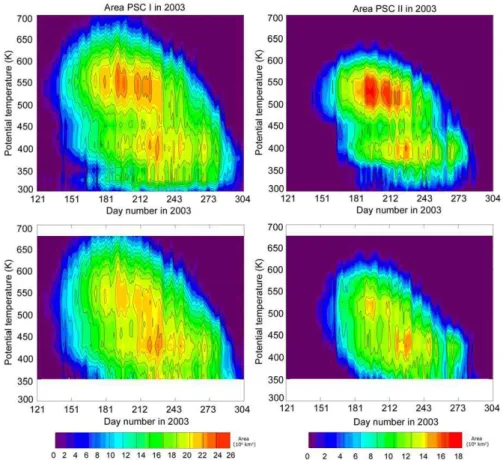
As a consequence, the majority of the observed differences must be attributed to a bias in the ECMWF temperature pro-files. Based on this, calculations of areas where PSC forma-tion is possible yield overestimates, displaying a two layer structure particularly well defined in the PSC-II case and per-sistent with time. In Fig. 6 (top panels) PSC-I and PSC-II probability areas are displayed. After recalculating the ar-eas using the correction of temperatures based on radiosonde data as shown in Fig. 4, the areas of possible PSC are re-duced (Fig. 6, lower panels). PSC-I show small but non neg-ligible effects at the 550 K level. The small change after the correction is not surprising since even after increasing by 3– 4◦C the stratospheric temperatures remain below the PSC-I threshold. On the other hand, the PSC-II area probability is significantly reduced at the 500–550 K level and the two-layer structure almost vanishes. The most significant effect is a downward shift of the altitude associated with the largest PSC area from the rather unrealistic 500–600 K to the 400–
Fig. 6. Left: Areas of potential PSC-I formation based on ECMWF analysis during the winter 2003 (top) and the same after temperature
cor-rection (bottom). Right: Areas of potential PSC-II formation based on ECMWF during the winter 2003 (top) and the same after temperature correction (bottom).
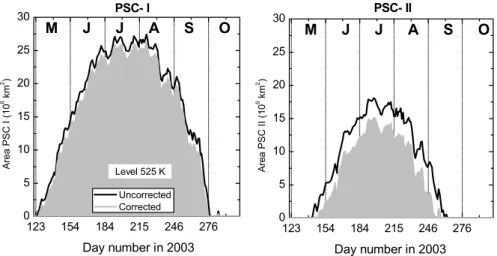
450 K layer, in agreement with the ozone depletion observa-tion heights. At the isentropic level of 525 K the difference between uncorrected and corrected areas represents approxi-mately 8% less PSC-I and 29% less PSC-II of the integrated area for the season (Fig. 7). The ECMWF negative bias for high latitudes northern hemisphere winter 2002–2003 has been previously reported by Knudsen (2003) by using the ra-diosonde network from 50◦–90◦N and 140◦W–140◦E based mostly on Vaisala RS80. The same result is found in the more accurate RS90 radiosonde launched occasionally at several European and Greenland stations. Although no definite ex-planation is offered, Knudsen (2003) speculates on the possi-bility that the assimilation of low-vertical-resolution satellite data, in which upper stratospheric bias is present, can cause changes in the lower stratosphere. Comparisons between the Michelson Interferometer for Passive Atmospheric Sounding (MIPAS) and the ECMWF model also found a negative bias over much of the stratosphere (Dethof, 2003). The Gobiet et al. (2005) global results derived by a completely independent radio-occultation method shows an excellent agreement over Antarctic latitudes in magnitude and height dependence with that obtained in this work.
These authors suggest a contribution in the bias from the AMSU-A radiances assimilation since the wavy pattern cor-relates with the maxima of the temperature weighting func-tions for channels 10 to 12. The same finding is reported by the ERA-40 team for the final years of the data series when the SSU and AMSU-A data were assimilated (Uppala et al., 2005). H¨opfner et al. (2006b) obtained essentially the same vertically dependent bias for McMurdo radiosonde tempera-tures.
The reported results might have implications on the accu-racy of calculation of the ozone losses during the ozone hole period in CTM models that make use of ECMWF tempera-tures. The deviations peak at the two critical isentropic levels of 375 K and 510 K, just outside of the limits of the com-plete ozone depletion layer. Rex et al. (2004) have shown a strong correlation between the vertically integrated ozone losses and the volume of air in which temperatures are below the NAT equilibrium point for the Arctic. Moreover, Knud-sen et al. (2004) found a remarkable correlation between the total ozone mass depleted in the vortex and PSC area prob-ability in the Arctic (correlation coefficient = 0.96) which can be extended to the Antarctic. As a consequence, small
440 M. C. Parrondo et al.: Stratospheric temperatures over the Antarctic region 123 154 184 215 246 276 0 5 10 15 20 25 30 123 154 184 215 246 276 0 5 10 15 20 25 30 M J J A S O Day number in 2003 Are a PS C I (1 0 6 km 2) Uncorrected Corrected Level 525 K PSC- I PSC- II M J J A S O Day number in 2003 A re a P S C I I (1 0 6 km 2)
Fig. 7. Areas where PSC-I(left) and PSC-II (right) can be formed at the isentropic level of 525 K according to the ECMWF temperature
fields (black) and corrected by radiosonde profiles (gray).
changes of few degrees in the temperature might have non-negligible impact on the computation of the depletion in the ozone column, in particular at those levels where the deple-tion is not complete.
6 Summary
Temperatures from radiosondes launched at Belgrano and other Antarctic stations in support of the QUOBI campaign have been compared with the ECMWF and NCEP opera-tional models for the Antarctic winter 2003. Results show good agreement between radiosondes and NCEP and a bias in ECMWF fields which is height-dependent. The departures appear at temperatures below –85◦C and display two nega-tive layers peaking at 80 hPa and 30–25 hPa with a posinega-tive layer between them centred at 50 hPa in excellent agreement with those obtained by Gobiet et al. (2005) derived by a com-pletely independent dataset based on radio-occultation from satellite. A calibration of the Vaisala THERMOCAP sensor to temperatures down to –105◦C shows that the sensor be-haves well down to –100◦C, below the limits of the recorded observational data. Calculations of areas where PSC forma-tion are possible based on the ECMWF model result in an overestimate of the potential PSC presence and hence the sur-face available for heterogeneous reactions to proceed. This effect is particularly significant at the critical isentropic lev-els of 375 and 510 K where ozone is not completely depleted. Small changes of few degrees in the temperature might have non-negligible impact on the computation of the depletion in the integrated ozone column. At the level of 525 K the over-estimate for the whole season is 8% for PSC-I and 29% for PSC-II.
Acknowledgements. The authors want to thank both reviewers,
H. Roscoe and in particular the anonymous reviewer for numerous helpful comments and suggestions and are grateful to the operating staff of the Antarctic stations. ECMWF (via NILU) and NCEP are acknowledged for the operational data. M. Hortal is thanked for the valuable comments on ECMWF data and J. Lentonen for providing detailed information on Vaisala radiosondes. This work has been funded by the Spanish National Plan for Research and Development through MARACA Project (CGL2004-05419-C02-01/ANT) and by the EU 5th framework Programme QUOBI project (EVK2-2001-00129).
Edited by: G. Vaughan
References
Chipperfield, M. and Feng W.: Comment on: Stratospheric Ozone Depletion at northern mid-latitudes in the 21st century: The importance of future concentrations of greenhouse gases ni-trous oxide and methane, Geophys. Res. Lett., 30, 7, 1389, doi:10.1029/2002GL016353, 2003.
Dethof, A.: Monitoring of near-real-time SCIAMACHY, MIPAS and GOMOS data at ECMWF, ENVISAT Validation Workshop, ESA-SP531, 2003.
ECMWF: http://www.ecmwf.int/product/data/operationaSystem/
evolution, 2005.
Gobiet, A., Foelsche, U., Steiner, A. K., Borsche, M., Kirchengast G., and Wickert, J.: Climatological validation of stratospheric temperatures in ECMWF operational analyses with CHAMP radio occultation data, Geophys. Res. Lett., 32, L12806, doi:10.1029/2005GL022617, 2005.
H¨opfner, M., Luo, B. P., Massoli, P., Cairo, F., Spang, R., Snels, M., Donfrancesco, G. D., Stiller, G., von Clarmann, T., Fischer, H., and Biermann, U.: Spectroscopic evidence for NAT, STS, and ice in MIPAS infrared limb emission measurements of polar stratospheric clouds, Atmos. Chem. Phys., 6, 1201–1219, 2006a.
H¨opfner, M., Larsen, N., Spang, R., Luo, B. P., Ma, J., Svendsen, S. H., Eckermann, S. D., Knudsen, B., Massoli, P., Cairo, F., Stiller, G., Clarmann, T. v., and Fischer, H.: MIPAS detects Antarctic stratospheric belt of NAT PSCs caused by mountain waves, At-mos. Chem. Phys., 6, 1221–1230, 2006b.
Kistler, R., Kalnay, E., Collins, W., Saha, S., White, G., Woollen, J., Chelliah, M., Ebisuzaki, W., Kanamitsu, M., Kousky, V., van den Dool, H., Jenne, R., and Fiorino, M.: The NCEP-NCAR 50-Year Reanalysis: Monthly Means CD-ROM and Documentation, Bull. Am. Meteorol. Soc., 82, 247–268, 2001.
Knudsen, B. M.: On the accuracy of analysed low temperatures in the stratosphere, Atmos. Chem. Phys., 3, 1759–1768, 2003, http://www.atmos-chem-phys.net/3/1759/2003/.
Knudsen, B. M., Harris, N. R. P., Andersen, S. B., Christiansen, B., Larsen, N., Rex, M., and Naujokat, B.: Extrapoling future Arctic ozone losses, Atmos. Chem. Phys. 4, 1849–1856, 2004. Manney, G., Sabutis, J., Pawson, S., Santee, M., Naujokat,
B., Swinbank R., Gelman M., and Ebisuzaki, W.: Lower
stratospheric temperature differences between meteorologi-cal analyses in two cold Arctic winters and their impact on polar processing studies, J. Geophys. Res., 108, 8328, doi:10.1029/2001JD001149, 2003.
Manney, G. L., Allen, D. R., Kr¨uger, K., Sabutis, J. L., Pawson, S., Swinbank, R., Randall, C. E., Simmons, A. J., and Long, C.: Diagnostic Comparison of meteorological analyses during the 2002 Antarctic Winter, Monthly Weather Rev., 133, 1261– 1278, 2005.
M¨uller, M., Neuber, R., Beyerle, G., Kyro, E., Kivi, R., and Woste L.: Non-uniform PSC occurrence within the Arctic polar vortex, Geophys. Res. Lett., 28, 4175–7178, 2001.
Nash, E., Newman, P., Rosenfield J., and Schoeberl M.: An ob-jective determination of the polar vortex using Ertel’s potential vorticity, J. Geophys. Res., 101, 9471–9478, 1996.
Oort, A. H. and Liu, H.: Upper-air temperature trends over the globe, 1956-1989, J. Climate, 6, 292–307, 1993.
Ramaswamy, V., Chanin, M-L., Angell, J., Barnett, J., Gaffen, D., Gelman, M., Keckhut, P., Koshlekov, Y., Labitzke, K., Lin, J-J., O’Neill, A., Nash, J., Randel, W., Rood, R., Shine, K., Shiotani, M., and Swinbank, R.: Stratospheric temperature trends: Ob-servations and model simulations, Rev. Geophys., 39, 71–122, 2001.
Rex, M., Harris, N. R .P., von der Gathen, P., Lehmann, R., Braa-then, G. O., Reimer, E., Beck, Chipperfield, M. P., Alfier, R., Allaart, M., O’Connor, F., Dier, H., Dorokhov, V., Fast, H., Gil, M., Kyro, E., Litynska, Z., Mikkelsen, I. S., Molyneux, M. G., Nakane, H., Notholt, J., Rummukainen, M., Viatte P., and Wenger J.: Prolonged stratospheric ozone loss in the 1995/96 Arctic winter, Nature, 389, 835–838, 1997.
Rex, M., Salawitch, R. J., von der Gathen, P., Harris, N. R. P., Chipperfield M. P., and Naujokat, B.: Arctic ozone loss and climate change, Geophys. Res. Lett., 31, L04116, doi:10.1029/2003GL018844, 2004.
Roscoe, H. K., Colwell, S. R., and Shanklin, J. D.: Stratospheric temperatures in Antarctic winter: Does the 40-year record con-firm midlatitude trends in stratospheric water vapour?, Q. J. R. Meteorol. Soc., 129, 1745–1759, 2003
Shindell, D. T., Rind, D., and Lonergan, P: Increased polar strato-spheric ozone losses and delayed eventual recovery owing to in-creasing greenhouse-gas concentration, Nature, 392, 589–592, 1998.
Streibel, M., Rex, M., von der Gathen, P., Lehmann, R., Harris, N. R. P., Braathen, G. O., Reimer, E., Deckelmann, H., Chipper-field, M., Millard, G., Allaart, M., Andersen, S. B., Claude, H., Davies, J., De Backer, H., Dier, H., Dorokov, V., Fast, H., Gerd-ing, M., Kyr¨o, E., Litynska, Z., Moore, D., Moran, E., Nagai, T., Nakane, H., Parrondo, C., Skrivankova, P., St¨ubi, R., Vaughan, G., Viatte, P., Yushkov, V.: Chemical ozone loss in the Arctic winter 2002/2003 determined with Match, Atmos. Chem. Phys., 6, 2783–2792, 2005,
http://www.atmos-chem-phys.net/6/2783/2005/.
Uppala, S. M., K˚allberg, P. W., Simmons, A. J., Andrae, U., da Costa Bechtold, V., Fiorino, M., Gibson, J. K., Haseler, J., Her-nandez, A., Kelly, G. A., Li, X., Onogi, K., Saarinen, S., Sokka, N., Allan, R. P., Andersson, E., Arpe, K., Balmaseda, M.A., Beljaars, A.C.M., van de Berg, L., Bidlot, J., Bormann, N., Caires, S., Chevallier, F., Dethof, A., Dragosavac, M., Fisher, M., Fuentes, M., Hagemann, S., Hlm, E., Hoskins, B. J., Isak-sen, L., JansIsak-sen, P. A. E. M., Jenne, R., McNally, A. P., Mahfouf, J.-F., Morcrette, J.-J., Rayner, N. A., Saunders, R. W., Simon, P., Sterl, A., Trenberth, K. E., Untch, A., Vasiljevic, D., Viterbo, P., and Woollen, J.: The ERA-40 re-analysis. Q. J. R. Meteorol. Soc., 131, 2961–3012, doi:10.1256/qj.04.176, 2005.
V¨ais¨al¨a, V.: Thermometer lag coefficient and radiation error. Vaisala News, 19, 1963.
von der Gathen, P., Rex, M., Harris, N. R. P., Lucic, D., Knudsen, B. M., Braathen, G. O., De Backer, H., Fabian, R., Fast, H., Gil, M., Kyr¨o, E., Mikkelsen, I. S., Rummukainen, M., St¨ahelin, J., and Varotsos C.: Observational evidence for chemical ozone de-pletion over the Arctic in winter 1991–92, Nature, 375, 131–134, 1995.
WMO, International Radiosonde Comparison, UK, 1984 and USA, 1985, Instruments and Observing Methods Report, 30, TD-195, 1987.
WMO, International Radiosonde Intercomparison: Phase III, In-struments and Observing Methods Report, TD-451, 1991.