Digital Synesthesia: Using Mobile Technology and Sensory
Substitution to Interact with Our World
By
Santiago Eloy Alfaro Bernate
MS in Media Technology
Massachusetts Institute of Technology, 2010
MASSACHUSETTS INSTITUTE OF TECHNOLOLGY
GuN
12
201~
I
LIBRARIES
Submitted to the Program in Media Arts and Sciences, School of Architecture and Planning, in partial fulfillment of the requirements for the degree of
Doctor of Philosophy at the
Massachusetts Institute of Technology
January 2015
[Februa.ry
ZOl6"]
© 2015 Massachusetts Institute of Technology. All rights reserved.Signature of Author: _ _ _ _ _ _ _ _ _
Signature redacted
Certified B y :
-Accepted By:
Prog~ in Media Arts and Sciences
/ January 9, 2015
/)
Signature redacted
V. Michael ~ve, Jr. Principal Research Scientist MIT Media Lab~
Signature redacted
C-- \ ' P~tie Maes
Associate Academic Head Program in Media Arts and Sciences
MITLibraries
77 Massachusetts Avenue
Cambridge, MA 02139 http://Iibraries.mit.edu/ask
DISCLAIMER NOTICE
Due to the condition of the original material, there are unavoidable flaws in this reproduction. We have made every effort possible to provide you with the best copy available.
Thank you.
The following pages were not included in the original document submitted to the MIT Libraries.
This is the most complete copy available.
* Appendix page 40 of 40 is a blank page and
Digital Synesthesia: Using Mobile Technology and Sensory
Substitution to Interact with Our World
By
Santiago E. Alfaro Bernate
Submitted to the Program in Media Arts and Sciences, School of Architecture and Planning, on January 9, 2015 in partial fulfillment of the requirements for the degree of
Doctor of Philosophy
at the Massachusetts Institute of Technology
ABSTRACT
Digital Synesthesia is the concept of using sensors and mobile technology to create a user experience that mimics the way people use their senses and enables the perception of information that is outside of our sensory spectrum. Modern technology already offers the ability to detect this information, but what has not been achieved is a way for our brains and body to incorporate this new information as a part of our sensory tool-belt. Then we can truly begin to understand our surrounding world in a new and undiscovered way.
The vision of Digital Synesthesia is to help the current idea of Human-Computer Interface evolve so that it gives way for a new Human-Environment Interface. Digital Synesthesia aims to keep our mobile devices in our pockets while allowing us to experience the world by sensing information outside of our sensory capabilities.
The system will not only collect data through sensors, but also find the best way to pass the information to the body while bypassing visual and auditory channels. This way, the brain will be able to interpret the new information without shifting or dividing attention from the current task.
Thesis Supervisor: V. Michael Bove, Jr.
Digital Synesthesia: Using Mobile Technology and Sensory
Substitution to Interact with Our World
By
Santiago E. Alfaro Bernate
Thesis Supervisor:
Signature redacted
V. [Vfchael Bove, Jr.
Principal Research Scientist MIT Media Lab
Digital Synesthesia: Using Mobile Technology and Sensory
Substitution to Interact with Our World
By
Santiago E. Alfaro Bernate
Thesis Reader:
Signature redacted
Joseph Paradiso Associate Professor of Media Arts and Science Program in Media Arts and Sciences
I dedicate this work to my dad, Carlos Eduardo Alfaro. I know you would have
loved it, found it interesting and think it crazy that no one had thought of it before.
ACKNOWLEDGEMENTS Thanks to:
my committee Mike Bove, Joe P and Kevin Slavin. A lot of work and discussions made this thesis possible and I would not have made it without your guidance.
thanks again to Mike Bove for helping me during these 6 years of life at the Lab. Diana for being a great UROP and wonderful person.
Kristin Hall for keeping me and our group running smoothly.
Linda for keeping me (and all of us) on track and putting up with my lack of memory, having to explain the same thing to me every semester.
the rest of the Media Lab administration, your work is invaluable.
the members of OBMG past and present. Specially Dan, James, Edwina, Cranor, Sunny, Novy, Laura, Pip, Ermal and Bianca.
Edwina for being the best office mate and Sunny for always being up to giving great advice and ready to help with anything.
Jin Joo, Daniel, Brian and the rest of the Media Lab community.
Micah and Suroush you both helped immensely in getting me to learn to code, complete my user studies and understand the data.
Thanks to Caitlin, the best wife, friend and advisor I could have asked for. You have supported me (and us) through some pretty intense times, can't wait to see what else will come.
To Luisa Carolina for inspiring me to finish quickly in order to spend more time with you.
To my Mom, Dad and Brother who have always been very supportive and inspiring to me. I can only hope to keep growing and become as good a person, parent and human as any of you.
Table of Contents
A b stra ct ... 2
Acknowledgem ents ... 7
Executive Sum m ary ... 11
In tro d u ctio n ... 1 5 Digital Synesthesia ... 18
W h y ? ... 1 8 Design Approach ... 19
The im portance of the single affordance ... 20
Background and Related W ork ... 21
Therm al Interfacing ... 22
Vibrotactile Interfacing ... 23
M obile Com m unication ... 24
Sensory Substitution ... 25 Assistive Technologies ... 26 N e w S e n se s ... 2 6 Situational Awareness ... 27 N e u ro p la sticity ... 2 7 Im p le m e n tatio n ... 2 8 System Description (Figure 18) ... 29
H a rd w a re ... 2 9 S o ft w a re ... 3 0 Sensitivity M apping ... 30
Im plem entations ... 32
U se r Stu d ie s ... 3 4 Testing the Feedback ... 35
Testing the Signals ... 35
Proxim ity to Vibration... 39
Tem perature to Sound... 56
Cell Sn r t S u... ensors o ound ... 62
Sm ell Explorations... 66
Sm ell Explorations 2 "The sm ell-m ixer ... 68
Additional User Studies... 70
Stress to Sound ... 70
Location to tem perature... 75
User Studies Sum m ary... 77
R e su lts ... 7 8 Research Questions ... 79
Discrete and Continuous Data ... 79
Sensory Substitution ... 79
Sensory Augm entation ... 80
New Senses ... 80
The User and the New Stim uli ... 81
Escaping the visual user interface... 81
Design Thinking ... 82
W hat is the m ain activity? ... 82
W hat type of signal do w e w ant to track?... 82
W hat kind of sense do w e w ant to create?... 82
Are there any redundancies w ith other senses?... 83
W hat type of feedback can w e use?... 83
W here are the sensor and feedback located?... 83
Can w e set up a learning environm ent?... 83
The M ain activity... 84
Type of signal to be tracked... 85
W hat kind of sense do w e w ant to create?... 86
W hat type of feedback can w e use?... 90
W here are the sensor and feedback located?... 91
Can w e set up a natural learning environm ent? ... 93
Application to Current designs ... 95
Feelspace belt (Nagel et al. 2005b) ... 95
Vibratory Vest (Eaglem an 2014) ... 96
Future Exam ples ... 98
Contributions ... 100 Future Visio.n ... 102 Conclusions ... 105 References ... 107 Non-Cited Bibliography... 111 B io ... 1 1 3 Santiago Eloy Alfaro ... 113
Table of Figures... 114
Appendix A - The M axSonar-EZO Sensor... 116
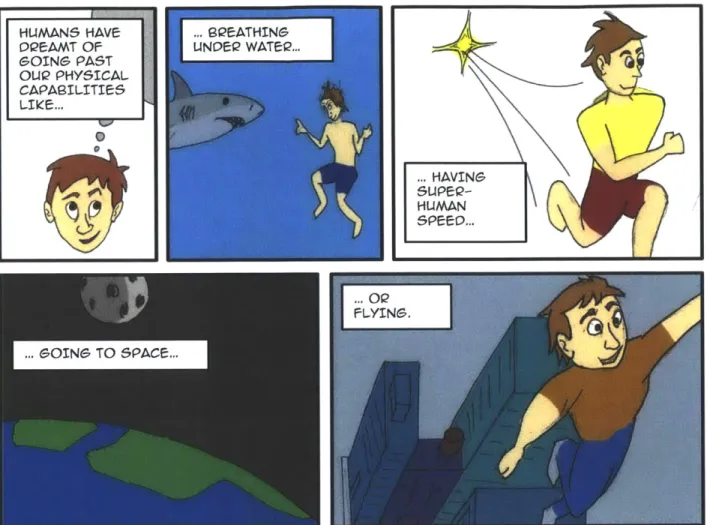
FIGURE 1 - HUMAN DREAMS OF SURPASSING OUR NATURAL ABILITIES
.. HEAQING-...
FIGURE 2 - DREAMS OF AUGMENTING OUR SENSES
EXECUTIVE SUMMARY
Humans have dreamt for many years of going beyond our physical capabilities (Figure 1). We have dreamt of flying, breathing underwater, exploring space or simply moving as fast as possible. All of these dreams have been made possible through the use of technology and our understanding of the physical world around us. We have also dreamt of augmenting our senses (Figure 2). In popular culture, we create characters who are able to see through walls, feel the presence of danger, use echolocation or sense the emotional state of others. Technology has already given us the tools to make most of these dreams a reality. Furthermore, mobile technology has made it possible for humans to use sensors as a ubiquitous just-in-time source of information. This ability to
HUMANS HAVE OQ2eAMT OF GOING PAST OUP PHYSICAL CAPAGILITIE:S LIkE: HAVING' HUMAN
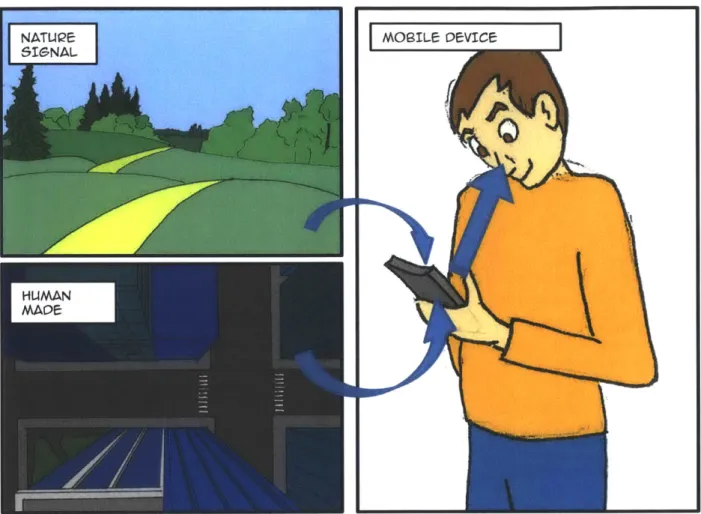
access digital information from anywhere at any time is the main value of mobile devices. But interaction with mobile devices relies heavily on transmitting information visually, which demands a high level of attention from the user (Figure 3).
MOsILE OVICe
I
FIGURE 3 - MOBILE TECHNOLOGY IS THE TRANSLATOR OF THE NATURAL AND ARTIFICIAL WORLD
This thesis explores a way of using sensor and mobile technology to create a superhuman sensory experience that feels as natural as possible to the user. I aim to develop a new paradigm of interaction between users and their mobile devices: one in which the device acts mainly as the "translator" of information while the users interact directly with the world they are trying to explore. This "Digital Synesthesia" can be achieved by using a sensory channel other than vision to relay the information detected by external sensors.
Digital Synesthesia refers to the ability to use mobile technology as the conduit between the body and aspects of the world that the human body is not able to sense. It will connect modern sensing technology with the brain's interpretation of external data. I will show that by using natural sensory channels to represent information beyond human perception, the brain will be
an absolute value of the information being detected, such as degrees Fahrenheit or seconds passed, the users will feel this translated into a physical sensation and the interpretation of the data will be a learned experience. This will allow each user to find a personal meaning for the information that they are experiencing and interpret it in a unique way. By spreading out the interaction across more senses, the experience will feel more natural and thereby allow the users to more easily divide their attention between concurrent tasks. Thus, Digital Synesthesia creates a richer, more immersive experience.
The related work falls mostly into two categories, those that replace a non-working sense with another, and those that give the user a completely new sense. The results of these projects have proved that there is a great opportunity in using senses other than vision or hearing. They have also demonstrated the plasticity of the brain in interpreting information when received through different senses. This thesis will go further by building on top of these findings and asking how we can use Digital Synesthesia to create a new interface paradigm, one that will allow the users to interact directly with the world and not with the mobile device. Since we understand our environment through our senses, having new sensory experiences will grant users a richer understanding of the world as they explore their new sensory capabilities.
The evaluation of this work will be done by conducting a series of studies in which users will wear devices that generate new sensory feedback loops. In these studies, the subjects will be asked to complete a task with the aid of one or more new digital senses. The studies will range from scenarios in which the subject simply compares the digital sense with a natural sense, to a situation where the subject can feel new information and has to discover what it means. Data will be collected on the time and accuracy of the completed task and a qualitative result will be obtained from discussion with the subjects about the wearable technology and the experience in general.
FUTURE PROJECTION
Digital Synesthesia is a platform. It is a way for users to be able to pick up signals, be they natural or artificial, from the surrounding environment and translate them into a useful and unobtrusive feedback that can be tailored for each user and each experience.
In the same way that many animals use natural phenomena to their advantage every day, such as sensing ultra-violet light to choose the best flowers or sensing magnetic fields to choose their direction, Digital Synesthesia will offer a way to tap into these phenomena to which we are not privy. Furthermore, Digital Synesthesia looks past the natural world and tries to understand how the artificial signals that we have created can also be used to the user's advantage in their daily life.
Once humans are able to interpret these physical phenomena in a way that is more in tune with their bodies and less of a cognitive interpretation of quantity, our interaction and general experience in and with the world could change dramatically. By understanding and interpreting these phenomena, designers of digital synesthetic interfaces will have at their disposal hundreds of artificial sensory experiences that can create a completely new sense, replace, or enhance an existing sense in order to be able to create new sensory loops that will offer new experiences to the users.
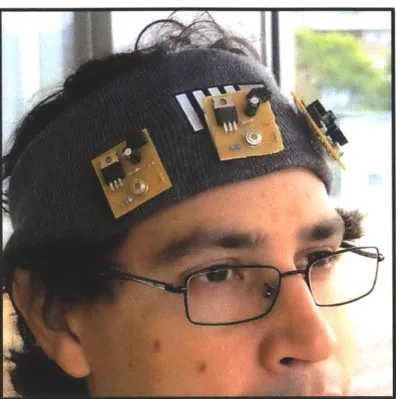
FIGURE 4 - TEMPERATURE SENSING HEAD-BAND
JUMP ANO HOPeFULLY LAND ON ANIMAL
FIND 8AL SPOT ANDI
FeAST
1
I
In his theory of the Umwelt (Uexkull 2010), author Jakob von Uexkull proposes that every
creature has an individual and unique
understanding of their environment, given the individual affordances offered by their senses. For example, the flea's experience of its world is limited by the sensory boundaries of the only three senses it possesses.. The tick will use its skin to feel the sun and know to climb to the tallest blade of grass (Figure 5 A). Once there, its sense of smell will tell it when there might be some prey nearby (Figure 5 B). Lastly, the tick will blindly jump in the general direction of the smell, hoping to land on the animal. At this time, the tick will use its sense of touch to find a comfy bald spot and commence feasting
access to new senses should expand the way in which humans experience their world and therefore is at the center of the Digital Synesthesia project. Modern technology already offers the ability to detect information from the world that is beyond our natural sensory spectrum, but what has not been achieved is the way for our brains and bodies to incorporate this new information as an addition to our sensory capabilities. Digital Synesthesia offers a way of taking new sensory experiences and transmitting them to the body in a way that mimics our other senses, without relying on a mostly visual and highly cognitive experience which demands a big part of the user's attention. Digital Synesthesia therefore helps us to understand our surrounding world in a new and undiscovered way.
This project will look at the ability of a user to quickly assimilate an external stimulation and understand the significance of the signal. In order to do this, the user must be able to combine the information from the stimuli, their understanding of their context and surroundings, and cues from proprioception that relate to the new sensory experience.
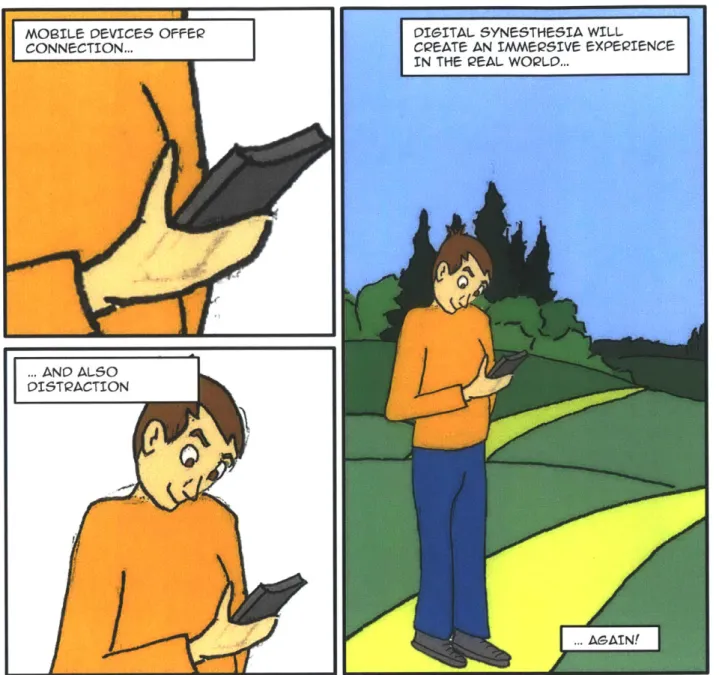
MOsILe DEVICes OFFeQ
CONNECTION...
FIGURE 6 - TECHNOLOGY CREATING DISTRACTION AND REDUCING OUR FEELING OF IMMERSION IN THE WORLD
DIGITAL SYNESTHESIA
WHY?
The evolution of our mobile technologies has led to the generalized feeling that we are slowly isolating ourselves in a virtual social bubble in which we are completely absorbed in our device screens. Many thinkers have looked at this issue from both positive and negative points of view (Turkle 2011; Thompson 2013) and most have arrived at the conclusion that we are
... AND AL50
another and to the world (Figure 6 - Technology creating distraction and reducing our feeling of immersion in the world.
It is my view that our technology should be better at looking for a way to help us be closer to our physical surroundings and smarter at finding a way of giving us all of the benefits it offers, without compromising our interactions with our world and peers. Digital Synesthesia attempts to do just that. I understand that what we have done with mobile devices is to offer just-in-time information streams that enhance our understanding of every moment, place and time. But all this information is being bottlenecked through mainly one sensory channel, overwhelming the
brain into needing to place most of its attention to this one input and ignoring many others.
DESIGN APPROACH
Digital Synesthesia is divided in three major parts: sensing, translation, and feedback. The understanding and implementation of these three areas is the key to create a stable base for future designers to be able to build upon this project.
"Sensing" refers to the technology that will capture information from the world. This area brings interesting cross sections between fields. The designer needs to know about sensors that may be available to capture raw environmental data. Knowledge of how other organisms use information that is outside of our human sensory capabilities would also inform the design process. With that in mind, it is important to understand that the interpretation and usefulness of the information to humans is dependent upon to the context. For example, when we use a sensor to determine if someone has a fever, we are not using a 'fever sensor' or a 'sickness sensor", we are using a temperature sensor. The real usefulness of the raw data comes when that data is interpreted within a specific context, in this case, using temperature to determine health.
"Translation" is a more straight forward part that deals with the communications between the sensor and the mobile device. Here the designers have to use their knowledge in coding and electronics to connect the sensor to a mobile device in order to capture the data. Then, the mobile device will take the raw data from the sensor and translate it into the adequate format for the feedback. This can be as a frequency to be used as a pulse or a sound or as a digital signal to control a motor or a peltier device.
Feedback is the final step. At this stage, the designer will draw upon their knowledge of user interfaces and ergonomics to create a comfortable sensory experience. The design of wearable technology will come into play as we find ways to comfortably generate the sensory signals that will respond to the sensors. Also, part of the feedback will be the design of the sensitivity control interface in which the user can choose to have a more or less sensitive artificial sense, depending on the activity. In the far future vision of Digital Synesthesia, this interface will let a
user choose which sensor they want to be active and where and how they wish to experience this feedback. This way, users will be able to turn artificial senses on and off depending on the activity.
THE IMPORTANCE OF THE SINGLE AFFORDANCE
All five of our senses are able to take-in multiple information at the same time. We can see
many colors, smell olfactory combinations, feel at various points in our body, detect pressure and temperature on our skin and taste different tastes, all at the same time. So the brain is already working hard trying to identify, separate and interpret each of these affordances into a cohesive experience. To create a new sensory experience I chose to reduce the affordance of the signal to its minimum degree. This would give the brain the chance to understand the signal
and the user the chance to to learn from the experience without much training. This is why I have chosen vibration and temperature. With vibration, I have the advantage of using almost any part of the skin and it offers a variety of affordances like frequency, intensity and pattern. I will try to choose a single affordance, mainly frequency; to test how accurate and reliable the sensation is with only this single affordance. With temperature I'll be using the variations in temperature to convey information. My hope is that the brain will be able to couple the simple
Many projects and research have sought to understand the feasibility of using touch, thermal, vibration and haptics to communicate information to the brain. I'll present here the research and projects that best support the basis of Digital Synesthesia.
DIFFC-12CNT MATC-9IAL AQe
PLACE- IN THE-E OVICC
THe P12e55U12C AND
Tempei2ATwe oF TH5UGJCCT MU5T
FINGER1 WA5 M-A5Uieo INTIFY THC- WAQMe12
FIGURE 7 - L.A. JONES AND BERRIS 2003
THERMAL INTERFACING
Studies on a person's ability to discern between two materials using only thermal cues have been conducted. They show how such perception is possible when there is a large difference between the thermal capacity and conductivity of the materials(L.A. Jones and Berris 2003) (Figure 7).
Similar results have been used to present thermal cues to the users in virtual environments and teleoperated systems (L.A. Jones and Ho 2008; Wilson et al. 2011). Digital Synesthesia will further this research by finding more effective ways of coding information through the sense of temperature.
THE eXPCQIMeNT WAS
Q&PEATeD WITH TH suGJECTs
WALXING AP2OUNO
'I )
0
@00
1
L
O@@
'@00
0
an) (jN00
UpmAnd ngkt i A I <ght <800bimk X-Jhape 3 tiars
H Q*If
( Q
D
at "cf. nght k-t 6ooo 4 3 2@000
@000
@000
@000 Adu~nazt kitFIGURE 9 - LYNETTE A JONES, KUNKEL, AND PIATESKI 2009
VIBROTACTILE INTERFACING
LA Jones et al have tested a tactile display mounted
on the user's arm and back(Lynette A Jones, Kunkel, and Piateski 2009) (Figure 9). Simple commands and instructions were communicated through a vibration pattern and tested for accuracy and efficiency. SenseableRays(Rekimoto 2009) (Figure 10) from Rekimoto Labs uses a small finger-mounted module that detects a structured light signal and emits a vibratory pulse giving the sense of feeling the projected light. L A Jones has shown that vibrotactile interfacing is a very effective way of transmit ting information while Rekimoto shows the added value that the tactile sense brings to an experience. Digital Synesthesia will try to join these two efforts to create a more immersive and efficient experience.
11t-ohated 1gM (2) t..,e patter A (1) notactItefeedback (3) tactle paawm a FIGURE 10 -REKIMOTO 2009 AV) up@
MOBILE COMMUNICATION
PeL.TIep Rekimoto lab has presented AffectPhone
WAQMTH (lwasaki, Miyaki, and Rekimoto 2010)
(Figure 11), a system that gives a handset the ability to detect a user's arousal level through Galvanic Skin Response sensors and transmit it to another user as hot or cold sensations in the hand. Similarly,
DeTeCT5 Pressages(Hoggan et al. 2012) is a system
that translates the pressure with which one user squeezes the sides of the mobile
FIGURE 11- IWASAKI, MIYAKI, AND REKIMOTO 2010 phone into a vibration on the receiving
phone. Both these projects are looking to create a better communication by using sensory feedback of the users' state. Connexus (Paulos 2003) (Figure 12) was an ambitious project that attempted to detect several signals of the users in order to recreate an image of the non-verbal cues that were being lost in non-co-located communication. Even though these projects hit close to what Digital Synesthesia looks for, they are from the start limited in certain ways. Since Digital Synesthesia is based more on detecting occurring phenomena than on detecting the other users' willingness to communicate in a new way, the experience is more reliable. Perhaps with the findings from this thesis, other projects like the ones discussed can be revised with a better understanding of digital sensory loops.
CONNEXUS SENSING AND ACTUATION
SENSING ACTUATION
F.URq-PA lL2
SENSORY SUBSTITUTION
Either because a person may be lacking one of the five senses or because a different sensory input may offer other benefits like greater detail, sensory substitution has been seen in several fields (Paul Bach-y-Rita and W. Kercel
2003). Most sensors translate
information, such as temperature, wind speed, distance or the passing of time. All are things our bodies can perceive but by using a sensor and translating the information to a coded visual form we
FIGURE 13 - BRAINPORT, SAMPAIO, MARIS, add the ability of greater accuracy and universal
AND BACH-Y-RITA 2001 understanding. Brainport(Danilov and Tyler 2005) is a
system that captures images through a camera and translates it into electrical signals that are felt on the tongue(Sampaio, Maris, and Bach-y-Rita 2001) (Figure 13). The artist Neil Harbisson and his team have developed Eyeborg (Peng and
Seymour) (Figure 14) so that Neil, who is completely color-blind, can use this device to capture
color information through a camera on his forehead and translate it to sound he hears through
FIGURE 14 - EYEBORG, PENG AND SEYMOUR
bone conduction. These hit at the core of Digital Synesthesia. But what this project proposes is that these kinds of interfaces will be useful in the everyday experiences of the average user. In order for this to happen, the interface has to find a way to be less obtrusive and more user friendly.
AssISTIVE TECHNOLOGIES
A big push for this types of interfaces has been given by the
assistive technologies in its effort to look for viable technologies to aid individuals with either acquired impairments or developmental disorders (Loprestia, Mihailidisb, and Kirschc 2004). This research covers a wide range of techniques dealing with sensory substitution in various ways like tactile experiences (Bach-Y-Rita 2006) (Figure 15) where not only the skin but the tongue is used while looking into effects like
sensory loss and late brain plasticity. The consumer product FIGURE 15- BLIN LIMBER world has also seen vast improvements in these technologies in USING BRAINPORT
devices that use sensors and intricate sonification algorithms to
generate 3D information for the vision impaired (Bujacz, Skulimowski, and Strumillo 2012)
NEW SENSES
Another big area in this field is creating completely new senses. Adding a new sense to our repertoire changes the way we understand and interact with the world. The FeelSpace (Nagel et al. 2005a) (Figure 16) belt was a device with vibrators that could be worn around the waist. The vibrator closest to geographical north would constantly vibrate, giving the user a sense of direction. Another take on navigation is Momo (WANG and O'FRIEL 2013), a handheld
FIGURE 16 -FEELSPACE BELT (NAGEL ET AL. 2005A) egg-like device that leans towards the direction
in which the traveler needs to go. The change in the center of gravity of the device is perceptible in the hands of the user. Dan Berg, a writer and technology advisor, implanted a small magnet into the little finger of his right hand(Berg). One of the reported effects was the ability to sense electrical flow by the disruptions on the magnetic field. Disney research has developed Aireal (Sodhi et al. 2013) (Figure 17), which uses air vortices to create a tactile sensation of virtual images or images projected on the body. These projects hint at the ability of the brain to interpret new experiences. Digital Synesthesia
will make use of this ability to understand how the brain can learn to adapt to new sensory inputs.
IN
A-wPa1
I
FIGURE 17 - AIREAL (SODHI ET AL. 2013)
SITUATIONAL AWARENESS
Situational Awareness is the ability to extract
information from our environment and
integrate it with previous knowledge in order to form a coherent mental picture(Boddhu et al. 2012). The US military has done extensive research on Situational Awareness. They have explored the limits of the brain when forced to work in an environment with many attention cues, as well as different strategies for reducing the cognitive load while conveying information to the brain through channels other than sight or sound. In addition to many studies in how to measure Situational Awareness in various users and situations, there are some papers on actual devices being tested that use Vibrotactile Displays(Raj, Kass, and Perry 2000) and Tactile Navigation Cueing(Dorneich et al. 2006). The findings in these studies will inform Digital Synesthesia on the cognitive limits of the brain when presented with multiple sensory inputs at once.
NEUROPLASTICITY
The field of Neuroplasticity has explored the way in which the human brain is able to evolve and change given different sensory inputs. Studies have shown that a child's brain exhibits a greater range of neuroplasticity than the adult brain but that the adult brain is still capable of change and adaptation(Draganski, Gaser, and Busch 2004)(Pascual-Leone et al. 2005). This research brings a very interesting question to this project. There might be an interesting parallel process in the way the brain adapts to natural sensory inputs and how the brain will map to the new digital sensory inputs. Even though most studies show that the time scale for these changes in the brain to take effect is longer than what this thesis will allow, some new studies are looking into more immediate effects of learning new skills.(Sagi et al. 2012)(Schlaug et al.
FIGURE 18 - SYSTEM DIAGRAM
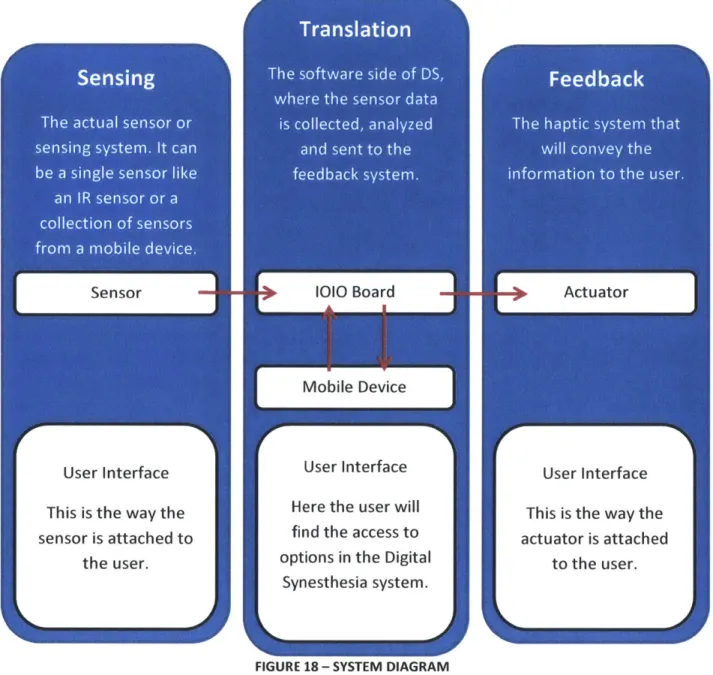
SYSTEM DESCRIPTION (FIGURE
18)
Three systems were designed for this project, all following a very similar architecture. A sensing system, a translation system and a feedback system are designed to be flexible enough to allow for future developing with evolving technologies, usage scenarios and user preferences.
The hardware setup for all studies is based on a lOlO-OTG(Ben-Tsvi 2012) board. The 1010 is a board specially designed to work with Android 1.5 and later. The board provides robust connectivity to an Android device via a USB or Bluetooth connection and is fully controllable from within an Android application using a Java API. Sensors communicate to the 1010 via 12C or Analog Input and the Android software controls a Digital Output Pin to turn High or Low. The Output Pin was connected to a "HEXFET IRLZ34N" from International Rectifier that would control the gate current to a surface transducer "Surface Transducer - Small COM-10917" from Sparkfun(Sparkfun) or a Peltier device. On most cases a 9V battery was used to power the 1010
and the transducer while the sensor would be powered by the 1010 board.
SOFTWARE
There were two main types of application created for this thesis. The first was a User Interface that had two states, depending on if the subject or the examiner was operating it. The other was a simple app that would control the variable of the test in order to allow for a double blind user study.
All applications were coded in Android. The basic user interface application would read the data
received by the 1010 from the sensor, map it to an output range and transform it into the frequency of the signal sent to the 1010 and from the 1010 to the transducer. Two forms of visual feedback were enabled. First, two set of numbers were shown, a numeric "value" would show the raw data coming from the sensor and a "rate" value would show the value after it had been mapped to the sensing range. Second, a graph would show the real time response of the sensor inside the sensing range.
A simple number picker interface offered the subject or examiner the ability to adjust the High
and Low limits of the sensing range in order to adjust the sensitivity. In cases were the subject was given control of the sensitivity, the app would turn on a "Test in Progress" mode where it would hide all visual and numeric feedback from the subject.
SENSITIVITY MAPPING
An important part of this research is to investigate the ability of each user to understand and control the level of sensitivity of their sensory experience. When the system is detecting an analog signal, it may happen that the variations in the signal that the user is interested in are very small, it makes sense then that the user will be able to increase the sensitivity of the artificial signal in order to detect those tiny variations. On the other hand, if the signal happens to be noisy, the sensitivity can be used to drown out the noise and try to detect only the
The way I implemented this feature was by simply mapping the incoming data to a scale from 0 to 1000 that would determine the frequency of the vibration that the user would feel. So when the signal was very strong, the mapping would be close to 0 and this would create a high frequency feedback, 0 being the length in milliseconds between the pulses. Similarly, if the signal was low it would be mapped close to 1000 which would create a low frequency feedback of close to one pulse per second.
OFF Pressure - Values. 1009.98 Ten Level Magnetic 1000 1018 Pressure Accel 1.018 Graph94'.8m 10(64 rOXmiMity .0147 4umidity '01(i Sound 008 (.00 6 WiFi (,0049 (.0033 1.00(6 1000
FIGURE 19 - EXAMPLE SENSITIVITY UI
OFF Tem ugm Magneic Pressure Values: 1009.86 iAc2 I( .iU 1009 1011 Pressure 111r,1- 1) Accel 1 ProxiMity Humidity 0( I sound -(009 WiF (009 (.0094 1,0092 Mm0
The UI for every study would offer a way to control the sensitivity either by the researcher or by the subject The UI would be a number picker and a sliding scale that would control the range of sensing. For example when reading from the pressure sensor on the phone, the full range would prove to be not sensitive enough and the changes would be unperceivable but when the sensing range was
reduced, the changes
became clearer.
In Figure 19 we can see on the graph that when the range is smaller, the small changes are more discernible.
F
IMPLEMENTATIONS
Three implementations have been developed in order to test the user's ability to relate to artificial sensory systems. Each of the implementations was designed to test the user's ability to relate to an artificial sense while reducing the familiarity with the experience. During the first user study the users would be able to try a new artificial sense that would provide a redundancy with an existing natural sense. This way, the users were able to quickly learn to understand the patterns of their new sense. The second user study was designed to take away the redundancy but still give the user some contextual information on the experience. The third user study would remove all redundancies and contextual information and simply ask the users to explore their world and try to understand what the artificial sense was responding to.
FIRST STUDY: PROXIMITY SENSING
For this study, I gave the user a proximity sensor to wear on the palm of their hand and a vibration on the thumb of the same hand. The study was comprised of three stages. First, with a blindfold on, the user was asked to wave their open palm over a table where I had placed a certain amount of objects and try to sense how many objects there were. After every guess, the user
FIGURE 20 - PROXIMITY was allowed to take the blind fold off and see the real answer. SENSING USER STUDY This was important because the users would then try to
remember the feeling of the new experience and in essence calibrate themselves to be able to identify and ignore the noise in the signal.
The second stage used the same methodology but the user was asked to identify the shape of a single figure that was placed on the table. The figure
would be a square, circle or triangle. This time, the
users had to rely on a 2D movement of their hand and also they would have to compare their expectation of how a shape would feel to what they were feeling. The third and final stage asked to identify a 3D shape. So the choices were a cube, a square or a prism.
SECOND STUDY: TEMPERATURE SENSING
FIGURE 21- TEMPERATURE SENSING USER
STUDY At this stage, the project will looked into the creation of
new sensory experiences. This stage studied the users' acceptance of new information that was consciously mapped to a particular sensory
the new sense to be detected, and how the information was translated into what they felt. This allowed me to understand how quickly users can get used to their new sensory experiences and record their impressions on the experience.
For this study, the user was fitted with a head band that had a temperature (IR) sensor facing outwards and a vibrating transducer towards the inside, against the forehead. Four peltier modules were placed on the table in front of the subject. A program was written that would randomly choose one of the four peltier modules to warm up. The subject would have to try to read the feedback vibration on their forehead to decide which modules was on and press the corresponding button on the device. This way nor the subject or the investigator would know which module was active. The investigator would simply record how many responses out of 20 opportunities were successful.
THIRD STUDY: CELLPHONE SENSORS
Here the project set up a new sensory experience in which the users had no prior understanding of the translation taking place. This situation mimics the pattern in which a newborn might search for patterns in order to understand its new senses. This experiment showed how quickly the users can find a correlation between information from the world around them and
FIGURE 22 - CELLPHONE SENSORS USER the sensory feedback.
STUDY
This study was designed to be the closest to the future vision of Digital Synesthesia. The users were fitted with a baseball cap that supported the circuit and vibrating transducer. The vibration was felt on the forehead. An app was written that would scan the available sensors of the mobile device and connect the data stream to the transducer using a 1010 board. The subject where asked to spend 15 minutes walking around the lab, anywhere they wanted to go. After the 15 minutes they were asked to give their best guess as to what the feedback on their forehead was responding to.
As a whole, these studies were looking to understand the ability of a user to form a coherent story by adding together minimal artificial information, proprioception cues and contextual knowledge. They have proven that when the subject is confronted with minimal information about a sensory feedback, they are quite capable of forming a good causal relation between the experience and the world and that even when they don't understand the actual sensing device; the mental mapping of the experience is still formed.
This thesis has been approached as a design and HCI thesis looking to understand the impact of various approaches to Digital Synesthesia. In addition some crude measurements were taken in order to generate a more robust analysis that will help inform the direction for further study. There was a series of user studies designed for this thesis at different levels of complexity and
completion. Early in the process, I realized it would be advantageous to quickly iterate through different setups while trying to understand and discern the key concepts that would make up the design tree for Digital Synesthesia. The iterations concentrated on testing different ways of conveying the data to the body. This was my way of "testing the feedback" for the best haptic solutions. Another variable for the studies was the type of signal I wanted to detect. Lastly, every test changed the amount of contextual information the user would have about the test.
TESTING THE FEEDBACK
The studies were created in order to test the best pairing of sensed data and feedback to be felt
by the body. I wanted to test temperature, sound and vibration as feedback so three setups
were created. A transducer was used for both vibration and sound depending on where on the body it was located. One study used vibration to represent data from a proximity sensor worn
by the subject in the palm, the transducer was placed in the thumb of the same hand. Sound
was used to translate data from a temperature sensor and this was used in two user studies, the sensor was worn on the forehead looking outwards and the transducer was behind the sensor and against the forehead. Temperature as feedback was used in one study, the peltier device was worn in the nape and it responded to the location signal of the glass infrastructure around the Media Lab.
TESTING THE SIGNALS
I tried to find different types of signals to carry out the studies. The first distinction in the type
of signals was either analog or binary. I chose as a binary signal a location based experience where the users could sense a feedback every time they walked in front of one of many screens at the lab that can recognize people via RFID. The analog signals I used were given by a proximity sensor and an IR sensor; these signals would slowly ramp up or down depending on the behavior of the user.
CHANGING THE CONTEXTUAL INFORMATION
Lastly, the final variable was the amount of contextual information given to the subject. By contextual information I mean the knowledge that the subject could have about how the sensor, actuator and activity worked. A study with a lot of contextual information was done with a proximity sensor and an actuator worn in the hand. During this test, the user's understading of the study and the context included knowledge of how the system worked, visual confirmation on where the sensor and the actuator were located on their bodies, the
ability to take off the blindfold and confirm their answers and knowledge about details like the sensitivity level to be used and the group of correct choices from which to venture a guess. All of these details amount to contextual information that helps the user understand their artificial sensory experience.
A test with very little contextual information was done where the examiner would only have to
make sure that the user felt the actuator feedback and would give no more information to the user. The user then had fifteen minutes to explore and determine what the artificial sense was responding to.
MAIN USER STUDIES
Sensory substitution studies have proven that the brain is capable of interpreting data from one sensory input that is responding to another sensory input(P Bach-y-Rita et al. 1969). I am interested in understanding how not only the brain will interpret new inputs but mostly how the user will able to use these new sensory experiences as an advantage while completing certain tasks. This will inform me how future users will be able to use Digital Synesthesia in their daily lives. The distinction between brain and user implies that the user is also aware of what all the other senses are saying and of the previous knowledge around their present state and situation. Digital Synesthesia uses the power of the brain not to understand an isolated input but to interpret the aggregate of information of which one part is the artificial sense. If we allow the brain to understand an input in relation to the position of the sensor in the body, the position of the body itself, the speed at which the user is moving, other conditions that are being sensed by the body and what the user knows of the context in which they are, the experience with an artificial sense will be rich, easy to understand and immediately applicable in the users activity.
The user studies were based on very simple haptic feedbacks, a vibration that would change its frequency according to the data received by the sensor, that same vibration but felt as sound through the bones on the head and heat that would increase or decrease temperature in response to the signal. The idea was to give the user a minimal amount of data that came directly form a sensor with minimum processing, hoping that the user would be able to discern noise from signal and be able to understand the signal within the experience.
Table 1 shows a summary of the type of feedback, signal and amount of contextual information given to the subjects. The Proximity study used a vibrator worn on the thumb so the feedback is felt as vibration. The Temperature, Cell Sensors and Stress studies used the same vibrator but worn on the head, this way the vibration is interpreted as sound by the user. The Smell as Signal is one of two explorations of how we can use smell as a feedback signal and the Location study used a Peltier device to create a temperature feedback.
Study
Proximity TemperatureCell Sensors
Smell as signal
Stress
Location
Type of
Feedback
Vibration on the thumbSound through bone conduction
Sound through bone conduction
Smell
Sound through bone, conduction
Temperature on the back of the neck
Type of Signal
Analog signal from sensor Analog signal from sensorDigital signal from the mobile phone
Binary signal from an online feed
Analog temperature signal interpreted as the
emotional state of a person
Binary signal from an RFID receiver and an online feed
Contextual
Info.
High Medium Low High Medium MediumPROXIMITY TO VIBRATION
This study used "proximity" as the artificial sense. The test was designed to be redundant to vision. This means that the subject was able to corroborate through vision what they were feeling through the artificial sense. The data received by the sensor as an analog signal between OV and 3.3V was mapped to a pulse with frequency between 1Hz and 200Hz. A low voltage value corresponds to a 1Hz pulse.
PREPARATION
The system would randomly pick which hand was to be used by the subject. Then the subject would wear an ultrasonic sensor on the palm, of the selected hand, and a transducer on the thumb of the same hand. The user would then have no more than ten minutes to understand how the vibration responded to the proximity sensor. Once the subject felt comfortable with the sense or once the ten minutes were up, the test would begin.
HARDWARE
The system for the first stage and first user study implemented an Ultrasonic Range Finder LV-MaxSonar-EZO that interfaced with a 1010 OTG board through the analog interface. Both the sensor and the 1010 Board where worn by the subject. A two finger wood ring was made so that the sensor could be attached and the subject had a good enough understanding of the direction the sensor was facing, by moving the middle fingers. Different sizes were made to accommodate different users and give all the users the same amount of control over the sensor. The 1010 Board was inside a fabric wristband that also housed the 9V battery for power. The 1010 was connected via USB to the Android device, in this case a Sony Tablet S. The output of the 1010 was fed to the transducer that was attached to the thumb of the same hand that had the sensor.
MB1000
D 1050 cm THE MAXSONAR-EZO SENSORLV-MaxSonar*-EZ0" Beam Pattern (3ft From the maxbotix website'
Sample results for measured beam pattern are shown on a 30-cm grid The detection
patter is shown for dowels of varying diameters that are placed in front of the sensor 900 cm
A 6 1-mm (0 25-inch) diameter dowel D 11-inch wide board moved left to right with (-30 ft
B 2 54-cm (1-inch) diameter dowel the board parallel to the front sensor face
C 8 89-cm (3.5-inch) diameter dowel This shows the sensor's range capability 750 cm * Resolution of 1 inch
Note: For people detection the pattern (-25 IT)
typicaly falls between charts A and B * 20Hz reading rate
600 cm
3-32V 2 Virtually no sensor dead zone,
:J450 cm
A objects closer than 6 inches range as 6
300" inches
10cm * Maximum Range of 254 inches (645
30 c cm)
Beam Characteristics are Approximate
Beam Pattem drawn to a 1:95 scale for easy comparison to our other products.
M-irftvM Inc "Form o i a t ion frm or latest prouc dataseelsa vii rvashvilic
FIGURE 23- SENSOR BEAM PATTERN
" Low 2.OmA average current requirement
" Widest beam of the LV-MaxSonar-EZ sensors
The full datasheet can be found in the Appendices section.
1010PIN41 ICJICO134 MfflF1FOIN_HIJLE 5 M1P)F F)N H LE_ 114-+3V +3v M01OGOiN HQLE 0 5 GN AL)A3 8 F-1E |. nfl) IRFZ34Nl JD c nre +t V GNIj
SOFTWARE
The software side for this study was written to be used only by the examiner. In it they were able to see the numerical value coming from the sensor and the resulting frequency of the transducer after being mapped. Two number pickers gave the ability to change the sensitivity of the artificial sense.
P ox1muty Srse Sonar OF OFF, IR Voltage: 0.48387095 Rate: 144.08601 0 20
FIGURE 25 - USER INTERFACE FOR THE PROXIMITY USER STUDY
TEST PROCEDURE
This test was divided in three phases; each phase would follow a similar structure. The subject would wear a blindfold and asked to identify object on the table. In all phases the subject was given two minutes to try to guess. At the end of the two minutes the subject had the choice of venturing an answer or using 2 more minutes.
I
FIGURE 26 - SUBJECT DURING PHASE ONE
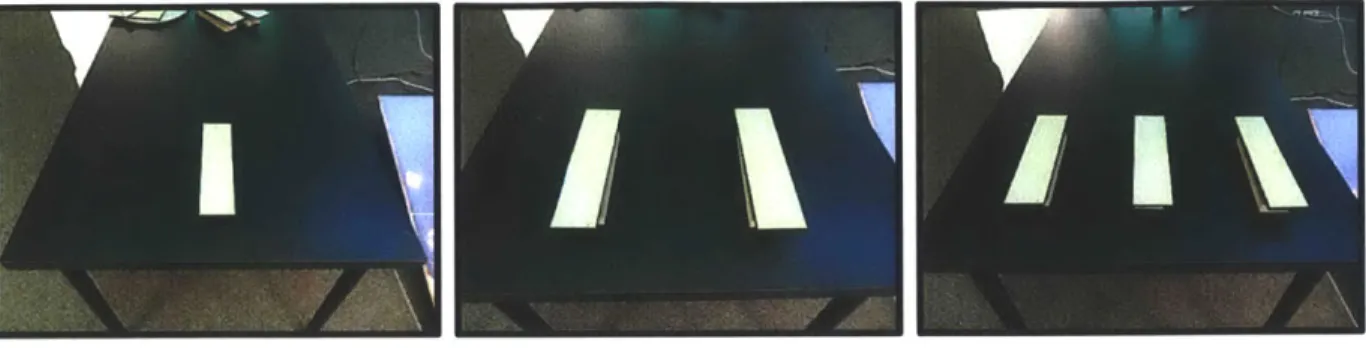
PHASE ONE
On phase one I used flat rectangular wooden pieces of 2" by 12" that were placed on the table in front of the subject. The subject's task was to try to identify how many objects there were. The computer would choose at random any number from 0 to 3 objects that the examiner would place. This exercise was done 4 times while varying the height of the objects and the sensitivity level that was controlled by the examiner. After each try, the subject was allowed to take off the blindfold and compare their answer to the actual number of objects. The iterations were as follows:
First try. Random number of objects, at 2" tall from the table and a sensitivity of 10.
Second try. Random number of objects, at 2" tall from the table and a sensitivity of 5.
Third try. Random number of objects, at 1" tall from the table and a sensitivity of 10.
Fourth try. Random number of objects, at 1" tall from the table and a sensitivity of 5.
FIGURE 27 -ONE, TWO AND THREE BARS
The sensitivity values were decided ahead of time and kept the same through the whole study for all users. The values were chosen by finding a mapping that would demonstrate the usefulness of having different sensitivity while demonstrating the balance between sensitivity and noise. With a low level of sensitivity (sensitivity 10) the subject could only feel small changes in the vibration frequency, with High sensitivity (sensitivity 5) the changes were more noticeable but the noise would also be more noticeable. The noise came from the sensor as well as from the stability of the subject's hand.
PHASE ONE RESULTS
Percentage of accuracy
The results in Table 1 show that70% 0.65 the subjects were close to 50
60% 0.53 percent accuracy. This was
50% 0.47 encouraging since it was well 0.41 above a random distribution that
u 40%
would be close to 25 percent 8 30%
given that the users had one of four choices to make. Table 1
10%
shows the results of phase one.
0%
Two Inches One Inch Totaling the correct answers of
* Sensitivity 10 M Sensitivity 5 phase one in the four tries and
ignoring the height and sensitivity
FIGURE 28 - ACCURACY ON PHASE ONE difference, we have a total (n) of
68 tries; the result gives a percentage of accuracy of 51%. A random control group would have
an accuracy of 25% given that they are choosing amongst 4 possible answers, when compared with the actual result s of this study, we get a confidence value of p<0.002.
PHASE ONE EVALUATION
In this first phase the subject needed to only move their hand from side to side in the X axis and up and down in the Z axis (Figure 29). Up and down would allow them to control the base line frequency they were comfortable with while scanning on the horizontal axis.
The users had no experience with this artificial sense except for a five to ten minute training activity in which they would see how the frequency behaved when the hand was waved over objects of different sizes and with different sensitivity levels.
I was expecting an advantage to having a higher sensitivity setting which would be sensitivity 5
but the results show that sensitivity 10 was easier for the subjects. I believe this to be that at
sensitivity 5 the experience was vulnerable to
unconscious movements of the hand. Some subjects would not notice if the hand went down slowly or small jerks movements that would affect the readings. These small movements were less noticeable at sensitivity 10 which was less sensitive.
The subjects demonstrated different techniques to accomplish this task. Some subjects would simply scan and try to differentiate between noise and signal but some developed more nuanced strategies such as scanning at different speeds and compare their impressions or scan a different heights and compare. Even more would focus specially on the stability and movement of the hand while others focused on the
FIGURE 29 - X AXIS GREEN, Y AXIS feedback, tried to get the rhythm and then detect minor
BLUE AND Z AXIS RED
FIGURE 30 - DIFFERENT SHAPES FOR PHASE TWO
PHASE Two
Phase two presented the subject with just one object. The computer would randomly choose between a circle, a rectangle or a triangle. This exercise was made 4 times as follows.
First try. Random object, at 2" tall from the table and a sensitivity of 10.
Second try. Random object, at 2" tall from the table and a sensitivity of 5.
Third try. Random object, at 2" tall from the table and a sensitivity of 10.
Fourth try. Random object, at 2" tall from the table and a sensitivity of 5.
PHASE Two RESULTS
Once again the results are well
Percentage
of
Accuracy
above random, which in this90% 80% case would be 33 percent
80% 67% 67% given that there were three
70% choices to be made. The
60% 52
6 0% 42%object with the largest
S50% 40%
i 40% percentage of correct answers
30% was the triangle, while the
20% Rectangle had the lowest. This
10% time the most sensitive
Circle Rectangle Triangle setting of 5 was more
successful. Figure 31 shows
M Sensitivity 10 U Sensitivity 5
I the results of phase two.
FIGURE 31- PERCENTAGE OF ACCURACY ON PHASE TWO
Totaling the correct answers of phase two in the four tries and ignoring the sensitivity difference, we have a total (n) of 68 tries; the result gives a percentage of accuracy of 54%. When we compare this to a random
result, which would be 33% because of having to choose amongst 3 possibilities, we get a confidence value of p<0.02.
PHASE Two EVALUATION
Having worked through the first phase, the subjects had a better handle on this artificial sensory experience. This exercise required the subjects to move their hand side to side and also front to back, giving them a 2D field to scan. Because of the first exercise, finding the edges was easy, their job was then to use that information to find a pattern they could compare with their mental expectation of how any of the shapes would feel.
The fact the triangle gave the best results was an interesting finding. Even though I expected this not to be the case given the familiarity of the other shapes, the triangle offers the most drastic change at the corners, making it easy to identify. The circle seems to have had an advantage when people would start inside the shape and then realize how long it took to find an edge.
Two main techniques were used successfully in this task. The most used was scanning the area on the X axis until an edge was found, then moving a bit on the Y axis and scanning again in the opposite way, much like a printer would make a line, advanced the paper and make the next line. The triangle would have a long distance between the edges at the bottom but very small distance at the top. The other technique implied searching for the first definite edge and then bouncing the hand along the edge of the object in an attempt to trace the shape and find the answer.
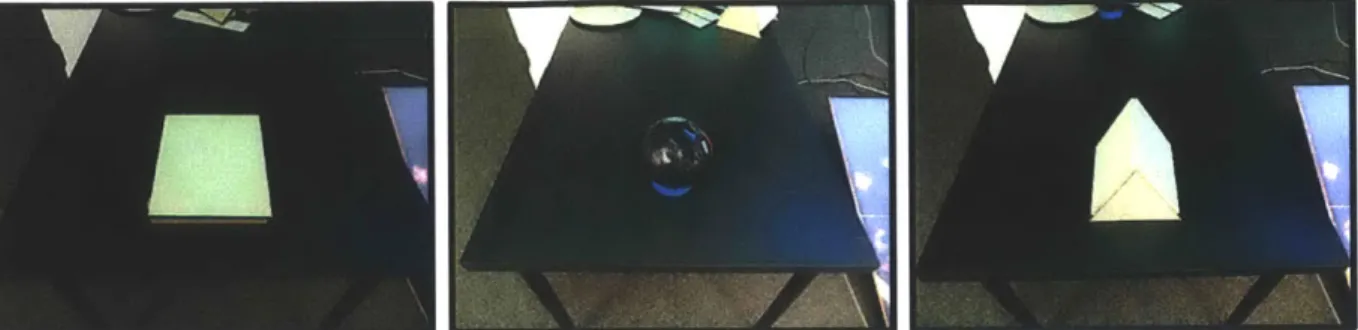
FIGURE 32 - SHAPES FOR PHSE 3. CUBE, SPHERE AND PRISM
PHASE THREE
Phase three was about an object with three relevant dimensions. Since the first two phases had dealt with 2D shapes, this phase presented a cube, a prism and a sphere. Everything else was
just like phase 2 as follows.
First try. Random object, at a sensitivity of 10.
Second try. Random object, at a sensitivity of 5.
Third try. Random object, at a sensitivity of 10.
Fourth try. Random object, at a sensitivity of 5.
Percentage of Accuracy
90% 82% 80% 70% 56%67% 60% 56% U 45% 40%% 50% 40% 4% S40% 33% 30% 20% 10% 0%Sphere Cube Prism
U Sensitivity 10 U Sensitivity 5
FIGURE 33 - PERCENTAGE OF ACCURACY ON PHASE 3
PHASE THREE RESULTS
The sphere shows a success rate barely above random whereas the prism shows a success rate of more than 80%. Overall the success rate for all three shapes was 55%. The results of phase three are shown in table 3.
Totaling the correct answers of phase three in the four tries and ignoring the sensitivity difference, we have a total (n) of 66 tries; the results give a percentage of accuracy of 54%. When we compare this to a random result,
which would be 33% because of having to choose amongst 3 possibilities, we get a confidence value of p<0.03.
PHASE THREE EVALUATION
The most surprising result in this phase was the prism. I expected this shape to be the most unfamiliar and hence the hardest to identify. But it happened that because of the ultrasonic nature of the sensor, the behavior of the feedback was not what the subject was expecting and for that same reason it was the most recognizable once the user knew that was the prism's "signature". What happened is that as the subject approached a side of the prism, the frequency would increase as expected for this and other shapes but once the subject's hand was over the apex of the prism, the wall would not bounce the signal back to the sensor and instead of the frequency being very high, it would jump back to slow, as if there was no object at all. This was confusing the first time the subject encountered but for those that got the prism more than once, it became the easiest shape to understand.
I believe this to be the most significant result because it shows that it is through the exploration
of the artificial sense that we will learn to use it, even if what we feel might seem un-intuitive, as long as it is consistent it will behave as a new sense with its own intricate patterns.
A NOTE ON THE VARIABLES OF THE STUDY
This study was not made as a double blind and fully randomized study. Since it was the first of what would be many more experiments, I chose to control certain variables to determine if there would be a significant effect. The sensitivity of the study was not under full control of the subject because I wanted to see the effect of sensitivity changes without the subject having to learn how to change the sensitivity which would have introduced the uncertainty of some users understanding how the system works and other not. In a similar way, I controlled the height of the pieces from the table as 1 and 2 inches in such a way that the user would feel more confident in looking for the very small changes and not dismiss them as noise.
In the future, a more randomized and blind experiment should be made in order to further these conclusions.
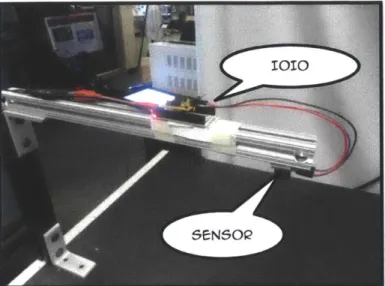
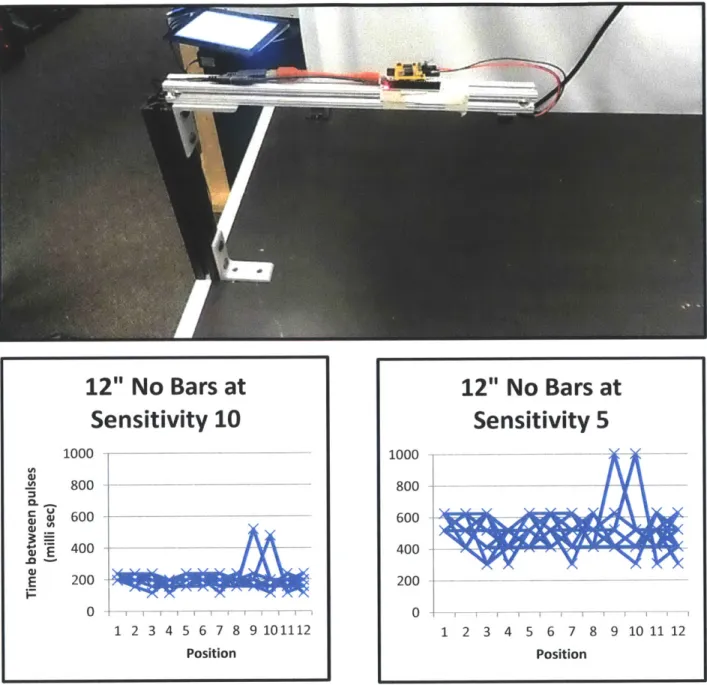
FIGURE 34 - RIG FOR TESTING THE CONTROLLED
BEHAVIOUR OF THE PROCIMITY SENSOR
NORMALIZATION OF THE SENSOR
A set up was built in order to get
accurate raw readings from the sensor in order to determine its specific characteristics.
A rig was built to hold the sensor over
the objects at a constant height and completely still.
The rig allowed for adjusting the distance of the sensor to the table and the objects to be sensed and markings on the table allowed for careful alignment of the rig along the sensing area. Ten seconds of readings were taken at twelve positions along the sensing area. The sensor readings were taken at raw, 10 and 5 sensitivity levels. The test was conducted with various objects and at two different heights from the table.
The horizontal axis in the graphs is the position of the rig on the table. There were 12 measurements taken and plotted. The Vertical axis shows the time between pulses in milliseconds.
FIGURE 35 - MARKINGS TO ACCURATELY RE-CREATE THE MEASUREMENTS