HAL Id: ird-00833540
https://hal.ird.fr/ird-00833540
Submitted on 13 Jun 2013
HAL is a multi-disciplinary open access
archive for the deposit and dissemination of sci-entific research documents, whether they are pub-lished or not. The documents may come from teaching and research institutions in France or abroad, or from public or private research centers.
L’archive ouverte pluridisciplinaire HAL, est destinée au dépôt et à la diffusion de documents scientifiques de niveau recherche, publiés ou non, émanant des établissements d’enseignement et de recherche français ou étrangers, des laboratoires publics ou privés.
Accounting for age uncertainty in growth modeling, the
case study of yellowfin tuna (Thunnus albacares) of the
Indian Ocean
Emmanuelle Dortel, F. Massiot-Granier, Etienne Rivot, J. Million, Jean-Pierre
Hallier, Eric Morize, Jean-Marie Munaron, N. Bousquet, Emmanuel Chassot
To cite this version:
Emmanuelle Dortel, F. Massiot-Granier, Etienne Rivot, J. Million, Jean-Pierre Hallier, et al.. Account-ing for age uncertainty in growth modelAccount-ing, the case study of yellowfin tuna (Thunnus albacares) of the Indian Ocean. PLoS ONE, Public Library of Science, 2013, 8 (4), pp.e60886. �10.1371/jour-nal.pone.0060886�. �ird-00833540�
APPENDIX A. Presentation of data used in the coupling of ageing error and growth models
TABLE A1. Summarize of data used in ageing error model; It: section between nucleus and OTC mark , Im: section between the OTC mark and edge, Ir: section between the nucleus and edge
Fish from RTTP-IO program
knowledge of time-at-liberty: Fish from WSTTP program
with without
Otolith section It Ir Im It It
Number of fishes 80 14 27 30 38
Fork length at tagging
(cm) 43 to 85 50 to 72 Fork length at recapture
(cm) 49.7 to 135.4 59.5 to 114.1 49.7 to 131 47.9 to 146.5 19 to 46.6 Time-at-liberty (days) 43 to 969 33 to 414 43 to 969
FIG. A1. Tagging area (gray-colored) and points of tag recovery (circles) of RTTP-IO program and sampling area (square) of WSTTP program
APPENDIX B. Evaluation by simulation of ageing error model: general approach and results
FIG. B1. Simulation framework for testing the ageing error model; different sources of uncertainty are added to simulated ages to randomly generate noisy increments that were then used as inputs in the model
FIG. B2. Marginal posterior distributions of the ageing error model parameters (black) compared with the simulated distributions (grey) with individual variability (right) and without (left); a, b and c represents the first, second and third simulated data set respectively
FIG. B3. Boxplot of the relative mean square error (RMSE) of estimated age by ageing error model for 2,3,4 or 5 readings of the same otolith; a, b and c represents the first, second and third simulated data set respectively
TABLE B1. Comparison of the RMSE values of estimated age by ageing error model using a Wilcoxon test; 2L, 3L, 4L and 5L correspond to the number of readings of the same otolith; a, b and c represents the first, second and third simulated data set respectively
4L 3L 2L a 5L V = 54527 p-value = 0.01224 4L V = 48750 p-value = 1.767e-05 3L V = 45892 p-value = 2.260e-07 b 5L V = 54789 p-value = 0.01535 4L V = 69539 p-value = 0.0324 3L V = 45324 p-value = 8.683e-08 c 5L V = 46959 p-value = 1.257e-06 4L V = 69539 p-value = 0.0324 3L V = 45324 p-value = 8.683e-08
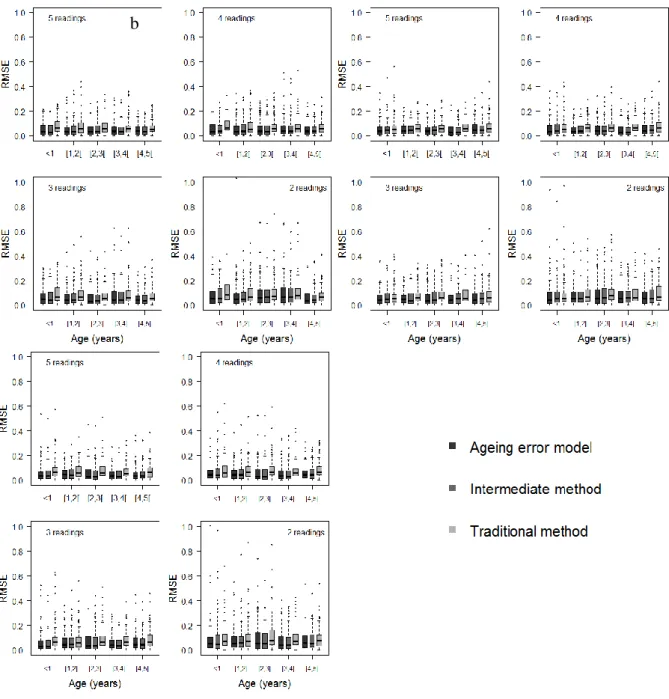
FIG. B4. Boxplot of the relative mean square error (RMSE) of estimated age by the ageing error model, the conventional method and the intermediate method for 2, 3, 4 or 5 readings of the same otolith; a, b and c represents the first, second and third simulated data set
respectively c
TABLE B2. Comparison of the RMSE values of estimated age by ageing error model, the traditional method and the intermediate method using a Wilcoxon test; 2L, 3L, 4L and 5L correspond to the number of readings of the same otolith; a, b and c represents the first, second and third simulated data set respectively
Traditional method Intermediate method
a
Ageing error model
2L V = 28741, p-value < 2.2e-16 V = 55196, p-value = 0.02155 3L V = 28165, p-value < 2.2e-16 V = 57314, p-value = 0.1004 4L V = 28080, p-value < 2.2e-16 V = 59300, p-value = 0.3037 5L V = 28796, p-value < 2.2e-16 V = 59429, p-value = 0.3229
Intermediate method 2L V = 17140, p-value < 2.2e-16 3L V = 16009, p-value < 2.2e-16 4L V = 16139, p-value < 2.2e-16 5L V = 18954, p-value < 2.2e-16 b
Ageing error model
2L V = 37313, p-value = 4.85e-15 V = 52640, p-value = 0.002009 3L V = 35248, p-value < 2.2e-16 V = 49274, p-value = 3.623e-05 4L V = 32274, p-value < 2.2e-16 V = 53918, p-value = 0.007069 5L V = 35057, p-value < 2.2e-16 V = 55195, p-value = 0.02153
Intermediate method 2L V = 36636, p-value = 8.97e-16 3L V = 35714, p-value < 2.2e-16 4L V = 29036, p-value < 2.2e-16 5L V = 32230, p-value < 2.2e-16 c
Ageing error model
2L V = 26437, p-value < 2.2e-16 V = 60299, p-value = 0.4719 3L V = 26608, p-value < 2.2e-16 V = 62971, p-value = 0.9149 4L V = 22487, p-value < 2.2e-16 V = 67331, p-value = 0.1455 5L V = 23658, p-value < 2.2e-16 V = 68155, p-value = 0.08714
Intermediate method 2L V = 24027, p-value < 2.2e-16 3L V = 19659, p-value < 2.2e-16 4L V = 14297, p-value < 2.2e-16 5L V = 15527, p-value < 2.2e-16
APPENDIX C. Bayesian fit of the growth model coupled with the ageing error model
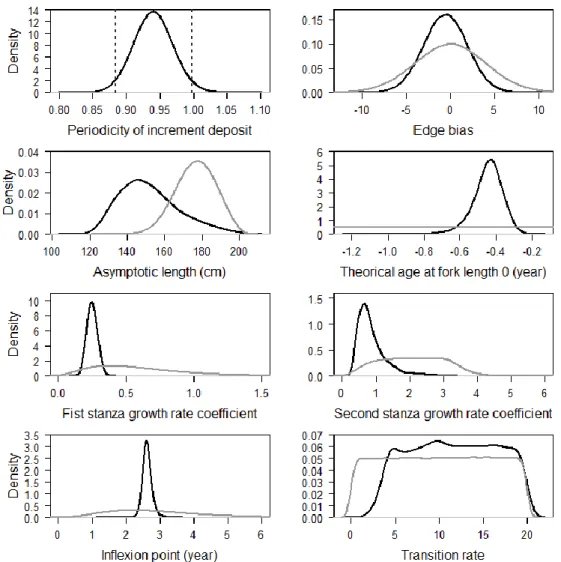
FIG. C1. Marginal posterior distributions of the parameters of the growth model coupled with the ageing error model (black) compared with the prior distributions (grey)
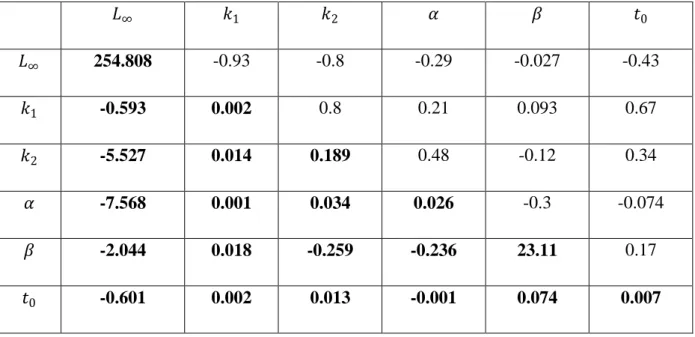
TABLE C1. Correlation-covariance matrix of growth parameters; numerals in bold represent the covariances 𝐿∞ 𝑘1 𝑘2 𝛼 𝛽 𝑡0 𝐿∞ 254.808 -0.93 -0.8 -0.29 -0.027 -0.43 𝑘1 -0.593 0.002 0.8 0.21 0.093 0.67 𝑘2 -5.527 0.014 0.189 0.48 -0.12 0.34 𝛼 -7.568 0.001 0.034 0.026 -0.3 -0.074 𝛽 -2.044 0.018 -0.259 -0.236 23.11 0.17 𝑡0 -0.601 0.002 0.013 -0.001 0.074 0.007