Appropriate Microbial Indicator Tests for Drinking Water in Developing Countries and Assessment of Ceramic Water Filters
by
Chian Siong Low
B.A.Sc., Civil and Environmental Engineering University of Toronto, 2001
Submitted to the Department of Civil and Environmental Engineering in Partial Fulfillment of the Requirements for the Degree of Master of Engineering in Civil and Environmental Engineering
at the
Massachusetts Institute of Technology June 2002
0 2002 Massachusetts Institute of Technology All rights reserved
Signature of Author...
Department of Civil and Environmental Engineering May 13, 2002
Certified by... ... Susan E. Murcott Lecturer, Department of CEE Thesis Supervisor
/
Accepted by... C
.. .D.p.a.t.e.
m an. . Com Chairman, Department Committee... Oral Buyukozturk on Graduate Studies BARKER MASSACHUSETTS INSTITUTE OF TECHNOLOGY
JUN
3 Z002
Appropriate Microbial Indicator Tests for Drinking Water in Developing Countries and Assessment of Ceramic Water Filters
by
Chian Siong Low
Submitted to the Department of Civil and Environmental Engineering on May 13, 2002 in Partial Fulfillment of the Requirements for the Degree of
Master of Engineering in Civil and Environmental Engineering
ABSTRACT
Indicator organisms such as coliforms and E.coli frequently replaced pathogens in the monitoring of microbial quality of drinking water. Tests for indicator organisms are typically easy to perform and results can be obtained quickly. Many studies have concluded that total coliform is not an appropriate indicator in tropical environments. Instead, E.coli is a better indicator of recent fecal contamination and E.coli is proposed as the indicator organism of choice for routine water monitoring in developing countries.
Two Presence/Absence (P/A) tests were studied and compared to Membrane Filtration (MF). The P/A-Total Coliform test is useful in evaluating disinfected water supplies. The P/A-H2
S-producing bacteria test is simple, inexpensive, and suitable for monitoring microbial quality of drinking water in the rural areas. The MF test allows the enumeration of indicator organisms and can be used to assess the microbial removal efficiencies of point-of-use water filters. Different culture media for various indicator organisms were compared based on cost, ease of result interpretation, and medium preparation. The author concluded that m-ColiBlue24® be used for total coliform detection, m-FC with rosalic acid for fecal coliform detection, and either EC with MUG or m-ColiBlue24® for E. coli detection.
For point-of-use water treatment, the author also fabricated a ceramic disk filter in collaboration with Hari Govintha Prajapati, a local pottery maker in Thimi, Nepal. The manufacturing process was documented and design improvements were recommended. Two of these ceramic filters were brought back to MIT and evaluated. Two other Indian TERAFIL terracotta ceramic filters were also tested in the laboratories in Nepal and MIT. Both TERAFIL filters consistently removed 85% turbidity and produced water with less than 1.0 NTU. Total coliform, fecal coliform, and E.coli removal rates exceeded 95% with one exception. However, the two TERAFIL filters have very different maximum flow rates of 2 and 7 L/hr. The Thimi ceramic filters have similar turbidity and microbial removal rates. However, they have significantly lower flow rates of 0.3 L/hr. Despite the high microbial removal rates, some form of household disinfection is necessary for these filters if zero coliform count is to be achieved.
Thesis Supervisor: Susan E. Murcott Title: Lecturer, Department of CEE
ACKNOWLEDGEMENTS I would like to express my most sincere thanks to:
Susan Murcott, my thesis supervisor, for all her guidance and support throughout my entire Nepal project and thesis. I really appreciate her untiring proofreading of my long thesis and the
invaluable feedback she has given me. She has been a true inspiration and mentor all this while.
Everyone in ENPHO, to all the Misters, Misses, Didi, Dai, for all the help in the lab and field. My experience in Nepal will never be as complete and enjoyable without you all.
Hari Govintha, for all your assistance and enthusiasm with the ceramics while I was in Thimi.
Fellow M.Eng'ers, for sticking it out with me for the whole semester!
AY, RC, AW, VL, KL, FY, JS, ET, AC, KC in Toronto. Ur e reason y I'm here, n still alive. I'll miss u all. Esp. to AY, RC, KL: Thx 4 all e listening. U noe how much they all mean to me. (SB: This 9 mths r for u too.)
And most importantly, my parents, and my two brothers and their families. I would not have come so far if not for all the care, support, and the peace of mind you provided me all these years.
TABLE OF CONTENTS
CHAPTER 1 : INTRODUCTION... 11
1.1 Motivation for Microbial Indicator Study ... 11
1.2 Filtration as Point-Of-Use Water Treatment ... 12
1.3 Field Studies in Kathmandu, Nepal ... 13
1.4 S tu d y O bjectiv es ... 16
CHAPTER 2 : WATERBORNE PATHOGENS AND DISEASES... 17
2.1 Introduction to Waterborne Diseases... 17
2.2 Significance of Pathogens in Drinking Water Supplies... 18
2.3 Four M ain C lasses of Pathogens... 19
2.4 Indicator Organisms of Drinking Water ... 23
CHAPTER 3: SUITABILITY OF COLIFORMS AS INDICATORS ... 30
3.1 Introduction to the Coliform Indicator... 30
3.2 Why Coliforms are Chosen as Indicators ... 31
3.3 Why Coliforms are Unsuitable Indicators ... 34
3.4 Inappropriate Use of Coliforms as Fecal Indicators in Tropical Environments ... 38
3.5 Proposed Drinking Water Monitoring Methodologies in Tropical Developing Countries 39 CHAPTER 4: PRESENCE/ABSENCE INDICATOR TEST ... 43
4.1 P/A Test for Coliform Indicator... 43
4.2 P/A Test for Total Coliform and E.coli ... 43
4.3 Water Sampling and Testing Methodology ... 44
4.4 Sampling Procedures for P/A-Total Coliform Test ... 45
4.5 Identification of Total Coliforms with Varying Reactions... 47
4.6 Indicator Organisms Isolated from P/A-Total Coliform Test... 49
4.7 Sensitivity of P/A-Total Coliform Test ... 50
4.8 Summary of P/A-Total Coliform Test ... 52
CHAPTER 5 : ANOTHER PRESENCE/ABSENCE INDICATOR TEST... 53
5.1 P/A Test for H2S-producing Bacteria ... 53
5.2 Rationale for Developing the H2S Test... 53
5.3 Preparation of H2S Test Medium... 53
5.4 Sampling Procedures for H2S Test ... 54
5.5 Association of H2S-producing Bacteria with Coliforms and Fecal Contamination ... 55
5.6 Indicator Organisms Isolated from H2S Test... 58
5.7 Sensitivity of H 2S Test... 59
5.8 Effect of Incubation Temperature on H2S Test ... 62
5.9 Sum m ary of H 2S Test ... 65
6.1 Methods of Microbial Enumeration... 66
6.2 How Membrane Filtration Works... 66
6.3 Advantages of Membrane Filtration over Multiple Tube Fermentation Method ... 67
6.4 M ethodology of M F Test... 67
6.5 Sampling Volumes for TC/FC/E.coli Tests... 70
6.6 Classical Metabolic Methods of Coliform Detection ... 72
6.7 Enzymatic Methods of Coliform Detection... 74
6.8 Modified Membrane Filtration Culture Media for Total Coliform ... 76
6.9 Selecting Culture Media for Different Indicator Organisms ... 78
6.10 Total Coliform Media - m-Endo, m-ColiBlue240, Chromocult*... 79
6.11 Fecal Coliform Media - m-FC with rosalic acid, EC... 82
6.12 E.coli Media - m-ColiBlue24®, EC with MUG ... 84
6.13 Summary of Culture Media Recommendations for Membrane Filtration... 86
CHAPTER 7: MANUFACTURING CERAMIC WATER FILTERS IN NEPAL... 88
7.1 Selection of Ceramic Filters in Nepal... 88
7.2 Local Ceramics Cooperative in Thimi... 88
7.3 Making A Ceramic Filter in Thimi... 90
7.4 Filter Manufacturing Procedure... 93
CHAPTER 8 : ASSESSMENT OF CERAMIC WATER FILTERS ... 99
8.1 Two Filters Studied: TERAFIL and Thimi Ceramic Filters... 99
8.2 Indian TERAFIL Terracotta Ceramic Filter ... 99
8.3 Thim i Terracotta C eram ic Filter ... 101
8.4 O ther Studies on the TER A FIL ... 101
8.5 M ethodology of Filter Testing ... 103
8.6 V ariations in T est C onditions ... 105
8.7 T est R esults and D iscussion ... 109
8.8 C orrelation of R esults ... 116
8.9 F ilter T ests Sum m ary ... 120
8.10 Recommendations for Future Work ... 121
CHAPTER 9 : CONCLUSIONS AND RECOMMENDATIONS ... 122
R EFERENCES ... 125
APPENDIX A - ADDITIONAL TABLES AND DRINKING WATER GUIDELINES AND STANDARDS.. 134
LIST OF TABLES
Table 1-1: Sum m ary of indicators for N epal ... 14
Table 2-1: Waterborne disease outbreaks in the United States, 1980 to 1996. ... 17
Table 2-2: Causes of waterborne disease outbreaks in USA, 1981-1990... 19
Table 3-1: Identification of coliforms isolated from drinking water on LES ENDO agar... 33
Table 3-2: Non-community water systems: comparison of coliform monitoring results prior to and after an outbreak ... 34
Table 3-3: Correlation coefficients for coliform bacteria, turbidity and protozoa in a watershed. ... 35
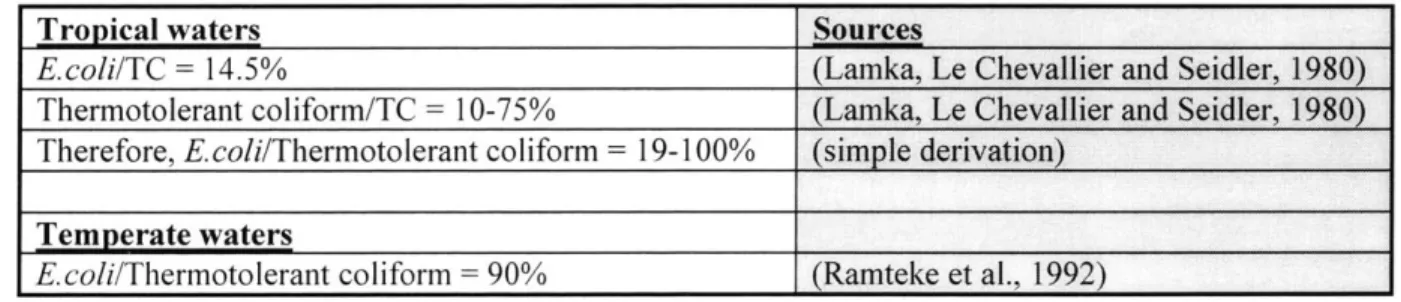
Table 3-4: Relationship between percentage of coliform antagonists and the presence of co lifo rm s. ... 3 7 Table 3-5: Relationships between different indicators as extracted from different literature so u rc e s... 3 8 Table 3-6: Number of indicator bacteria commonly found in human feces (Wet Weight)... 39
Table 4-1: Frequency of reactions in P/A bottles and their confirmation rate for TC... 47
Table 4-2: Confirmation efficiencies of TC with P/A, MPN, MF techniques... 48
Table 4-3: Effect of increasing coliform numbers on indicator bacteria combinations and on the response time to produce a presumptive positive P/A result. ... 48
Table 4-4: Distribution of organisms isolated from raw, drinking, and water from new mains by P /A te sts. ... 4 9 Table 5-1: Agreement of positive H2S tests with various indicator tests - A cross comparison b etw een stu d ies. ... 56
Table 5-2: H2S-producing bacteria isolated from drinking water samples... 58
Table 6-1: Suggested sample volumes for MF-TC test. ... 71
Table 6-2: Suggested sample volumes for MF-FC test. ... 71
Table 6-3: Performance summary of tests carried out with m-ColiBlue24* medium on TC and E .co li reco v ery ... 7 7 Table 6-4: Different coliform colony colors with different culture media... 79
Table 6-5: Summary of TC culture media in terms of cost, ease of result interpretation, and m edium preparation . ... 82
Table 6-6: Summary of FC culture media in terms of cost, ease of result interpretation, and m edium prep aration . ... 84
Table 6-7: Summary of E. coli culture media in terms of cost, ease of result interpretation, and m edium preparation . ... 86
Table 6-8: Summary of selected MF culture medium to use for each indicator organism... 86
Table 7-1: Proportions of red clay, sawdust, and rice husk ash used in the first set of prototypes fired at 10 0 0 *C ... 9 1 Table 7-2: Chemical composition of pottery clay used in Thimi. ... 93
Table 8-1: Summary of TERAFIL performance as tested by five different laboratories... 102
Table 8-2: TERAFIL filter test performance under lab conditions. ... 110
Table 8-3: TERAFIL and Thimi ceramic filter test performance under lab conditions... 111
Table 8-4: Correlation coefficients of various performance parameters for TERAFIL (MIT).. 116
Table 8-5: Correlation coefficients of various performance parameters for TERAFIL (ENPHO). ... 116
LIST OF FIGURES
F igure 1-1: M ap of N epal. ... 14
Figure 2-1: W aterborne pathogen classifications. ... 21
Figure 2-2: Indicator organism classifications... 24
Figure 3-1: Relationship between disease risk and viruses, coliforms and FC. ... 32
Figure 3-2: Relationship between disease risk and Salmonella, coliforms and FC... 32
Figure 3-3: Study of the survival and multiplication of coliforms and faecal streptococci in relatively unpolluted lake w aters. ... 36
Figure 3-4: Regrowth of coliforms and E. coli in sewage effluent after inactivation with 5mg/L ch lo rin e . ... 3 6 Figure 3-5: Persistence of selected enteric bacteria in storm water stored at 20'C... 36
Figure 4-1: HACH LT/BCP 20ml glass ampule... 43
Figure 4-2: General sampling and testing methodology of the author. ... 44
Figure 4-3: P/A equipm ent and supplies for TC test. ... 45
Figure 4-4: Different reactions with the P/A broth when TC are absent or present in various concentrations after 48 hours... 46
Figure 4-5: Fluorescence of the P/A broth after 48 hours in the top most of the 3 bottles when E coli is present in the w ater sam ple... 46
Figure 4-6: Presence and Absence TC results compared to MF-TC test enumeration... 51
Figure 5-1: HACH PathoScreen P/A media pillow and box. ... 54
Figure 5-2: P/A test equipment and supplies for H2S bacteria test. 100 ml sample bottle shown in p ictu re . ... 5 4 Figure 5-3: Absence and presence results of the H2S test after 24 or 48 hours... 55
Figure 5-4: Illustration of the relationships between TC, FC, and H2S bacteria. ... 58
Figure 5-5: Presence and absence H2S results compared to MF-TC test enumeration. ... 60
Figure 5-6: Presence and absence H2S results compared to MF-FC test enumeration... 61
Figure 5-7: Presence and absence H2S results compared to MF-E coli enumeration... 61
Figure 5-8: Left sample was incubated at 35'C for 24 hours and some black color can be seen at the bottom. MF results show 9 TC per 100ml. Right sample showed a positive H2S Test with TC exceeding 600 CFU per I00m l... 63
Figure 5-9: Effects of temperature and FC concentration on incubation period. ... 64
Figure 6-1: Millipore glass MF setup with Millipore incubator on the left... 68
Figure 6-2: Portable M illipore stainless filter holder... 68
Figure 6-3: m-Endo medium showing dark red coliform colonies with metallic sheen... 79
Figure 6-4: m-Endo medium showing a few coliform colonies with metallic sheen, but also with many background colonies which makes counting difficult... 79
Figure 6-5: Plastic ampules are pre-packed with 2 ml of (from left to right) Endo, m-ColiBlue24*, m -FC m edia from M illipore. ... 79
Figure 6-6: m-ColiBlue24* medium showing coliform colonies as red colonies and E.coli (only one E. coli colony) as blue colonies... 80
Figure 6-7: m-ColiBlue24* medium showing a sample crowded with blue colonies (E. coli) and red colonies (TC). Despite the overcrowding, the colonies still show up distinctly which makes counting possible. Brown background is a result of a high iron content in the water sam p le . ... 8 0
Figure 6-8: Chromocult* agar medium showing coliform as salmon pink colonies and E.coli as
blue colonies (overcrow ding). ... 81
Figure 6-9: m-FC with rosalic acid medium showing FC as distinctive blue colonies with little in terferen ce . ... 82
Figure 6-10: EC medium showing FC as cream colored colonies that are less distinctive com pared to the m -FC m edium . ... 82
Figure 6-11: EC with MUG medium (looks exactly the same as the EC medium) prepared from BD /D ifco pow dered m edium ... 83
Figure 6-12: EC with MUG medium showing E. coli colonies fluorescing under a long-w avelength (366nm ) ultraviolet lam p... 85
Figure 6-13: E. coli colonies on a EC with MUG medium not under a ultraviolet lamp... 85
Figure 7-1: Traditional "Potters Wheel" using an old tire and spinning it by hand with a stick.. 89
Figure 7-2: Pottery making in open courtyards where finished pots are left to dry. ... 89
Figure 7-3: Pots ready to be fired in the traditional way are covered with hay and ash... 89
Figure 7-4: Pots are fired between 3-5 days in covered ash mound with small side vents emitting sm o k e . ... 8 9 Figure 7-5: W hite clay candle filter ... 90
Figure 7-6: EN PH O arsenic ceram ic filter... 90
Figure 7-7: Cutting the bottom part of the plastic containers purchased from marketplace... 92
Figure 7-8: Filter disk placed in the plastic containers and silicone applied all around for water se a lin g . ... 9 2 Figure 7-9: Three basic raw materials (from left to right) - Red pottery clay, rice husk ash, and saw d u st... 9 4 Figure 7-10: Hari measuring the various proportions using a green bowl. ... 94
Figure 7-11: Proportions mixed in a red plastic basin. ... 94
Figure 7-12: Mixture placed in a plaster mold made by Hari. The mold has an inner diameter of 6" an d d ep th o f 3". ... 9 5 Figure 7-13: Excess is scrapped off to form a smooth surface after pressing and filling the m ix tu re to th e top ... 9 5 Figure 7-14: The mold is carefully inverted to remove the mixture and is labeled for easy id en tificatio n . ... 9 5 Figure 7-15: Mixtures allowed to dry for 5-7 days before firing... 96
Figure 7-16: Dried mixtures are placed in the kiln and fired at a temperature of 1000-1070oC for 12 h o u rs ... 9 7 Figure 7-17: Filters after firing and ready to be affixed. Lighter color in filters after firing... 97
Figure 7-18: 6-inch diameter ceramic containers also fabricated by Hari... 97
Figure 8-1: TERA FIL filter tested in M IT... 100
Figure 8-2: TERA FIL filter tested in EN PH O ... 100
Figure 8-3: TERA FIL ceram ic filter disk... 100
Figure 8-4: Two Thimi ceramic filters with ceramic filter disks of different compositions that are brought back to M IT ... 10 1 Figure 8-5: Top view of the upper container showing the ceramic filter disk A... 101
Figure 8-6: Simplified diagram showing the top container of the TERAFIL filter and water level. ... ... 104 Figure 8-7: Simple diagram showing the top container of the Thimi ceramic filter and water
Figure 8-8: TERAFIL (MIT) showing the original white cement used to bond the ceramic filter to the m etal container... 106 Figure 8-9: TERAFIL (MIT) showing the silicone added on top of the white cement after drying. ... 106 Figure 8-10: Location near Harvard bridge where water samples are collected from the Charles
R iv e r... 1 0 8 Figure 8-11: Collecting river samples from a "very" polluted Dhobi Khola River in Kathmandu,
N ep a l... 10 8 Figure 8-12: Comparison of the Dhobi Khola River sample with distilled water... 109 Figure 8-13: Collecting high turbidity water from a well near the ENPHO lab... 109 Figure 8-14: Two graphs plotting the flow rates vs. turbidity removal rates of TERAFIL (MIT)
LIST OF ABBREVIATIONS tm BCP BGLB cm CFU Chromocult® CRW DST E coli EC ENPHO FC g H2S HPC IBDG ID LT MAC MF MF-E coli MF-FC MF-TC MI MPN MTF MUG m-ColiBlue24* m-Endo m-FC m-TEC mg ml NGO NRs ONPG P/A P/A-H2S P/A-TC POU Rs TC TSA TTC USEPA WHO X-Glu/BCIG Micrometer Bromocresol Purple
Brilliant Green Lactose Bile Centimeter
Colony Forming Unit
Agar for simultaneous detection of Total Coliform and E coli Charles River Water
Defined Substrate Technology Escherichia Coli
Escherichia Coli
Environment and Public Health Organization Fecal Coliform
Gram
Hydrogen Sulfide
Heterotrophic Plate Count Indoxyl-p-D-glucuronide Infective Dose
Lauryl Tryptose
Maximum Acceptable Concentration Membrane Filtration
E. coli Membrane Filtration Test
Fecal Coliform Membrane Filtration Test Total Coliform Membrane Filtration Test
Agar for simultaneous detection of Total Coliform and E coli Most Probable Number
Multiple Tube Fermentation
4-methyl-umbelliferyl-p-D-glucuronide
Medium for simultaneous detection of Total Coliform and E coli Medium for detection of Total Coliform
Medium for detection of Fecal Coliform Medium for detection of E coli
Milligram Milliliter
Non-government Organization Nepali Rupee (US$1 = NRs 75) o-nitrophenyl-p-D-galactopyranoside Presence/Absence
Hydrogen Sulfide Producing Bacteria Presence/Absence Test Total Coliform Presence/Absence Test
Point-Of-Use
Indian Rupee (US$1 = Rs 45) Total Coliform
Tryptic Soy Agar
Triphenyltetrazoliumchloride
United States Environmental Protection Agency World Health Organization
Chapter 1: INTRODUCTION
Chapter 1 : INTRODUCTION
1.1 Motivation for Microbial Indicator Study
Indicator organisms are often used in place of disease causing pathogens because their presence is indicative of pathogen presence and indicator organisms are easier to detect. Another reason for using simple indicator tests is that pollution is often irregular. It is better to monitor drinking water frequently by means of a simple test than occasionally using more complicated direct pathogen detection tests. Indicator organisms, however, are not universal. Many studies have shown that while traditional indicators may have worked for developed countries in temperate climates, they are not necessarily appropriate for developing countries in tropical environments. There is a need to investigate the suitability of these indicators for their use in tropical environments for the detection of recent fecal contamination in drinking water supplies. Extensive research has already been carried out in this area. These indicators have different characteristics and their significance to the microbial quality of drinking water can vary depending on the monitoring region. After the most appropriate indicator organisms are identified, the methods for their detection are assessed and compared.
There is a wide variety of methods available for testing the microbial quality of drinking water through indicator organisms. The two most common methods that are studied in detail in this thesis are the Presence/Absence (P/A) test and Membrane Filtration (MF) test. The P/A test is a simple method to identify the presence or absence of the indicator organism and is often indicated by a color change. While the P/A test may be adequate for detecting the presence of indicator organisms, it is unable to assess the extent of contamination in the water sample. The ability to enumerate indicator organisms is particularly important when assessing the performance of a water treatment device such as a water filter. It allows the researcher to calculate microbial removal efficiency by finding out how much of the indicator organisms are removed by the filter. However, the MF test is more elaborate in terms of its equipment and incubation requirements compared to the P/A test. There are also many kinds of culture media to choose from for the MF test. In this thesis, based on the author's research, the most appropriate indicator test for monitoring the microbial quality of drinking water and assessment of filter efficiency will be proposed. Specifically, the best culture medium to use for each indicator
Chapter 1: INTRODUCTION
organism during MF is proposed based on the selection criteria: costs, ease of result interpretation, and ease of preparation.
1.2 Filtration as Point-Of-Use Water Treatment
Since the quality of the water supply is often variable and cannot be adequately controlled for millions of people in developing countries, one viable approach could be the implementation of simple, low-cost point-of-use (POU) treatment systems to ensure the provision of safe water for consumption. Point-of-use treatment systems refer to the treatment of water at the household level as opposed to centralized, larger capacity municipal or private systems that carry out treatment of water for a larger population. While an advanced large-scale water treatment system is able to supply many households at any one time, a simple and affordable household water treatment system will be able to reach even the most rural areas of developing countries such as Nepal, therefore reducing their dependency on unsafe drinking water supplies. A good POU system should also satisfy the criteria of requiring minimum training and being easily and cheaply maintained.
Filtration is potentially an appropriate POU treatment process because filters are usually easy and small enough to be used in individual households. Currently in Nepal, the most commonly available point-of-use water treatment system is the ceramic candle filter. This filter can be easily purchased from market-places in Kathmandu Valley. The middle to upper class population in Kathmandu and other urban areas can often afford to boil and filter their water before drinking (Sagara, 2000). Both processes together - boiling and filtering -ensure that the water is sufficiently treated before it is consumed. However, boiling water requires the burning of fuel, which is a valuable and limited resource that may not be affordable for the rural community, and which may also contribute to further deforestation in Nepal. Moreover, there are performance issues with the candle filter such as inadequate water flow rates and ineffective microbial removal from the raw water (Sagara, 2000). It is recommended by Sagara that "the (candle) filter system must be used combined with a disinfection process." This disinfection process could refer to boiling (as already carried out by the better-off community), chlorination, solar disinfection etc. Unfortunately, the taste of residual chlorine in the drinking water may be unacceptable to some of the local population. If chlorine is to be applied, the residual chlorine
Chapter 1: INTRODUCTION
concentration has to be high enough to achieve the required disinfection, and low enough to maintain a palatable taste to the water.
Currently, other studies are being conducted by the MIT Nepal Water Project and other MIT Masters of Engineering projects to study the effectiveness of filtration as a POU treatment method of drinking water. One study involves the application of colloidal silver on a ceramic filter developed by an organization called "Potters for Peace" (Rivera, 2001). Colloidal silver has a disinfecting effect and depending on the applied concentration, it is possible to kill or inactivate microorganisms in water to achieve safe drinking water guidelines. Another filter under study is the BioSand water filter which uses a thin microbiological film in the top layer sand to remove harmful microorganisms from the water (Lee, 2001; Lukacs, 2002). In this thesis, laboratory studies were conducted both in MIT and Nepal, on an Indian TERAFIL terracotta ceramic filter. In collaboration with a local Nepal ceramic cooperative, the author also manufactured and brought back two ceramic filters for testing at MIT.
1.3 Field Studies in Kathmandu, Nepal
In January 2002, the author visited Nepal and stayed in the capital city, Kathmandu, for three weeks. He was hosted and worked in the laboratory of Environment and Public Health Organization (ENPHO), a Non-Government Organization (NGO) in Nepal whose mission is monitoring and improving local drinking water supply, wastewater treatment, solid waste disposal, and air quality monitoring. ENPHO has a well-equipped water quality testing laboratory which the author used during his stay. He carried out microbial tests on 15 different drinking water sources in the Kathmandu Valley (primarily in the city of Kathmandu and Patan). He also assessed the performance of an Indian TERAFIL ceramic water filter in the lab. Finally, the author was also making a terracotta ceramic filter disk in a nearby town, Thimi. Next, a brief background on the water supply and contamination situation in Nepal is presented.
Nepal, officially known as The Kingdom of Nepal, is a landlocked country in southern Asia, bordered on the north by the Himalayas and the Tibet region of China and bounded by India to the east, south, and west (See Figure 1-1). There are three distinct geographic regions in Nepal: the plains to the south, the central foothills, and the Himalayas to the north. The plains region,
Chapter 1: INTRODUCTION
also called the Terai districts, contain an abundant source of groundwater resources for irrigation and drinking purposes. The low water table is generally found between 3 to 18 meters below ground (Shrestha, 2000). The central foothills are densely populated and most of Nepal's major cities including the capital Kathmandu, and tourist attraction center of Pokhara are located there. The northern mountainous region contains the highest peak in the world, Mount Everest.
~K&
Figure I-1: Map of Nepal.
Although Nepal is rich in freshwater resources, they are unevenly distributed and the water infrastructure is poorly developed. Forty-three percent of the rural population has access to safe water (WHO, 2001). More than 4 million people living in the rural areas do not have access to safe water. Although 90% of the urban population is served with piped water supply, many water supply systems provide water for only a few hours each day (Shrestha, 2000). From the author's personal experience in Kathmandu, a significant number of the urban households still depend heavily on traditional and communal water supplies e.g. public taps and wells, for their water needs. Forty percent of the piped supplied water is estimated to be lost due to leakage in distribution pipes and the bypassing of the water meter by consumers (Shrestha, 2000). The greatest water demand comes from industry and hotels, leaving little for residential use. Only 20% of the rural population, compared to 75% of the urban population, has access to adequate sanitation (UNICEF, 2000). See Table 1-1 for a summary of these indicators of Nepal.
Table I -1: Summary of indicators for Nepal.
Indicators Nepal
Total Population 23.9 million
Urban Population 12% Rural Population 88%
Annual GNP per capita US$230 (42% lives below
Chapter 1: INTRODUCTION
Life Expectancy 58 years
Infant Mortality 77 per 1,000 live births
Literacy Rate 22% (women)
57% (man)
Access to safe water 43% (rural) Piped Water Supply 90% (urban)
Water Loss in Urban 40% Distribution Pipes
Average Per Capita Water 52 Liters per day
Availability
Access to Adequate 75% (urban)
Sanitation 20% (rural)
The problems of clean drinking water and lack of proper sanitation are closely related. Pathogen-laden human and animal wastes, food and garbage pile up near homes and tubewells and drain into waterways, contaminating the water sources. For example, surface water, such as rivers in the Kathmandu Valley, is polluted by industrial effluent, dumping of untreated waste, and sewage from residential areas (NepalNet, 1999). Seepage from poorly maintained septic tanks also contribute to the groundwater contamination. Leakage from sewer pipes, which often run parallel to the water supply pipes, can also contaminate the supply pipes through cracks. The city water is often inadequately treated due to the lack of maintenance. In addition, since piped water is available for only a few hours a day, residents store water in storage tanks and own privately dug wells so that water is available for use throughout the day. These containers are seldom washed and properly maintained, therefore contaminating water that could be clean originally (Rijal et al., 2000). Water obtained from the wells do not usually undergo any form of treatment before consumption, therefore they are unsafe for drinking.
Despite an increase in access to water supply from 46% in 1991 to about 80% in 2000, there is another problem with the lack of proper sanitation and hygiene practiced among the residents. Overall latrine coverage in Nepal is only 27% in 2000 (UNICEF, 2001). This also translates into the discharge of at least 1,500 tonnes of feces onto the fields and waterways everyday (UNICEF, 2001). The combined effect of inadequate access to a safe water supply, poor environmental sanitation, and personal hygiene has adversely affected the quality of life and health conditions of the Nepali people. Sanitation-related diseases account for 72% of total ailments and diarrhea continue to be one of the leading causes of childhood deaths in Nepal (ADB, 2000). Other
Chapter 1: INTRODUCTION
common waterborne diseases in Kathmandu include gastroenteritis, typhoid and jaundice (Shrestha, 2000).
1.4 Study Objectives
There are three objectives to this study after an assessment of a number of options and they are: 1. To propose the most appropriate indicator organisms and their corresponding microbial
tests for the monitoring of drinking water quality in Nepal and other developing countries;
2. To propose the most appropriate microbial indicator tests for assessing the performance of point-of-use water filter systems;
3. To assess the effectiveness of two different types of ceramic water filters as POU treatment solutions.
Chapter 2: WATERBORNE PATHOGENS AND DISEASES
Chapter 2
:
WATERBORNE PATHOGENS
ANDDISEASES
2.1 Introduction to Waterborne Diseases
"Infectious diseases caused by pathogenic bacteria, viruses, and protozoa or by parasites are the most common and widespread health risk associated with drinking water." (WHO, 1993a)
The wide variety of waterborne diseases and their public health impact is an important concern with far-reaching implications. 3.4 million people, mostly children, die annually from water-related diseases. Out of this number, 2.2 million people die from diarrheal diseases (including cholera) (WHO, 2000). Waterborne diseases are typically caused by enteric pathogens which are mainly excreted in feces by infected individuals, and ingested by others in the form of fecally-contaminated water or food. These pathogenic organisms include many types of bacteria, viruses, protozoa and helminths, which differ widely in size classification, structure and composition. Pathogenic organisms are highly infectious and disease-causing. They are responsible for many thousands of diseases and deaths each year (See Table 2-1 for waterborne disease outbreaks in United States1), especially in tropical regions with poor sanitation. In the following discussion, only the human pathogens potentially transmitted in drinking water are considered.
Table 2-1: Waterborne disease outbreaks in the United States, 1980 to
1996 (AWWA, 1999).
Disease Number of Cases of
Outbreaks Illness
Gastroenteritis, undefined 183 55,562
Giardiasis 84 10,262
Chemical poisoning 46 3,097
Shigellosis 19 3,864
Gastroenteritis, Norwalk virus 15 9,437
Campylobacteriosis 15 2,480 Hepatitis A 13 412 Cryptosporidiosis 10 419,939* Salmonellosis 5 1,845 Gastroenteritis, E. coli 0157:H7 3 278 Yersiniosis 2 103 Cholera 2 28 Gastroenteritis, rotavirus 1 1,761
U.S. statistics for outbreaks and specific waterborne diseases are given instead of developing world statistics
Chapter 2: WATERBORNE PATHOGENS AND DISEASES Typhoid fever 1 60 Gastroenteritis, Plesiomonas 1 60 Amoebiasis 1 4 Cyclosporiasis 1 21 TOTAL 402 509,213
*Includes 403,000 cases from a single outbreak of Cryptosporidiosis.
2.2 Significance of Pathogens in Drinking Water Supplies
According to WHO2 , not all potential waterborne human pathogens are of equal public health significance. Some of them present a serious risk of disease whenever they are consumed in drinking water and are given high priority for health significance. Examples include strains of
Escherichia coli, Salmonella, Shigella, Vibrio cholerae, Yersinia enterocolitica, and
Campylobacter jejuni. On the other hand, some organisms may cause disease
"opportunistically". These organisms cause infection mainly among people with impaired natural defense mechanisms. These people include the very old, the very young, immuno-compromised people, and patients in hospitals. Examples of these organisms include
Pseudomonas, Klebsiella, and Legionella (WHO, 1996).
For pathogens of fecal origin, drinking water is the main route of transmission. Unhygienic practices during the handling of food, utensils and clothing also play an important role. Humans are typically the main carriers of large populations of these bacteria, protozoa, and viruses (WHO, 1996). Pathogens originating from human sources, often from human feces, are called "enteric" (of intestinal origin) pathogens. An example is Ecoli 0157:H7. The intestine of many domestic and wild animals, their meat, milk and dairy products, are sources of the bacteria
Yersinia enterocolitica and Campylobacter (WHO, 1996). The persistence of a pathogen in
water also affects their transmission to humans. A more persistent pathogen that can survive longer outside the host body is more likely to be transmitted to other people. The infective dose (ID) of the pathogen determines the number of organisms needed to produce an infection in humans. The ID50 is the dose required to produce a clinically detectable infection in 50% of the
subjects (Refer to Table Al in Appendix A).
2 Throughout this thesis, the focus of which is developing countries generally and Nepal specifically, WHO
Guidelines will be given as the benchmark on international grounds for microbiological water quality. U.S. EPA standards are also provided for the purpose of comparison.
Chapter 2: WATERBORNE PATHOGENS AND DISEASES
There are many other causes of waterborne disease outbreaks. They include treatment deficiencies and the consumption of contaminated groundwater (Refer to Table 2-2 for some causes of waterborne outbreaks). Therefore, improvements in the quality and availability of water, sanitation facilities, and general hygiene education will all contribute to the reduction of morbidity and mortality rates due to waterborne diseases (Munasinghe, 1990).
Table 2-2: Causes of waterborne disease outbreaks in USA, 1981-1990 (Craun, 1992). Cause of Outbreak Community Non- Other
community
Untreated groundwater 15 43 19
Inadequate disinfection of 17 32
groundwater
Ingestion of contaminated water 41
while swimming
Inadequate disinfection of surface 35 9
water
Distribution deficiencies 30 3 3
Filtration deficiencies 16 1
Unknown 7 3 1
Untreated surface water 2 4
Miscellaneous 2 2 3
TOTAL 124 97 70
2.3 Four Main Classes of Pathogens
There are 4 main classes of pathogenic organisms bacteria, viruses, protozoa, and helminths.
related to waterborne diseases. They are
2.3.1 Bacteria (Prokaryotic)
Bacteria are single-celled prokaryotes (without nucleus) with sizes ranging from 0.3 to 100 micrometers ([tm) in length (Metcalf and Eddy, 1991). Many of these pathogenic bacteria belong to the family Enterobacteriaceae (See Figure 2-1 for a classification table created by the author of typical waterborne pathogens). They include the human pathogen, Salmonella typhi which is typically present in all kinds of food grown in fecally polluted environments. Another type of bacteria in this family, Yersinia enterocolitica (certain strains) causes acute gastroenteritis with diarrhea. Y enterocolitica are present in sewage and fecally contaminated surface water. A special feature of Y enterocolitica is their ability to grow even at low temperatures of 4"C. Therefore, these organisms can survive for long periods in water habitats (WHO, 1996). Shigella, also part of Enterobacteriaceae, causes dysentery in humans and is
Chapter 2: WATERBORNE PATHOGENS AND DISEASES
usually transmitted through direct contact. Other bacteria species of significance but not part of this family include the following: Vibrio cholerae, specifically the serogroup 01, causes cholera, an acute intestinal disease with massive diarrhea, vomiting, dehydration, possibly leading to death. Some other pathogenic bacteria include Campylobacter and opportunistic pathogens such
as Legionella pneumophila and Aeromonas (Refer to Tables Al and A2 in Appendix A).
Escherichia coli, which is commonly used to indicate fecal contamination, causes bacterial
infections of the intestines where the major symptom is diarrhea. It typically has a length of 3 pm and width of 1 pm. F coli are characterized by their ability to produce potent "enterotoxins". Enterotoxins are similar to hormones which act on the small intestine, causing massive secretion of fluids which lead to the symptoms of diarrhea (Madigan et al., 2000). For example, the F. coli 0157:H7 produces a potent enterotoxin that causes both hemorrhagic diarrhea and kidney failure. These diseases can cause death if untreated.
2.3.2 Viruses (Noncellular)
Unlike other pathogens, viruses are not cells. Viruses are minute particles containing nucleic acid surrounded by protein and other macromolecules. They lack many of the cell attributes such as metabolic abilities and reproduction pathways (Madigan et al., 2000). Viruses are smaller than bacteria, ranging in size from 0.02 to 0.3 pim. Viruses are known to infect virtually all cells. The pathogenic pathway starts with the attachment of the virion (a virus particle) to a host cell. The virion then penetrates and replicate within the cell, altering the host biosynthetic machinery with its own nucleic acid synthesis (Madigan et al., 2000).
Most pathogenic waterbome viruses are enteric viruses which multiply and infect the gastrointestinal tract of humans and animals before they are excreted in their feces. People infected with any of the enteric viruses, particularly the Hepatitis A virus, will become ill. Infectious hepatitis may cause diarrhea and jaundice and result in liver damage. Other disease-causing viruses include rotaviruses disease-causing gastroenteritis primarily in children, polioviruses causing polio, and adenoviruses causing acute gastroenteritis (Refer to Table Al and A2 in Appendix A). Waterborne transmission via the fecal-oral route has been demonstrated for Hepatitis A and E viruses, rotaviruses and Norwalk virus (AWWA, 1999).
Chian Siong Low
Last Revised: Mar 11, 2002 Waterborne Pathogens
BACTERIA Campylobacter jejuni/cofi/fetus Opportunistic bacteria Aeromonas spp./ hydrophila Legionella oneumonhila Escherichia coli n4 XZ7,-J7 Yersinia enterocolitica Pseudomonas aeruginosa __ Helicobacter pylon HELMINTHS Ascaris lumbricoides Enterobius vericularis Fasciola hepatica Hymenolepis nana T. solium - Taenia saginata - Trichuris trichiura PROTOZOA -Balantidium coli Cryptosporidium oarvum Entamoeba VIRUSES Adenovirus Enteroviruses Hepatitis A Norwalk agent Poliovirus Reovirus -Giardia lamblia L LRotavirus - Microsporidium References:
1. WHO (1993) Guidelines for drinking-water quality, 2nd ed., vol. 2.
2. HACH (2000) The Use of Indicator Organisms to Assess Public Water Safety.
3. Gleeson, C.; Gray, N. (1997) The Coliform Index and Waterborne Disease
4. Leclerc H.; Mossel, D.A.A.; Edberg, S.C.; Strujik, C.B. (2001) Advances in the
Bacteriology of the Coliform Group: Their Suitability as Markers of Microbial Water Safety 5. Szewzyk, U.; Szewzyk, R.; Manz, W.; Schleifer, K.-H. (2000) Microbiological Safety of
Chapter 2: WATERBORNE PATHOGENS AND DISEASES
2.3.3 Protozoan Parasites (Eukaryotic)
Protozoa are unicellular eukaryotic microorganisms that lack cell walls. Protozoa usually obtain their food by ingesting other organisms or organic particles (Madigan et al., 2000). Large numbers of protozoa can infect human by staying as parasites in the intestines of humans. The most common protozoal diseases are diarrhea and dysentery. Giardia lamblia causes an acute form of gastroenteritis. The cyst form is 8 to 12 pm long by 7 to 10 pm wide, and is infectious to people by the fecal-oral route of transmission. Their germination in the gastrointestinal tract brings about the symptoms of giardiasis: diarrhea, nausea, vomiting, and fatigue. These cysts can survive up to 77 days in water less than 1 00C and are highly resistant to chlorine disinfection, although they will be inactivated when subjected to temperatures of 540C and above for 5
minutes. Risk analysis, using a probabilistic model, suggests that if Giardia lamblia can be reduced to 0.7 to 70 cysts per 100 liters of drinking water, the annual risk of infection will be less than one per 10,000 population (AWWA, 1999).
Another important protozoan, the Cryptosporidium species, also causes diarrhea. Specifically, C. parvum is the major species causing the disease. Human beings are the reservoir for these infectious protozoans and one infected human can excrete 10 9 oocysts a day. C. parvum oocysts are 4 to 6 p.m in size and spherical in shape. Similar to Giardia cysts, C. parvum oocysts can survive for several months in water at 4'C and are highly resistant to chlorine. C. parvum also has a low infective dose. The disease was produced in two primates when they were given a dose of only 10 oocysts (Miller et al., 1990).
2.3.4 Helminths (Eukaryotic)
Helminths are intestinal worms that do not multiply in the human host. For example, hookworms live in the soil and can infect humans by penetrating their skin. With a heavy worm infection, the symptoms are anaemia, digestive disorder and abdominal pain. The guinea worm measures 0.5 to 25 millimeters (mm) in length, and their eggs are usually transmitted through contaminated drinking water supplies in rural areas (AWWA, 1999). These worms cause a condition called "dracunculiasis" and the worms emerge from blisters in a few weeks. Normally, the wound heals rapidly without treatment. Sometimes, the wound may become infected and
Chapter 2: WATERBORNE PATHOGENS AND DISEASES
2.4 Indicator Organisms of Drinking Water
The probability that a person will be infected by a pathogen cannot be deduced from the pathogen concentration alone. This is because different humans respond differently to the pathogens. As a result, there is no real lower limit for acceptable levels of pathogens in water. Instead, it follows that "safe" drinking water intended for human consumption should contain none of these pathogens.
To determine if a given water supply is safe, the source needs to be protected and monitored regularly. There are two broad approaches to water quality monitoring for pathogen detection. The first approach is direct detection of the pathogen itself, for example, the protozoan
Cryptosporidium parvum. While it will be more accurate and precise if specific disease-causing
pathogens are detected directly for the determination of water quality, there are several problems with this approach. First, it would be practically impossible to test for each of the wide variety of pathogens that may be present in polluted water. Second, even though most of these pathogens can now be directly detected, the methods are often difficult, relatively expensive, and time-consuming (WHO, 1996). Instead, water monitoring for microbiological quality is primarily based on a second approach, which is to test for "indicator organisms" (See Figure 2-2 for a classification table created by the author of typical indicator organisms). The indicator organism should fulfill the following criteria (Stetler, 1994):
1) An indicator should always be present when pathogens are present;
2) Indicators and pathogens should have similar persistence and growth characteristics; 3) Indicators and pathogens should occur in a constant ratio so that counts of the indicators
give a good estimate of the numbers of pathogens present;
4) Indicator concentrations should far exceed pathogen concentration at the source of pollution;
5) The indicator should not be pathogenic and should be easy to quantify; 6) Tests for the indicator should be applicable to all types of water;
7) The test should detect only the indicator organisms thus not giving false-positive reactions.
Chian Siong Low
Last Revised: Mar 11, 2002
Bacterial Indicators Total Coliform (Escherichia) (Citrobacter) (Klebsiella) (Enterobacter)
1. Indicators in Bold represent of
confirmed fecal origin.
2. Indicators in Bold and () represent some species are of fecal origin.
Also referred to sulfite-reducing
clostridia (WHO, 1993)
Note: Because the definition of these indicator organisms are based on operational and not taxonomic bases, some other organism that fulfill the WHO definitions will also give a positive result with the corresponding indicator tests. Thermotolerant coliform Escherichia coli Citrobacter freundii Klebsiella -Kiebsiella pneumoniae Enterobacter cloacae
Total Coliform E.coli
P/A: P/A Broth with MUG (E.coli) P/A: P/A Broth with MUG
MPN: Lauryl Tryptose (LT) with MUG (E.coli)/ MPN: LT with MUG/ EC with MUG
Lactose Broth/ Brilliant Green Bile Broth/ MF: m-TEC Agar/ m-ColiBlue 24/ Nutrient Agar MF: m-Endo Broth/ m-ColiBlue 24/ LT Broth/ with MUG/ EC with MUG
Brilliant Green Bile Broth H2S producing bacteria
Fecal Coliform "Salmonella, Citrobacter, Proteus, Edwardsiella,
P/A: See H2S bacteria some species of Klebsiella"
MPN: EC/ A-1 Broth P/A: PathoScreen Medium
MF: EC/ m-FC Broth/ m-FC with Rosolic Acid gold = USEPA approved
nderline = Confirmed Test, o.w. Presumptive
E.coli H2S producing bacteria Fecal streptococci Citrobacter freundii (Salmonella typhimurium) Proteus mirabilis/ vulgaris Arizona species (Kiebsiella species) Edwardsiella species Clostridium References: perfringens
1. WHO (1993) Guidelines for drinking-water quality, 2nd ed., vol. 2.
2. HACH (2000) The Use of Indicator Organisms to Assess Public Water Safety. 3. Gleeson, C.; Gray, N. (1997) The Coliform Index and Waterbome Disease.
4. Leclerc H.; Mossel, D.A.A.; Edberg, S.C.; Strujik, C.B. (2001) Advances in the Bacteriology of the Coliform Group: Their Suitability as Markers of Microbial Water Safety.
5. Szewzyk, U.; Szewzyk, R.; Manz, W.; Schleifer, K.-H. (2000) Microbiological Safety of Drinking Water.
6. Pillai, J.; Mathew, K.; Gibbs, R.; Ho, G.E. (1999) H2S Paper Strip Method - A
Bacteriological Test for Faecal Coliforms in Drinking Water at various temperatures. 7. Gawthorne, T.; Gibbs, R.A.; Mathew, K.; Ho, G.E. (1996) H2S papers as
presumptive tests for Salmonella contamination in tropical drinking water. 8. Rijal, G.; Fujioka, R. (1995) A Homeowners Test for Bacteria in Cistern Waters.
9. Kromoredjo, P.; Fujioka, R.S. (1991) Evaluating Three Simple Methods to
Assess the Microbial Quality of Drinking Water in Indonesia.
10. Manja, K.S.; Maurya, M.S.; Rao, K.M. (1982) Simple field test for the detection
of faecal pollution in drinking water.
11. Grant, MA.; Ziel, C.A. (1996) Evaluation of a simple screening test for faecal
pollution in water.
24
WHO definitions
Coliform: Gram-negative, rod-shaped bacteria, capable of growth in the presence of bile salts or other surface-active agents with similar growth-inhibiting properties, and able to ferment lactose at 35-37 deg C with the production of acid, gas, and aldehyde within 24-48 hours. They are also oxidase-negative, non-spore forming, and display beta-galactosidase activity.
Thermotolerant coliform: Coliforms able to ferment lactose at 44-45 deg C.
E.coli: Thermotolerant coliforms with indole production and beta-glucuronidase activity, and absence of
Chapter 2: WATERBORNE PATHOGENS AND DISEASES
Another reason for using simple indicator tests is that pollution is often intermittent and/or undetectable. It is often better to monitor drinking water frequently by means of a simple test than to monitor infrequently using a longer and more complicated direct pathogen detection test.
While these indicator bacteria or viruses are not necessarily pathogenic themselves, some of them have the same fecal source as the pathogenic bacteria and can therefore indicate fecal contamination of water (WHO, 1993a). One example which fulfils many of the above criteria is the indicator organism E. coli. Therefore, it may be sufficient to get an indication of the presence of pathogens of fecal origin with the detection and enumeration of E. coli. Such a substitution is especially valuable when resources for microbiological examination are limited as in Nepal or other developing countries.
2.4.1 Coliform Organisms (Total Coliform)
"Coliform bacteria" are metabolically defined as gram-negative, rod-shaped bacteria capable of growth in the presence of bile salts and able to ferment lactose at an optimum 35"C, with the production of acid, gas, and aldehyde within 24 to 48hours (WHO, 1993). They are also oxidase-negative, non-spore-forming and display
P-galactosidase
activity. In U.S., coliform bacteria have been recognized by the EPA Safe Drinking Water Act since 1989 as a suitable microbial indicator of drinking water quality (USEPA, 2001). The main reason is because they are easy to detect and enumerate in water and are representative enough for determining microbial contamination of drinking water. However, for developing countries in tropical climates, WHO states that,Total coliform bacteria are not acceptable indicators of the sanitary quality of rural water supplies, particularly in tropical areas.... It is recognized that, in the great majority of rural water supplies in developing countries, fecal
contamination is widespread (WHO, 1996).
Therefore, the use of Total Coliform (TC) as a microbiological indicator of water quality in developing countries is not appropriate. A better indicator of recent fecal contamination is required (See Chapter 3.3 for a more in-depth discussion).
Chapter 2: WATERBORNE PATHOGENS AND DISEASES
Coliform bacteria traditionally include the genera Escherichia, Citrobacter, Enterobacter and
Klebsiella. Modem taxonomical methods also include lactose-fermenting bacteria, such as Enterobacter cloacae and Citrobacter freundii, which can be found in both feces and the
environment (WHO, 1993a). The inclusion of both non-fecal bacteria and lactose-fermenting bacteria limits the applicability of this group as an indicator of fecal contamination or pathogens in drinking water. However, the coliform test is still useful for monitoring the microbial quality of treated pipe water supplies despite its lack of specificity to fecal contamination (Gleeson & Glay, 1997). If in doubt, especially when coliform organisms are detected in the absence of thermotolerant coliform and F coli, further analysis for other indicator organisms should be undertaken to determine if fecal contamination is present. For total coliform (TC), an incubating temperature of 35*C for 24 hours is used during bacteria culture. Under the WHO Guidelines, no samples are allowed to contain any coliform per 100 milliliters (ml) of treated water sample in the distribution sample. For large water supplies, coliforms must not be present in 95% of samples taken throughout any 12-month period. Under the Total Coliform Rule by EPA, a violation is triggered if 1 sample tests coliform-positive in a system collecting fewer than 40 samples per month. If more than 40 samples are collected per month, not more than 5% of all samples can test positive.
2.4.2 Thermotolerant Coliform Bacteria
This group of bacteria comprises the bacteria genus Escherichia, and to a lesser extent,
Klebsiella, Enterobacter, and Citrobacter. They are defined as a group of coliform organisms
that are able to ferment lactose at 44 to 45'C. Sometimes, this group is also called Fecal Coliform (FC) to specify coliforms of fecal origin. This is not appropriate since thermotolerant coliforms other than fecal coliforms may also originate from organically enriched water such as industrial effluents, from decaying plant materials and soils, or on vegetation in a tropical rainforest (WHO, 1996). Of these organisms, only E coli is specifically of fecal origin. However, concentrations of thermotolerant coliforms are usually directly related to that of F coli and thus can be used as a surrogate test for F coli. When a sample is tests positive for thermotolerant coliforms, it is usually subjected to further confirmed tests for F coli. Positive results for both indicators are a strong indication of recent fecal contamination (WHO, 1996). Since thermotolerant coliforms can be readily detected by simple, single-step methods, it often
Chapter 2: WATERBORNE PATHOGENS AND DISEASES
plays an important secondary role as an indicator of the efficiency of individual water-treatment processes in removing fecal bacteria (WHO, 1996). The WHO Drinking Water Guidelines state that zero thermotolerant coliform or E. coi may be found per 100 ml of drinking sample. This
group of indicator organisms is currently not listed in the EPA drinking water standards.
2.4.3 Escherichia coli (E.coli)
Escherichia coli is a specific subset of the thermotolerant coliform bacteria which possess the
enzymes
p-galactosidase
andP-glucuronidase
that hydrolyzes 4-methyl-umbelliferyl-p-D-glucuronide (MUG). They are found abundantly in human feces (as much as 10 9 per gram (g) of fresh feces) and warm-blooded animals. Ninety-five percent of all coliform found in human feces can be F coli (Waite, 1985). Sewage, treated effluents, all natural water and soils that are subject to recent fecal contamination from humans or wild animals will contain K coli. Usually,E coli cannot multiply in any natural water environment and they are, therefore, used as specific
indicators for fecal contamination (WHO, 1996) (See Chapter 3.4 for a counter argument). Therefore, while the presence of both thermotolerant coliforms and E co/i is not able to distinguish between human and animal contamination, nonetheless, they are better indicators than TC for the presence of recent fecal contamination. Both WHO Guidelines and EPA standards require zero E. coli to be found per 100 ml of drinking water sample.
2.4.4 Fecal Streptococci
Most of the species under the genus Streptococcus are of fecal origin and can be generally regarded as specific indicators of human fecal pollution (WHO, 1993a). However, certain species may be isolated from the feces of animals. Fecal streptococci seldom multiply in polluted water and they are more persistent than coliform and F coli bacteria. Therefore, they are generally useful as additional indicators of treatment efficiency (WHO, 1996). This indicator organism is commonly tested with E coli for evidence of recent fecal contamination.
2.4.5 Sulfite-Reducing Clostridia
Sulfite-reducing clostridia are gram-positive, anaerobic, spore-forming bacteria. Clostridial spores can resist treatment and disinfection processes better than most pathogens, including
Chapter 2: WATERBORNE PATHOGENS AND DISEASES
viruses. One of the members, Clostridium perfringens, like F coli, is normally present in feces, but in much smaller numbers. However, they are not exclusively of fecal origin and can be found in other environmental sources (WHO, 1996). Clostridial spores can survive in water much longer and resist disinfection better than other coliform groups (AWWA, 1999). However, they are not recommended for routine monitoring of distribution systems because they tend to accumulate and are detected long after pollution has occurred, thus giving rise to false alarms.
2.4.6 Hydrogen Sulfide-Producing Bacteria
Another related group of bacteria called the hydrogen-sulfide producing bacteria include
Citrobacter freundii, Salmonella typhimurium, Proteus vulgaris, strains of Klebsiella (Manja et
al., 1982; Grant and Ziel, 1996), genuses Edwardsiella and Arizona (Madigan et al., 2000). A common sulfate-reducing (to hydrogen sulfide) anaerobic bacteria, Desulfovibrio, is commonly found in aquatic habitat containing abundant organic material and sufficient levels of sulfate (Madigan et al., 2000). Together with the previous genre, these bacteria have since at least 1980s (Manja et al., 1982) been isolated and detected using Presence/Absence (P/A) and Most Probable Number (MPN) tests. The significance of testing for this group of bacteria is because of their strong fecal origin correlation to FC (Manja et al., 1982; Grant and Ziel, 1996).
2.4.7 Bacteriophages
Bacteriophages (phages) are viruses that infect and replicate in specific bacteria. The ability to identify phages (coliphages) of E coli, also detects fecal contamination. This is because the presence of coliphages also indicates the presence of E coli. The significance of coliphages as indicators of sewage contamination, and their greater persistence compared to bacterial indicators make them useful as additional indicators of treatment efficiency. A current method of coliphage detection is through the culture of F coli in a Tryptic Soy Agar (TSA) medium (Stetler, 1994).