Time-dependent Moisture Distribution in Drying Cement Mortars –
Results of Neutron Radiography and Inverse Analysis of Drying Tests
B. Villmann1, V. Slowik1*, F. H. Wittmann2, P. Vontobel3 and J. Hovind3
1Leipzig University of Applied Sciences, Karl-Liebknecht-Str. 132, 04277 Leipzig, Germany 2Aedificat Institute Freiburg, Schlierbergstr. 80, 79100 Freiburg, Germany
3Spallation Neutron Source Division ASQ, Paul Scherrer Institut, 5232 Villigen PSI, Switzerland *Corresponding author: V. Slowik, e-mail: [email protected]
Abstract
The moisture transport properties of cementitious materials may be determined by inverse analysis of easy-to-perform drying experiments. A corresponding method is proposed. It requires the measurement of the time-dependent mass loss of drying samples, includes the numerical simulation of drying, and utilizes an evolutionary optimization algorithm for identifying the moisture transport parameters. By this method, inverse analyses of drying experiments with mortar samples have been carried out whereby different physi-cal models for the moisture transport were applied. Neutron radiographic investigations served for validating the results. The radiographically measured moisture distributions in drying samples were compared to those obtained on the basis of inverse analyses of drying experiments. It was found that different transport models which consider both vapor and liquid water transport yield almost the same results. The latter were also in good agreement with the neutron radiographic observations.
1
Introduction
The correct modeling of moisture transport in build-ing materials is an essential prerequisite for realistic analyses in the field of building physics. In addition, transport properties are required for simulating shrinkage induced damage processes and, conse-quently, for evaluating the durability of structures. This results from the causality of the time-depend-ent moisture distribution in the structures during drying and rewetting, of the local shrinkage defor-mation, of the build-up of stresses under constraint, and eventually of cracking processes.
Moisture transport in porous materials is a complex process which incorporates multiple physical phe-nomena. Besides the vapor transport, different types of liquid transport with their respective trans-port potentials are occurring. The transtrans-port mecha-nisms depend on the structure of the material, espe-cially on the pore system, and are influenced by the state of the material, as are temperature and water saturation level.
A first modeling approach based on non-linear dif-fusion theory was the characterization of the ture transport by Fick’s law with a single mois-ture-dependent transport coefficient [1]. For pure vapor diffusion, this approach would be exact. Oth-erwise, the single transport coefficient captures in a simplifying way all relevant transport mechanisms. For many practical purposes, however, this mode-ling strategy has proved to be applicable. Kießl [2] suggested to consider vapor and liquid transport separately as different transport phenomena. Krus [3] enhanced this approach and confirmed the associated model by experiments. Other authors also based their models on two major transport mechanisms, vapor and liquid transport, whereby different formulations were proposed [4-7]. All transport models are based on transport coefficients which are normally considered to be mois-ture-dependent. This moisture dependence is described by functions with parameters being tem-perature-dependent material properties. Neither these parameters nor the moisture distribution in specimens can directly be measured with conven-tional experimental methods.
In the present paper, an indirect method is proposed which allows determining the moisture-dependent transport coefficients by inverse analysis of easy-to-perform isothermal drying experiments [8]. For checking the validity of the method, different approaches for the description of moisture transport were used. The respective analysis results are subject
to a variety of influences which can potentially lead to errors. These influences include simplifications of the physical moisture transport model, the experi-mental determination of the input data for the numerical analysis (mass loss curve, desorption iso-therm, dry density), and the accuracy of the numeri-cal algorithm. The influence of individual input parameters may easily be quantified in test analyses. It appears to be difficult, however, to evaluate the effects of the different sources of error in their entirety on the final result of the inverse analysis. In order to draw conclusions concerning the appli-cability of the different transport models and to val-idate the inverse analysis approach, experimental investigations into the moisture transport in cement mortars were carried out by means of neutron radi-ography. This method allows a direct imaging of the local moisture content due to the hydro-gen-dependent attenuation of neutrons in the exam-ined material. Starting from the saturated state, neu-tron radiographic images were acquired in defined intervals during the drying of samples made of three cement mortars and the corresponding mois-ture profiles were calculated. The latter could be compared with those obtained by inverse analysis of drying tests performed in parallel.
2
Determination of Moisture
Trans-port Parameters and Moisture Profiles
by Inverse Analysis
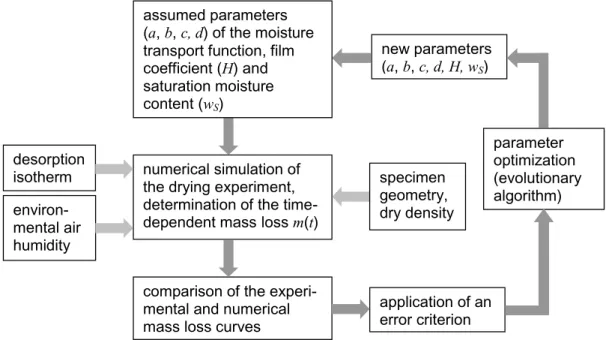
By means of inverse analysis, it is possible to determine the moisture-dependent transport coeffi-cients on the basis of the time-dependent mass loss of drying samples. Inverse analysis means that starting from an assumed set of parameters (mate-rial properties) the experiment is numerically sim-ulated and the obtained results are then compared to the experimental ones. In order to quantify the deviation, a suitably formulated error measure needs to be calculated. Then, the parameters are modified according to an optimization routine and the experiment is simulated again. This loop is repeated until an acceptable agreement between model and experiment is achieved [9]; see Fig. 1. The parameters identified in this way are then regarded as the actual material properties. The sim-ulation of the experiment includes the numerical solution of the one-dimensional transport equation (partial differential equation) for calculating the moisture profile and the time-dependent mass loss of the sample. Besides pure vapor diffusion, eq. (1), different approaches which include also liquid transport, eq. (2), were compared.
(1)
(2)
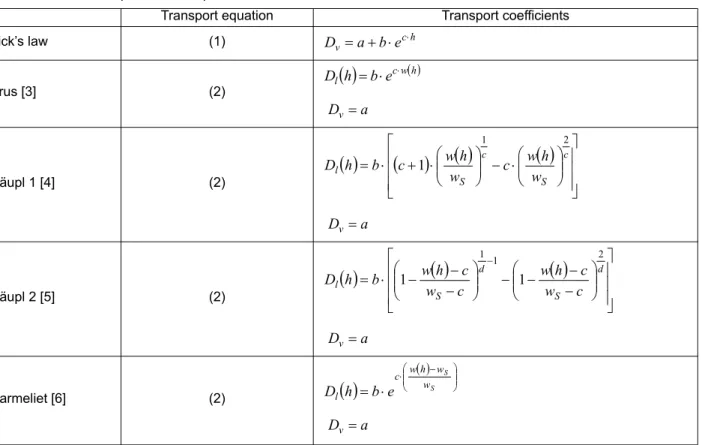
The different formulations for the mois-ture-dependent transport coefficients considered here are listed in Table 1.
For modeling the transition at the specimen surface, a film coefficient according to eq. (3) has been used.
(3)
H, … film coefficient in g/ (m² h) or g/ (m² h Pa) hSe, pSe … relative air humidity or vapor pressure
at the surface
he, pe … environmental relative air humidity or vapor pressure
In addition to the parameters a, b, c and d, see Table 1, the inverse analysis yields the film coeffi-cient H, and in some cases also the saturation mois-ture content wS. The two last-mentioned parameters may hardly be determined by experimental means with sufficient accuracy.
For the optimization, an evolutionary algorithm has proved to be suitable [10]. When compared to other optimization techniques, the main advantage of the chosen method is its robustness with respect to local minima of the error function. This may be attributed to the stochastic nature of the method and ensures a high degree of objectivity. Another advantage is the separation of the analysis model from the evaluation of its results. Therefore, the physical model can be modified or extended with-out influencing the optimization algorithm.
The formulation of a suitable error measure is essential for the accuracy of the inverse analysis results. Because of the strongly varying slope of the mass loss curves to be fitted during the parameter optimization, an error measure based on the mean perpendicular deviation of the simulated curve from the experimental one has been used [11].
3
Determination of Moisture Profiles
by Neutron Radiography
Neutrons are attenuated by hydrogen. This effect can be utilized for determining the moisture con-tent of materials [12]. Moisture leads to a reduction of the transmittance of the material when exposed to neutrons. For the experiments reported here, the beamline NEUTRA of the neutron source SINQ at the Paul Scherrer Institute in Villigen/Switzerland was used. The neutron beam originating from the source is passing a collimator and hits the sample. Figure 1: Schematic representation of the inverse analysis method.
numerical simulation of the drying experiment, determination of the time-dependent mass loss m(t)
comparison of the experi-mental and numerical mass loss curves
application of an error criterion parameter optimization (evolutionary algorithm) new parameters (a, b, c, d, H, wS) desorption isotherm environ-mental air humidity specimen geometry, dry density assumed parameters
(a, b, c, d) of the moisture transport function, film coefficient (H) and saturation moisture content (wS)
( )
∂ ∂ ∂ ∂ = ∂ ∂ x h h D x t h v( )
∂ ∂ + ∂ ∂ ∂ ∂ ⋅ ∂ ∂ = ∂ ∂ ∂ ∂ x h D x h h w h D x t h h w v l B B ρ ρ( )
(
Se e)
(
Se e)
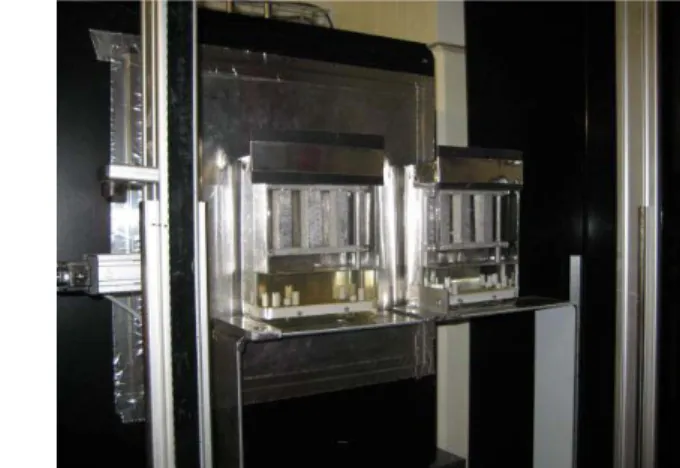
Se p p H h h H x h h D = ⋅ − = ⋅ − ∂ ∂ ~ H~Depending on the material properties, on the thick-ness of the sample, and on the moisture content the beam will be attenuated when passing the sample. The residual radiation is measured by a detector (neutron-sensitive scintillator and CCD camera) and a gray-scale image is obtained which contains the information on the local moisture content within the sample. During the whole drying period, the samples were stored in a closed glass container above saline or glycerol solutions in order to ensure constant air humidity; see Fig. 2 a. When exposed to the neutron beam, the samples were still in their glass containers; see Fig. 2 b. The measured transmittance results therefore from the transmittances of the moisture, of the dry sample, and of the glass container:
(4)
The transmittances of the dry material and of the empty glass container may be determined by sepa-rate measurements. Assuming an exponential decay of the transmittance with the layer thickness, the effective thickness tw of the water layer which corresponds to the moisture content may be deter-mined by eqs. (5) and (6):
(5)
with
(6)
… interaction probability with neutrons … material density
L … Avogadro constant M … atomic weight Table 1: Moisture dependent transport coefficients.
Transport equation Transport coefficients
Fick’s law (1) Krus [3] (2) Häupl 1 [4] (2) Häupl 2 [5] (2) Carmeliet [6] (2)
w … moisture content by mass %/100
wS … saturation moisture content by mass %/100 h … relative air humidity
… vapor diffusion coefficient … liquid transport coefficient ρB … dry density
a, b, c, d … parameters to be determined by inverse analysis h c v a b e D = + ⋅ ⋅
( )
cw( )h l h b e D = ⋅ ⋅ a Dv=( )
(
)
( )
( )
⋅ − ⋅ + ⋅ = c S c S l w h w c w h w c b h D 2 1 1 a Dv=( )
( )
( )
− − − − − − − ⋅ = − d S d S l c w c h w c w c h w b h D 2 1 1 1 1 a Dv=( )
⋅ ( )− ⋅ = S S w w h w c l h b e D a Dv=( )
h Dv( )
h Dl glass dry w T T T T= ⋅ ⋅ w w w T t = ln− Σ 1 626 . 3 − ≈ ⋅ ⋅ = Σ cm M L w ρ σ σ ρThe moisture content w of the sample can then be cal-culated according to eq. (7) on the basis of the dry density ρdry and of the sample’s thickness tdry:
(7)
Since other effects besides the absorption, in partic-ular the scattering of the neutrons by hydrogen, are also influencing the measured neutron intensity in an area detector, the determination of transmit-tances requires a number of corrections [13]. Espe-cially the correction for the detector background scattering has proved to be difficult and may be a source of uncertainties.
It has to be pointed out that the neutron radio-graphic images contain predominantly information on the liquid phase of the pore humidity. This is due to the negligible mass of the water vapor inside of the pore system. A similar effect occurs when the moisture content is determined by weighing. There-fore, the moisture distributions resulting from the neutron radiography and from the mass loss meas-urements are comparable. Whereas for the moisture storage in the material the gaseous phase is almost insignificant, it appears to be important for the moisture transport.
4
Materials
Three mortars with different water/cement ratio (w/c) were used as test materials. In order to ensure the stability and workability of the fresh material, a superplasticizer has been added to the mortar with the lowest w/c ratio and an underwater compound to the one with the highest w/c ratio. The material compositions are listed in Table 2.
The samples had a prismatic shape with the dimen-sions 2x2x8 cm³. In the age of 24 hours, the sam-ples were unmolded and then stored under water for 28 days. Subsequently, the samples were precondi-tioned in multiple cycles of drying and rewetting. In order to avoid surface effects, all faces of the sam-ples were polished. After that, the dry density was determined.
For the determination of the mass loss curves, the samples were sealed on four sides with aluminum foil in order to enforce one-dimensional moisture transport. After another rewetting in a water bath, the samples were stored for more than four weeks in a closed container above a water surface. Then, the saturation moisture content of the samples was determined.
Some of the samples were subsequently stored for about five months above different saline solutions in desiccators in order to determine the desorption isotherms. The latter are shown in Fig. 3.
Figure 2 a and b: Three samples prepared for neutron radiography.
dry dry w w t t w ρ ρ ⋅ ⋅ =
Table 2: Material composition and density of the samples.
Sample w/c ratio Cement Water Sand plasticizer Super- Underwater compound Dry density [g/cm³]
M04 0.4 450 g 180 g 1350 g 9 g - 2.170±0.003
M05 0.5 450 g 225 g 1350 g - - 2.112±0.006
The samples used for the determination of the mois-ture profiles by means of inverse analysis or neutron radiography, respectively, were also placed in glass containers, initially above pure water. At the begin-ning of the measurements, the water was replaced by a solution of potassium acetate or glycerol, respec-tively, in order to maintain a certain relative air humidity in the respective container. Another set of samples was dried in a climate chamber at 23 °C and 35 % relative humidity in order to estimate the influ-ence of the film coefficient. All samples were stored under nearly isothermal conditions at an average temperature of 22 °C ± 3 K. During the neutron radi-ographic measurements, however, the temperature was significantly higher.
5
Results of the Neutron Radiography
The measurement system used for the neutron radiographic investigations provides an almost parallel neutron beam having a diameter of about 40 cm. During the measurement, the samples were stored in two closed glass containers with different air humidity; see Figs. 2 a and 2 b. The size of the measurement range used for the evaluation was about 12 cm in the horizontal direction and about 9 cm in the vertical direction. Within a first meas-urement period of 2.6 days, the glass containers remained on a movable table within the measure-ment system and were after predefined time inter-vals alternately exposed to the neutron beam. After this period, the glass containers had to be removed in order to allow for other experiments and modifi-cations at the measurement system. For the repeated measurements after 7, 17 and 29 days,respectively, the measurement system has been set back to its initial state and the glass containers were arranged in the same place.
The program ImageJ served for the determination of the moisture profiles on the basis of the acquired digitized gray-scale images after corrections with the program QNI [13].
After the drying experiments, the samples were exposed to 105 °C and slight underpressure for about 18 hours in order to determine the transmit-tance Tdry of the dry material. Since the samples had still not reached a negligible moisture content, the transmittance of the dry samples was deter-mined from the measured remaining water mass mw by manual iterations using eq. (8).
(8)
where x is the normal distance from the surface sub-jected to drying and A the transport area.
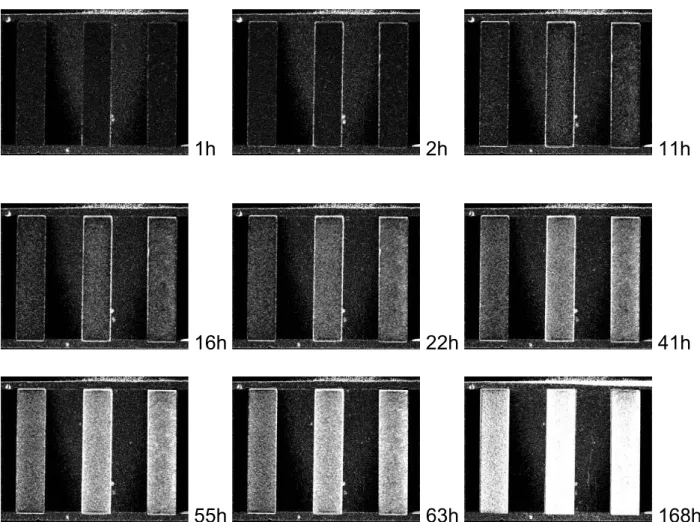
On the basis of the corrected neutron radiographic results, difference images with respect to the satu-rated initial state were calculated. Since the results for the samples being stored above pure water may hardly be compared to the other results, probably due to the strong neutron scattering, the first meas-urement taken after the saline or glycerol solution has been inserted in the glass container served as reference for the respective difference image. This measurement was taken 0.17 h after the beginning of the drying experiment. The results are shown in Fig. 4. For visualizing the effects to be discussed Figure 3: Desorption isotherms of the tested materials.
0 2 4 6 8 10 20 30 40 50 60 70 80 90 100 Relative humidity [%]
Moisture content by mass [%]
M04 w/c = 0.4 M05 w/c = 0.5 M06 w/c = 0.6
( )
dx T T T t A dx x w A m dry glass dry w w dry w ∫ ∫ ⋅ ⋅ ⋅ Σ ⋅ − = ⋅ ⋅ =ρ ρ lnhere, the gray-scale values were multiplied by a factor of 5. The lighter the shade, the lower the local moisture content has been. The progress of the dry-ing process is clearly visible, whereby in the core of the sample a moisture gradient may hardly be rec-ognized. In each of the nine images, the mortar sample with the w/c ratio of 0.4 is shown on the left, the one with the w/c ratio of 0.6 in the middle, and the one with the w/c ratio of 0.5 on the right. In the transmittance profiles obtained from the gray-scale images, the transition from sample to air, i.e., to the pure glass container, appears to be smeared due to neutron scattering and, possibly, also due to a slight rotation of the samples with respect to the direction of the neutron beam. There-fore, the samples appear as too narrow and the boundary region of the images may hardly be eval-uated. The moisture profiles obtained from the transmittance profiles for an environmental relative humidity of 30 % are shown in Fig. 10.
6
Results of the Inverse Analysis
6.1 Approximation of the Mass Loss CurvesParallel to the neutron radiographic investigations, additional samples with the same dimensions and made out of the same materials were subjected to drying under comparable climatic conditions in desiccators at 30 % and 60 % relative humidity, respectively, as well as in a drying cabinet at 35 %. In order to determine the weight loss curves, the samples were periodically taken out of the desicca-tors or out of the drying cabinet, respectively, for weighing. For the samples stored in the desicca-tors, it took some time until the state of equilib-rium was reached. This may be attributed to the strong moisture entry into the comparatively small containers. Fig. 5 shows the environmental relative humidity versus time for the desiccator with the potassium acetate solution (30 % relative humid-ity). For the inverse analyses, the actual humidity values were taken into account as hygral boundary condition.
Figure 4: Difference images of three cement mortar samples after different drying periods.
1h
2h
11h
16h
22h
41h
The parameters of the moisture transport coefficients were optimized in the inverse analyses in order to fit the calculated mass loss curve to the experimental one. For nearly all transport models and tested mate-rials a good agreement could be achieved. Fig. 6 shows as an example the approximations achieved with the transport model by Krus [3] for an environ-mental relative humidity of 30 %. The deviations between the curves for the three materials are mainly due to the different moisture storage capacity. The different transport properties lead primarily to differ-ent slopes of the mass loss curves when the latter are scaled to a common equilibrium value. Thereby, only small differences may be seen between the curves for the different materials.
Especially in the beginning of the mass loss curve, a small measurement error or a small deviation of the approximated curve from the measured values may have a significant influence on the moisture transport function to be determined. Therefore, reli-able inverse analysis results may only be obtained if sufficiently accurate experimental results are available and if the optimization method allows for a nearly perfect approximation.
6.2 Comparison of the Results for Dif-ferent Moisture Transport Models
The results of the experiments with the material M05 (w/c=0.5) in the desiccator at a relative humidity of 30 % were used for a comparison of the different moisture transport models. Since the model parameters are determined from the mass Figure 5: Environmental relative air humidity above a potassium acetate solution.
Figure 6: Mass loss curves obtained by weighing (dots) and by inverse analysis (solid lines), respectively.
RH=30% -5 -4.5 -4 -3.5 -3 -2.5 -2 -1.5 -1 -0.5 0 0 400 800 1200 1600 2000 Time [h] Mass loss [g] M04 w/c=0.4 M05 w/c=0.5 M06 w/c=0.6
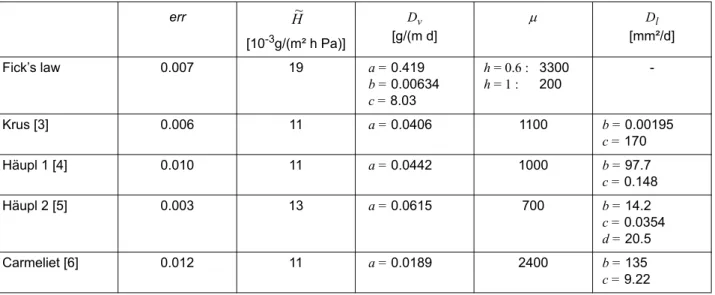
loss curves, i.e., from the integral moisture content, different moisture transport models may lead to different transport functions and to different mois-ture distributions. For all models listed in Table 1, the parameters of the transport function as well as the film coefficients were determined by inverse analysis. The approximation error err, the obtained values of the film coefficient , of the vapor diffu-sion coefficient Dv, of the resulting vapor diffu-sion resistance factor µ, and the parameters of the liquid transport coefficient Dl are given in Table 3. Fig. 7 shows the resulting total transport coeffi-cients as a function of the relative humidity. Due to the stochastic nature of the optimization method, the approximation error err is subject to variations in repeated analyses. The values listed in Table 3 may be considered as optimum for several analy-ses. Due to the formulation of the error measure [11], the value of err may hardly be interpreted in a direct way. For the different transport models applied to the same experimental results, however, the error measure err allows to compare the quality of the approximation. It turned out that for all models nearly the same approximation error could be achieved. The film coefficients obtained for the different transport models were also in the same order of magnitude, whereby the value obtained under the assumption of Fick's law was slightly higher than those obtained with the other transport models. For the models with transport eq. (2), see Table 1, comparatively high values of the vapor diffusion resistance factor were obtained in the humidity range from 100 % to 30 %. Still, for achieving a good approximation the vapor diffu-sion seems not to be negligible in the numerical analyses. The values of the vapor diffusion coeffi-cient appear as inversely correlated with those of
the transport coefficients for the liquid water trans-port. The lower the liquid transport coefficient in the low-humidity range, the higher is the corre-sponding extent of the vapor transport.
The diffusion functions are presented in Fig. 7. Up to a relative humidity of 90 %, the curves for the transport coefficients exhibit a similar shape. The values differ, however, for moisture contents close to the saturation level. If only vapor diffusion is considered, the values are comparatively small. The model by Krus [3] yields slightly higher values than the other transport models. Fig. 8 shows the calculated moisture profiles for certain points in time. Within the first two days, the curves fan out in the center of the sample. The moisture profile according to Fick's law shows a stronger curvature in the center when compared to the other profiles. This observation seems to contradict the results of the neutron radiography. The fastest decrease of the moisture content within the first days resulting from the highest values of the moisture transport function in the high-humidity range was obtained with the model by Krus [3], which is based on a simple exponential ansatz. This model seems to yield in the aforementioned time period a slightly better agreement with the moisture profiles obtained by neutron radiography than the other models. However, the moisture loss during the first days as determined by neutron radiography is still stronger than the one obtained with the different moisture transport models. After one week of dry-ing, the moisture profiles are basically the same for all transport models. Only in the boundary area a small deviation of the moisture profile according to Fick's law is observed. After about 30 days, how-ever, this deviation has also become negligible.
and parameters of the liquid transport coefficients for material M05 (w/c=0.5) and different moisture transport models. err [10-3g/(m² h Pa)] Dv [g/(m d] µ Dl [mm²/d] Fick’s law 0.007 19 a = 0.419 b = 0.00634 c = 8.03 h = 0.6 : 3300 h = 1 : 200 -Krus [3] 0.006 11 a = 0.0406 1100 b = 0.00195 c = 170 Häupl 1 [4] 0.010 11 a = 0.0442 1000 b = 97.7 c = 0.148 Häupl 2 [5] 0.003 13 a = 0.0615 700 b = 14.2 c = 0.0354 d = 20.5 Carmeliet [6] 0.012 11 a = 0.0189 2400 b = 135 c = 9.22 H~ H~
Forward analyses for larger members (thickness 20 cm) on the basis of the parameters obtained by inverse analysis of the drying tests with specimen dimensions of 20x20x80 mm³ yielded similar results. The predicted mass loss curves for the larger members exhibited only slight differences between the different transport models. Thus, the results obtained with the small samples seem to allow for a prediction of the drying of full-scale members, although the drying periods are signifi-cantly longer. The different models also yielded almost the same predictions for the time needed for approaching the equilibrium moisture content. Since the moisture profiles were nearly the same for all models which consider liquid water trans-port, they will lead to almost identical mechanical stress distributions in a simulation of drying shrink-age [14]. It has to be noted however, that the devia-tion of the moisture profiles obtained with Fick’s
law from those obtained with the other models will be more significant for the larger members. Within the first weeks of drying, the curvature of the first-mentioned profiles in the member's center is comparatively large, while the slope towards the boundaries is rather flat. This might lead to an underestimation of eigenstresses and cracking in simulations of drying shrinkage when the transport model is based on Fick’s law.
The question which of the transport models consid-ering both vapor and liquid transport is the most suitable one for simulating moisture transport in mortar may not be answered on the basis of the present results of neutron radiography and inverse analysis of drying tests. From a practical point of view, this question seems to be rather irrelevant since all the aforementioned models yield almost the same prediction for the moisture transport. Figure 7: Moisture-dependent transport coefficients for the different transport models, determined by inverse analysis of drying experiments with the material M05 (w/c=0.5) under an environmental relative humidity of 30 %.
Figure 8: Moisture profiles for selected points in time, obtained by inverse analysis of drying experiments using differ-ent moisture transport models and measured by neutron radiography, respectively.
0.01 0.1 1 10 100 1000 30 40 50 60 70 80 90 100 Relative humidity [%]
Total transport coefficient
[g/(m·
d)]
Fick's law Krus Häupl 1 Häupl 2 Carmeliet
2 4 6 8 -10 -5 0 5 10 Position [mm]
Moisture content by mass
[%]
Fick's law Krus Häupl 1
Häupl 2 Carmeliet Neutron Radiography
0.17 h 12 h
48 h 168 h 691 h
Three Cement Mortars Obtained by Using the Moisture Transport Model by Krus [3] For the analysis of the moisture transport in the three different mortars tested here, the approach by Krus [3] has been used since it yielded the closest fit to the neutron radiographic results. Furthermore, this model is based on a very simple mathematical formulation. The transport coefficients obtained for the three materials under different environmental conditions are shown in Fig. 9 a-c. It may be seen that the transport properties of the three mortars are quite similar. Considering the scatter of the experi-mental results, deviations may only be identified in the high-humidity range. Here, the curves for the mortars with the lowest w/c ratio lie expectedly slightly below the other curves. This may be attributed to the lowest porosity.
Table 4 contains the film coefficients , the vapor diffusion resistance factors µ and the parameters of the transport coefficients for the different materials and environmental conditions. These parameters were also obtained by inverse analysis. For an opti-mal approximation of the model to the experimental data, the film coefficient seems not to be negligible, even under strong air ventilation in the climatic chamber. It appears to be dependent on the w/c ratio, see Table 4. On the basis of the results, it is specu-lated that the film coefficient is more depending on the surface topology than on the environmental con-ditions. The obtained vapor diffusion resistance fac-tors describing the pure vapor transport (in addition to the liquid water transport) are consistently very high. There is also a tendency of increasing resist-ance factors with increasing w/c ratio.
As far as the environmental conditions are con-cerned, the smallest vapor diffusion resistance fac-tors were obtained for 30 % relative humidity in the desiccators. The observation that under a relative humidity of 60 % the gas transport is activated to a smaller extend seems to be reasonable since the gas transport might be hindered by the higher water content. However, the large vapor diffusion resist-ance factors for the samples stored in the climate chamber at 35 % relative humidity would then not be comprehendible. Presumably, the comparatively small influence of the vapor diffusion when com-pared to the one of the liquid water transport may lead in the inverse analysis to partially indetermi-nate vapor diffusion resistance factors.
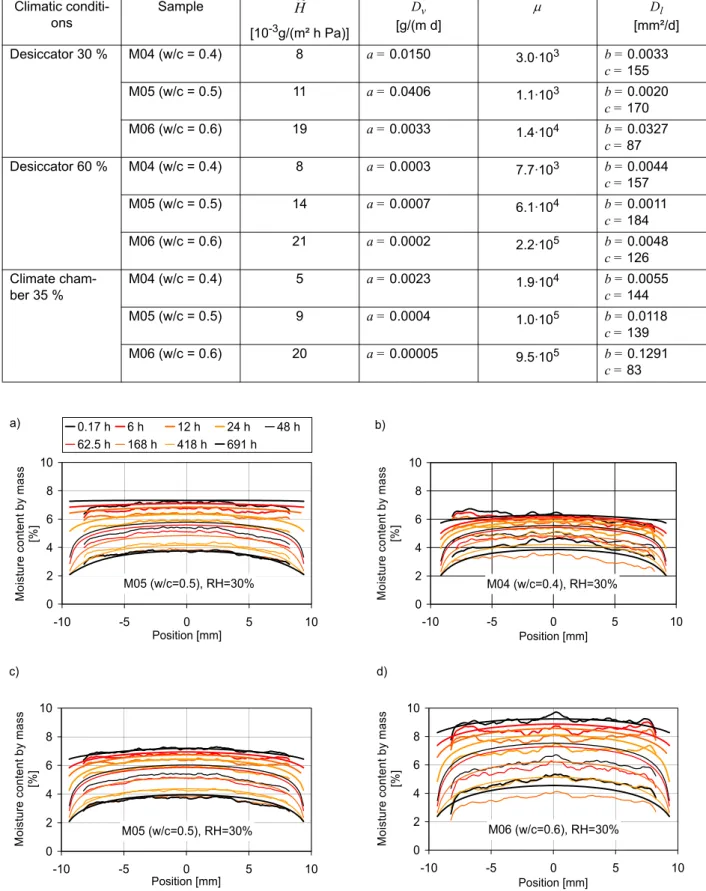
sis exhibit a shape very similar to those determined by neutron radiography; see Fig. 10 a. The initial state, however, is significantly different. Probably, the samples were no longer completely saturated when the neutron radiographic measurements started due to the unavoidable short-time opening of the containers. For this reason, the moisture con-tents determined from the first neutron radio-graphic measurement were considered as initial state in the inverse analyses. This yielded a signifi-cantly better agreement of the moisture profiles obtained by inverse analysis and by neutron radio-graphy, respectively; see Figs 10 b-d. It seems, however, that the decrease of the moisture content within the first days of drying is generally underes-timated by all transport models applied here. Within the first 24 hours, when the relative humid-ity within the specimen is above 95 %, the radio-graphically determined moisture profiles are almost constant lines, i.e., the transport rate is very high due to the interconnected and almost completely water-filled pores. Possibly, the functions used for the transport coefficients are in the high-humidity range not steep enough for capturing this effect. The underestimation of the moisture drop may also be attributed to the higher temperature during the neutron radiographic measurements when com-pared to the other experiments.
It has to be considered that absolute moisture values retrieved from the neutron radiographic images are of limited accuracy due to the aforementioned cor-rections. As described before, conclusions concern-ing the moisture content in the boundary range may hardly be drawn on the basis of these images. How-ever, both the shallow curvature of the moisture pro-files and the general development of these propro-files over a period of 30 days were likewise obtained by both methods applied here. Therefore, the neutron radiographic observations may be regarded as vali-dation of the inverse analysis concept.
7
Conclusions
The investigations have shown that the proposed inverse analysis method allows determining mois-ture transport coefficients of cement mortar under isothermal conditions. A separate consideration of vapor and liquid water transport appears to be a requirement for determining realistic moisture pro-files. Those models which consider both transport mechanisms by multiple transport parameters yielded almost the same results. For the estimation
Figure 9: Moisture-dependent transport coefficients obtained by inverse analysis of drying experiments, (a) sample M04, (b) sample M05, (c) sample M06. 0.01 0.1 1 10 100 1000 30 40 50 60 70 80 90 100 Relative humidity [%]
Total transport coefficient
[g/(m·d)] M04 Desiccator 30% M04 Desiccator 60% M04 Climate chamber 35% a) 0.01 0.1 1 10 100 1000 30 40 50 60 70 80 90 100 Relative humidity [%]
Total transport coefficient
[g/(m·d)] M05 Desiccator 30% M05 Desiccator 60% M05 Climate chamber 35% b) 0.01 0.1 1 10 100 1000 30 40 50 60 70 80 90 100 Relative humidity [%]
Total transport coefficient
[g/(m·d)]
M06 Desiccator 30% M06 Desiccator 60% M06 Climate chamber 35% c)
transport coefficients. Climatic conditi-ons Sample [10-3g/(m² h Pa)] Dv [g/(m d] µ Dl [mm²/d] Desiccator 30 % M04 (w/c = 0.4) 8 a = 0.0150 3.0·103 b = 0.0033 c = 155 M05 (w/c = 0.5) 11 a = 0.0406 1.1·103 b = 0.0020 c = 170 M06 (w/c = 0.6) 19 a = 0.0033 1.4·104 b = 0.0327 c = 87 Desiccator 60 % M04 (w/c = 0.4) 8 a = 0.0003 7.7·103 b = 0.0044 c = 157 M05 (w/c = 0.5) 14 a = 0.0007 6.1·104 b = 0.0011 c = 184 M06 (w/c = 0.6) 21 a = 0.0002 2.2·105 b = 0.0048 c = 126 Climate cham-ber 35 % M04 (w/c = 0.4) 5 a = 0.0023 1.9·104 b = 0.0055 c = 144 M05 (w/c = 0.5) 9 a = 0.0004 1.0·105 b = 0.0118 c = 139 M06 (w/c = 0.6) 20 a = 0.00005 9.5·105 b = 0.1291 c = 83
Figure 10: Comparison of moisture profiles obtained by inverse analysis (smoother curves) and measured by neutron
radiography, respectively; (a) inverse analysis based on 100 % initial relative humidity; (b-d) inverse analysis based on radiographically obtained initial moisture content; legend applies to all four diagrams.
H~ M05 (w/c=0.5), RH=30% 0 2 4 6 8 10 -10 -5 0 5 10 Position [mm] Mo ist ure co nten t by m ass [% ] 0.17 h 6 h 12 h 24 h 48 h 62.5 h 168 h 418 h 691 h a) M04 (w/c=0.4), RH=30% 0 2 4 6 8 10 -10 -5 0 5 10 Position [mm] M o is tu re c o nt e nt b y m a ss [% ] b) M05 (w/c=0.5), RH=30% 0 2 4 6 8 10 -10 -5 0 5 10 Position [mm] Moi st ur e c ont en t by mas s [% ] c) M06 (w/c=0.6), RH=30% 0 2 4 6 8 10 -10 -5 0 5 10 Position [mm] M o is ture c o nte n t by m ass [% ] d)
of the drying time necessary for reaching an approximate equilibrium moisture content, the simplifying Fick’s law with only one transport parameter seems also to be applicable. In the humidity profiles, however, the neglect of the liq-uid water transport results in deviating gradients, so that the stresses due to differential drying shrinkage might be underestimated.
The inverse analysis results could be confirmed by neutron radiographic investigations. It has to be con-sidered, that the required assumptions and image corrections lead to some uncertainty of the radio-graphic results. A qualitative characterization of the moisture distribution in mortar samples, however, is possible. For the investigated cement mortars, both methods yielded slightly curved moisture profiles over the sample's cross-section and a similar decrease of the sample’s moisture content in time. It is concluded that the proposed inverse analysis method under utilization of moisture transport models which include both vapor and liquid trans-port yields results with sufficient accuracy for prac-tical applications. On the basis of easy-to-perform laboratory experiments, the method allows to iden-tify moisture transport parameters which may sub-sequently be used for numerical analyses in the fields of building physics or structural mechanics.
References
1. Z. P. Bažant and L. J. Najjar, Nonlinear water diffusion in nonsaturated concrete, Matériaux et Constructions 25 (5) (1972) 3-20.
2. K. Kießl, Kapillarer und dampfförmiger Feuchtetransport in mehrschichtigen Bautei-len, Rechnerische Erfassung und bauphysika-lische Anwendung, Dissertation, Universität Essen (1983).
3. M. Krus, Feuchtetransport- und Speicherko-effizienten poröser mineralischer Baustoffe. Theoretische Grundlagen und neue Mess-techniken, Dissertation, Universität Stutt-gart (1995).
4. P. Häupl, Feuchtetransport in Baustoffen und Bauwerksteilen, Dissertation, Universi-tät Dresden (1987).
5. P. Häupl and H. Fechner, Hygric material properties of porous building materials, Jour-nal of Building Physics 26 (2003) 259-284.
6. J. Carmeliet, H. Hens, S. Roels, O. Adan, H. Brocken, R. Cerny, Z. Pavlik, C. Hall, K. Kumaran and L. Pel, Determination of the Liquid Water Diffusivity from Transient Moisture Transfer Experiment, Journal of Building Physics 27 (4) (2004) 277-305. 7. G. A. Scheffler, Validierung hygrothermischer
Materialmodellierung unter Berücksichti-gung der Hysterese der Feuchtespeicherung, Dissertation, Universität Dresden (2008). 8. B. Villmann, V. Slowik and A. Michel,
Determination of the diffusion coefficient by inverse analysis of drying experiments, M. J. Setzer (ed.), Proceedings of 5th Inter-national Essen Workshop: Transport in Con-crete: Nano- to Macrostructure (Transcon 07), Aedificatio Publishers, Freiburg (2007) 127-136.
9. B. Villmann, N. Bretschneider, V. Slowik and A. Michel, Bestimmung von Materialei-genschaften zementgebundener Werkstoffe mittels inverser Analyse, Bautechnik 83 (11) (2006) 747-753.
10. T. Villmann, B. Villmann and V. Slowik, Evolutionary algorithms with neighborhood cooperativeness according neural maps, Neurocomputing 57 (2004) 151-169.
11. V. Slowik, B. Villmann and N. Bretschneider, Determining fracture properties of cement-based materials by inverse analysis of experiments, Huang Yuan and F. H. Witt-mann (eds.), Nonlocal Modelling of Failure of Materials, Proceedings of an International Workshop, Wuppertal, Aedificatio Publish-ers, Freiburg (2007) 105-123.
12. E. Lehmann, P. Vontobel, P. Scherrer and P. Niemz, Anwendung der Neutronenradio-graphie zur Analyse von Holzeigenschaften, Holz als Roh- und Werkstoff 59 (2001) 463-471.
13. R. K. Hassanein, Correction methods for the quantitative evaluation of thermal neutron tomography, Dissertation, ETH Zürich (2006).
14. V. Slowik and B. Villmann, Infinitesimal shrinkage as determined by inverse analysis, F. H. Wittmann and O. Mercier (eds.), Pro-ceedings of the ASMES Workshop on Basic Research on Concrete and Applications, Lausanne, Aedificatio Publishers, Freiburg (2011) 231-252.


![Figure 9: Moisture-dependent transport coefficients obtained by inverse analysis of drying experiments, (a) sample M04, (b) sample M05, (c) sample M06.0.010.1110100100030 40 50 60 70 80 90 100Relative humidity [%]](https://thumb-eu.123doks.com/thumbv2/123doknet/14911777.658954/12.892.173.687.115.1127/moisture-dependent-transport-coefficients-obtained-analysis-experiments-relative.webp)