Publisher’s version / Version de l'éditeur:
Vous avez des questions? Nous pouvons vous aider. Pour communiquer directement avec un auteur, consultez la première page de la revue dans laquelle son article a été publié afin de trouver ses coordonnées. Si vous n’arrivez pas à les repérer, communiquez avec nous à [email protected].
Questions? Contact the NRC Publications Archive team at
[email protected]. If you wish to email the authors directly, please see the first page of the publication for their contact information.
https://publications-cnrc.canada.ca/fra/droits
L’accès à ce site Web et l’utilisation de son contenu sont assujettis aux conditions présentées dans le site LISEZ CES CONDITIONS ATTENTIVEMENT AVANT D’UTILISER CE SITE WEB.
Crystal Growth & Design, 18, 9, pp. 5556-5563, 2018-08-09
READ THESE TERMS AND CONDITIONS CAREFULLY BEFORE USING THIS WEBSITE. https://nrc-publications.canada.ca/eng/copyright
NRC Publications Archive Record / Notice des Archives des publications du CNRC :
https://nrc-publications.canada.ca/eng/view/object/?id=3f87e2b3-94af-40c8-8b4d-eb212d9d5450
https://publications-cnrc.canada.ca/fra/voir/objet/?id=3f87e2b3-94af-40c8-8b4d-eb212d9d5450
NRC Publications Archive
Archives des publications du CNRC
This publication could be one of several versions: author’s original, accepted manuscript or the publisher’s version. / La version de cette publication peut être l’une des suivantes : la version prépublication de l’auteur, la version acceptée du manuscrit ou la version de l’éditeur.
For the publisher’s version, please access the DOI link below./ Pour consulter la version de l’éditeur, utilisez le lien DOI ci-dessous.
https://doi.org/10.1021/acs.cgd.8b00859
Access and use of this website and the material on it are subject to the Terms and Conditions set forth at
Capturing elusive polymorphs of curcumin: a structural
characterization and computational study
Matlinska, Maria A.; Wasylishen, Roderick E.; Bernard, Guy M.; Terskikh,
Victor V.; Brinkmann, Andreas; Michaelis, Vladimir K.
Capturing Elusive Polymorphs of Curcumin: A Structural
Characterization and Computational Study
Maria A. Matlinska,
†Roderick E. Wasylishen,
*
,†Guy M. Bernard,
†Victor V. Terskikh,
‡Andreas Brinkmann,
§and Vladimir K. Michaelis
††
Department of Chemistry, University of Alberta, Edmonton, Alberta T6G 2G2, Canada
‡
Department of Chemistry, University of Ottawa, Ottawa, Ontario K1N 6N5, Canada
§
Metrology, National Research Council Canada, 1200 Montreal Road, Ottawa, Ontario K1A 0R6, Canada
*
S Supporting InformationABSTRACT:
Curcumin, a compound derived from the herb turmeric,
has gained considerable attention because of its purported
pharmaco-logical activity, but its poor water solubility and low bioavailability
impedes its therapeutic potential. In addition to the frequently studied
curcumin polymorph, referred to as form I, another polymorph with
enhanced water solubility, referred to as form II, or red curcumin, has
also been reported. We discuss experimental challenges in isolating the
red curcumin polymorph. In the course of our studies, we were unable to
obtain a third reported polymorph, form III. We redetermined crystal structures of forms I and II of curcumin and present
13C
and
1H solid-state nuclear magnetic resonance (NMR) spectra for these two forms, as well as
13C−
1H two-dimensional
heteronuclear correlation (HETCOR) data. The experimental
1H and
13C nuclear magnetic resonance (NMR) chemical shifts
are compared with GIPAW density functional theory values computed using CASTEP. Our research illustrates the utility of
NMR spectroscopy in characterization of polymorphism in bulk samples.
■
INTRODUCTION
Curcumin,
1,7-bis(4-hydroxy-3-methoxyphenyl)-1,6-hepta-diene-3,5-dione (
Scheme 1
), is a natural product found in
turmeric (Curcuma longa), a plant of the ginger family.
1−5Turmeric has been harvested and used in traditional Indian
cooking and medicine for centuries.
1,3Especially interesting
components of turmeric are the curcuminoids, in particular
curcumin, which are responsible for the orange color of
turmeric.
4,5Curcumin has been of interest to the medical
community because of its reported anti-inflammatory,
antioxidant, and anticancer properties.
1−11It has been also
shown to break down β-amyloid fiber aggregates in the brain
that are the hallmark of neurodegenerative diseases, such as
Alzheimer’s disease.
1,4,7However, the methodology of many
medicinal studies of curcumin is controversial, and their
reliability are currently under intense scrutiny by the scientific
community.
12−16A major limitation of using curcumin as a
pharmaceutical is its poor water solubility and hence low
bioavailability.
17Various approaches have been undertaken to
enhance curcumin’s bioavailability, e.g., microfluidic
fabrica-tion of cafabrica-tionic nanoparticles,
18preparing
curcumin-conju-gated gold nanoparticles,
19resorcinol and
curcumin-pyrogallol cocrystals,
20and curcumin nanosuspensions.
21Also,
it has been suggested that one or both of the phenolic
hydrogens can be replaced by a hydrophilic group such as the
phosphonium cation.
22More recently, the latter curcumin
derivative has been used to prepare a cobalt(III) complex that
is claimed to display a remarkable photodynamic therapy
effect.
23As well, the group of Chakravarty has recently
synthesized vanadium(IV) complexes of curcumin.
24The solid-state structure of curcumin in the monoclinic
space group P2/n was first reported in 1982 by Tønessen and
co-workers,
25and later by Parimita et al.
26and by Sanphui and
co-workers.
27More recently, the structure was determined via
synchrotron powder X-ray diffraction (XRD).
28Two
addi-tional polymorphs of curcumin have also been reported by
Sanphui et al.
27The two new polymorphs, referred to as forms
II and III, belong to the orthorhombic space groups Pca2
1and
Pbca, respectively.
27The unit cell of form II contains two
crystallographically non-equivalent molecules while all eight
molecules in the unit cell of form III were reported to be
Received: June 5, 2018 Revised: July 19, 2018 Published: August 9, 2018
Scheme 1. Structure of the Diketo Form of Curcumin
pubs.acs.org/crystal
Cite This:Cryst. Growth Des. 2018, 18, 5556−5563
crystallographically equivalent.
27In 2012, Parameswari et al.
29also reported the structure of the orthorhombic form, Pca2
1(i.e., form II) at 100 K; the crystals were obtained from
propan-2-ol. Both forms I and II of curcumin exist in the solid
state as keto−enol tautomers (see
Scheme 2
). As well, the
keto−enol tautomer is the only tautomer detected in NMR
studies of curcumin in solvents with a wide range of dielectric
constants
30(e.g., chloroform, acetone, methanol, DMSO, and
D
2O/DMSO mixtures).
31Apparently the form II polymorph
of curcumin has a higher aqueous dissolution rate in a 40%
ethanol/water mixture than that for the common and most
studied crystalline polymorph (form I).
27In a 2015 report,
Rasmuson et al.
32reported the preparation of two polymorphs
of curcumin: form I was prepared readily, and with careful
handling a second polymorph was obtained; on the basis of
powder XRD, the authors concluded that this was form III as
previously described by Sanphui et al.,
27but they acknowledge
that the powder patterns for forms II and III are expected to be
similar; they were unable to obtain Form II. A year later,
Rasmuson
33and co-workers discussed the purification of
curcumin and, in this case, reported forms I and II. Thorat and
Dalvi obtained solid form III, but only with the use of
ultrasound.
34Although solid-state
13C NMR spectroscopy is ideally suited
to study polymorphism,
35−43the only study of curcumin
polymorphs via solid-state NMR is that of Sanphui et al.
27Noting a discrepancy between their reported NMR data for
form III and their corresponding single-crystal X-ray
crystallography data,
27and suspecting a misassignment of
some
13C MAS NMR resonances by these and other authors,
44we have obtained high-resolution solid-state
1H and
13C NMR
spectra of the two most studied curcumin polymorphs (forms I
and II), redetermined their single-crystal structures, and
performed GIPAW (gauge including projector augmented
waves) density functional theory (DFT) magnetic shielding
calculations for forms II and III; results are compared with
those obtained from our earlier study of form I.
45We propose
assignments of the
13C and
1H NMR spectra for form II. In the
course of our studies, we found that the preparation of form II
is not straightforward, but once formed, is stable for months.
■
EXPERIMENTAL SECTION
Sample Preparation. Form I of curcumin was obtained from Sigma-Aldrich (St. Louis, MO) and recrystallized by dissolving the sample in warm isopropyl alcohol, allowing it to cool, filtering the resulting crystals and drying on a vacuum line.
Form II was obtained in a two-step crystallization from 95% ethanol. Solid curcumin (200 mg) was dissolved in a minimum amount of hot or boiling solvent (temperature either 2−3 °C below the boiling point or at the boiling point). The solution was then rapidly cooled to 7−9 °C in an ice−water bath and suction-filtered using a Buchner funnel with filter paper of medium porosity and a slow flow rate. The filtrate was then collected and stored at 3−4 °C in glass containers secured with perforated parafilm until enough solid crystallized to repeat the purification procedure. The shortest time at which solid form II crystallized from ethanol was 72 h. The volume of hot solvent and the time required to dissolve the solid increased with each crystallization step (9.6 mL of ethanol in step one, 20.0 mL in step two, similar for other solvents).
Crystallization from all solvents used by Sanphui et al.27 was attempted, but only ethanol as a solvent yielded the desired polymorph on one occasion; see Table S7 inSupporting Information (SI) for details on several recrystallization attempts. Co-crystallization with 4-hydroxypyridine and 4,6-dihydroxy-5-nitropyrimidine in ethanol, as described in the literature,27 as well as seeding with a mixture of form I and form II crystals, similar to the method reported by Ukrainczyk et al.33was unsuccessful, yielding form I in all cases; due to technical limitations, we were unable to achieve the rigorous cooling rate control and conditions described by these authors. In summary, obtaining form II proved challenging; the difficulties with curcumin polymorphism have been discussed.34Such difficulties have been encountered for other compounds, and the term “disappearing polymorphs” has been appropriately used when describing this phenomenon.46
Initial screening for samples for solid-state NMR characterization was largely based on their color (red samples were believed to contain form II, whereas light orange was suspected to be mainly form I, as
Scheme 2. Molecular Structures for Form I and for
Molecules A and B of Form II of Curcumin
aaRed = oxygen, light grey = hydrogen, and dark grey = carbon. The atom labeling used in the text is shown, as well as a view of each molecule approximately perpendicular to the page to illustrate how they deviate from planarity.
Crystal Growth & Design
ArticleDOI:10.1021/acs.cgd.8b00859
Cryst. Growth Des. 2018, 18, 5556−5563
described by Liu et al.),32but we found that characterization by solid-state NMR spectroscopy or single-crystal X-ray crystallography is essential to ascertain that the desired polymorph has been obtained. The form II of curcumin is stable for at least 15 months when stored in a sealed container, as confirmed by performing periodic1H and13C CP/MAS experiments.
X-ray Crystallography.Single-crystal data of form II of curcumin were collected at −100 °C on a Bruker D8/APEX II CCD diffractometer with a Cu Kα radiation source, λ = 1.54178 Å. Programs for diffractometer operation, data collection, data reduction, and absorption correction were those supplied by Bruker. The structure was solved by the intrinsic phasing SHELXT-2014 method47 and refined with SHELXL-2014.48
Solid-State Nuclear Magnetic Resonance Spectroscopy. Solid-state13C NMR spectra were obtained at 7.05 T using a Bruker Avance 300 NMR spectrometer operating at 75.5 MHz for13C, with a Bruker 4 mm double-resonance magic-angle spinning (MAS) probe, in a cross-polarization (CP) experiment49with a contact time of 3.5 ms, a recycle delay of 5 s and a MAS frequency of 11 kHz. A 4.0 μs 90°1H pulse and a two-pulse phase-modulated (TPPM)50decoupling field of 62.5 kHz was used to acquire all solid-state13C NMR spectra, which were referenced to TMS (δiso= 0 ppm) by setting the high-frequency peak of adamantane to 38.56 ppm.5113C NMR spectra for a MAS sample of bis-demethoxycurcumin were acquired under similar conditions at 11.75 T with a spinning frequency of 12.5 kHz.
Two-dimensional13C−1H HETCOR NMR spectra were acquired at 21.1 T at the National Ultrahigh-field NMR Facility for Solids in Ottawa, Canada, on a Bruker Avance II 900 NMR spectrometer. These were obtained using a Bruker 4 mm HCN MAS probe, with a contact time of 0.25 (form I) or 0.5 ms (form II), a recycle delay of 10 or 20 s, respectively, for forms I and II, and a MAS frequency of 18 kHz; spectra were acquired with 32 t1 increments of 18.88 μs. The spectrum for form I was acquired in less than 24 h by coadding 268 transients for each slice, but the limited sample amount (≈15 mg) and the presence of two molecules in the asymmetric unit for form II meant that 640 coadded transients per slice were required for this sample; combined with its longer1H T1relaxation time, a total of 5 days was required to acquire the spectrum. One-dimensional solid-state CP/MAS13C NMR spectra were obtained on this instrument using similar conditions as for the HETCOR experiment, but with a contact time of 5.0 ms. Solid-state1H NMR spectra were acquired on this instrument with a Bruker 1.3 mm H/X MAS probe using a rotor-synchronized echo pulse sequence (i.e., 90°−τ−90°−τ−acquire, where τ is the interpulse delay) with a recycle delay of 30 s and a 90° pulse of 2.0 μs, at a MAS frequency of 50 kHz. The1H and13C spectra were referenced to TMS (δiso= 0 ppm) by setting the isotropic 1H peak of adamantane to 1.8 ppm52
and the isotropic13C carbonyl peak of glycine to 176.5 ppm.53
GIPAW DFT Calculations. GIPAW DFT calculations were performed using the Cambridge Sequential Total Energy Package (CASTEP) code (version 2017), which uses a plane-wave pseudopotential approach.54The generalized gradient approximation with the Perdew−Burke−Ernzerhof exchange correlation functional was used.55,56The crystal structure of curcumin form II determined by X-ray crystallography as described above was used as the starting point for the geometry optimization, for which the Broyden− Fletcher−Goldfarb−Shanno (BFGS) algorithm,57−61on-the-fly
gen-eration (OTFG) ultrasoft pseudopotentials (version 80), a cutoff energy of 571.4 eV, and a 1 × 2 × 1 k-point grid were chosen. Subsequently, NMR parameters were computed with the NMR module within CASTEP employing OTFG pseudopotentials (version 00), a cutoff energy of 550 eV, and a 1 × 2 × 1 k-point grid. Calculated isotropic magnetic shielding values were converted to calculated isotropic chemical shift values as follows: for hydrogen, δ/ ppm (calc.) = 29.0/ppm − σ/ppm (calc.), and for carbon, δ/ppm (calc.) = 170.4/ppm − σ/ppm (calc.).45
■
RESULTS AND DISCUSSION
Single-Crystal X-ray Diffraction: Structural
Differ-ences between Forms I and II of Curcumin.
Knowledge
of the solid-state crystal structures of compounds under
investigation aides greatly in the analysis of the solid-state
13C
NMR spectra. Thus, to ascertain that the desired polymorphs
of curcumin had been obtained, single-crystal X-ray diffraction
data were obtained for both forms I and II; see
SI Tables S1−
S4 and Figures S1 and S2
for a detailed listing of the
parameters derived from these analyses. We have carefully
compared our results with reported structures for forms I
25−28and II,
27,29fi
nding only minor differences. Unless otherwise
specified, the single-crystal X-ray data obtained in our lab will
be presented in the discussion below.
Single-crystal X-ray diffraction data reveals several
distin-guishing features between forms I and II of curcumin: form I is
monoclinic with a single crystallographically distinct molecule
within its asymmetric unit, while form II is orthorhombic with
two crystallographically distinct molecules, designated as
molecules A and B, in its asymmetric unit (see
Scheme 2
).
A notable feature for form I is the arrangement of its C10−
C11−C12−C13 fragment (
Scheme 2
), with C13 oriented cis
to C10. In addition, the C12−C13−C14−C15 atoms diverge
from the near planarity found for atoms C1 through C11 such
that the phenyl moiety bonded to C13 forms an angle of
approximately 43° with this plane. In contrast, form II has an
all-trans arrangement of the C10−C11−C12−C13 fragments
of both molecules A and B, and there are only minor deviations
from planarity for these molecules. Applying a rotation of
approximately 165° about the C11−C12 bond for form I
results in the approximate arrangement observed for form II
(
Scheme 2
). The planarity and all-trans configuration of the
C7 through to C13 fragment of the form II polymorph is most
likely responsible for its red color (bathochromic shift)
62compared to the yellow-orange form I polymorph.
63,64Note
that dark red form I crystals have also been reported,
25serving
as a reminder that one should be cautious when characterizing
compounds using subjective methods such as a visual
inspection. When practical, instrumental analyses are preferred.
Of particular interest in interpreting the solid-state
1H and
13C NMR spectra of forms I and II is a comparison of the
hydrogen-bonding interactions, also summarized in
SI Tables
S2 and S4
. The strength of O···H···O hydrogen bonds is often
related to the separation of the oxygen atoms of the
hydrogen-bonded fragment of the molecule under consideration. In
general, distances less than 2.5 Å are considered an indication
of strong hydrogen bonds in which case the barrier between
the zero-point energies (ZPE) of the two potential wells is
comparable to the barrier between the two wells.
65−68In
contrast, if the O−O separations are in the 2.6 to 2.8 Å
range,
68the barrier between the two potential wells is generally
significantly above the ZPE of each well and the hydrogen
bonds are normally classified as moderate or weak.
68,69The
relationship between barrier height and ZPEs in the keto−enol
fragment of 1,3-β-diketones is nicely illustrated in the study of
McKenzie et al.
68Another method of assessing the strength of
hydrogen bonds in the keto−enol fragment of β-diketones is
through the investigation of a possible interplay between a
local resonance structure and hydrogen bonding (i.e.,
resonance-assisted hydrogen bonding or RAHB),
70−72as
illustrated in
Figure S3
. Delocalization in the enol-keto
fragment is an indication of strong hydrogen bonding. In a
fully delocalized symmetric system, the two C−O bond lengths
and the two C−C bond lengths are equal. At the other
extreme, where the keto−enol fragment consists of isolated C−
O−H and CO fragments, one may expect a significant
difference between the C−O and the C−C bond lengths. For
example, based on standard bond lengths proposed by J. A.
Pople and D. L. Beveridge,
73one expects the C−O bond
length of a CO bond to be 1.22 Å, while in the C−O−H
fragment the C−O bond length would be approximately 1.36
Å. Note that these values are within experimental error of the
CO bond length determined for benzophenone, 1.23 Å,
74and the C−O bond length in phenol, 1.374 Å.
75Similarly, the
C−C bond lengths in the OC−C and O−CC fragments
are expected to be 1.46 and 1.34 Å, respectively. Thus,
differences in these bond lengths (see
Tables S5 and S6
) are an
indication of the hydrogen bond strength. See Section 2 of
Supporting Information
for a more detailed discussion of this
analysis.
The molecules of form I exhibit three intramolecular
hydrogen bonds: a strong intramolecular H-bond in the
keto−enol fragment of the β-diketone fragment is expected
with an O3−O4 separation of 2.456 Å, and both phenyl OH
groups for this form participate in H-bonding with their
adjacent methoxy groups with O−O separations of 2.674 and
2.700 Å. There also is one intermolecular H-bond involving
one of the oxygen atoms of the keto−enol fragment and a
phenyl OH group, with an O−O separation of 2.807 Å.
The bonding arrangements for the two molecules in the
asymmetric unit of form II of curcumin differ slightly.
Molecule A has two intramolecular H-bonds, the strongest
being the one in the keto−enol fragment with an O−O
separation of 2.530 Å, and a weaker one involving the phenyl
OH and adjacent methoxy group, with an O−O separation of
2.714 Å. Note that the other phenyl OH group forms a
moderately strong intermolecular H-bond with one of the
oxygens of the keto−enol fragment in a neighboring molecule
A, 2.633 Å (
Figure S4
). For isolated 2-methoxyphenol,
quantum chemistry computations indicate that the
conforma-tion of the O−H cis to the methoxy oxygen is more stable than
the trans conformation by 4.43 kcal mol
−1(18.5 kJ mol
−1).
76Intramolecular OH···OMe hydrogen bonding in
2-methoxy-phenol is also consistent with gas-phase electron diffraction
experiments and quantum chemistry calculations.
77These
observations support the idea that the intermolecular hydrogen
bond between the phenyl OH on C4A and the oxygen of the
keto−enol fragment, specifically O3A, must be relatively
strong. Molecule B of form II of curcumin has three
intramolecular H-bonds, again the one in the keto−enol
fragment, with an O−O separation of 2.501 Å, is the strongest
while the other two involve the phenyl OH groups and
adjacent methoxy oxygens analogous to that observed for form
I, with O−O separations of 2.652 and 2.650 Å. In addition,
there are also weaker intermolecular H-bonds. Note that
although, on the basis of the O−O separation, the
intra-molecular hydrogen bonds for the keto−enol fragments of
both molecules A and B are expected to be strong, this
assessment nevertheless predicts that these hydrogen bonds
will be weaker than the corresponding bond in form I, which
has a significantly shorter O−O separation. Weaker hydrogen
bonding in form II is also supported by the enol OH proton
chemical shifts in the solid state.
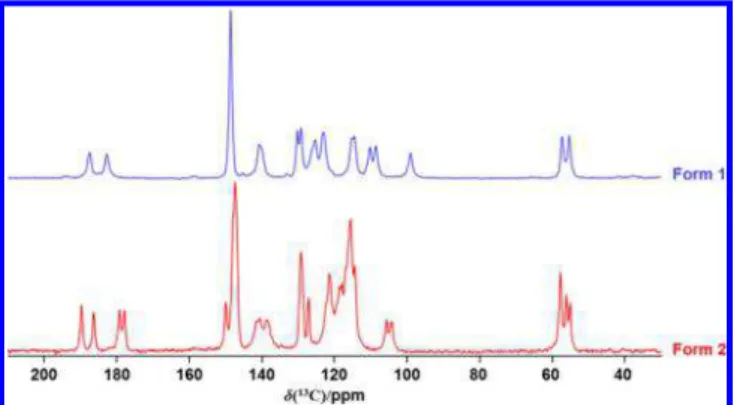
Solid-State NMR Spectroscopy.
Figures 1
and
2
illustrate
13
C and
1H solid-state MAS NMR spectra of samples for forms
I and II, respectively. The obvious difference in
13C NMR
spectra of forms I and II is that the number of resolved peaks
observed for form II is greater than that for form I; since there
are two molecules in the asymmetric unit for form II, there are,
ignoring overlap, double the NMR peaks observed for form I,
complicating the assignment of the spectrum. For example,
four peaks are observed in the carbonyl region for form II, as
expected. However, on the basis of this one-dimensional NMR
spectrum, it is impossible to assign these peaks to either
molecule A or B. Likewise, there are three peaks with an
approximate 2:1:1 intensity ratio in the methyl region, as
expected from a structure containing two distinctive molecules,
each with two distinctive methoxy groups. The distinct
carbonyl carbon and enolic
1H NMR peaks for this sample
suggest that an NMR correlation experiment may be
instructive (vide inf ra).
Solid-state
1H NMR spectroscopy may also provide
information on the nature of hydrogen-bonded systems, with
the
1H chemical shift of the enolic proton increasing with
increasing hydrogen bond strength.
67,78−85That for form I is
16.8 ppm,
45but the corresponding values for molecules A and
B of curcumin in II are 14.5 and 15.7 ppm (
Figure 2
),
suggesting a stronger hydrogen bond for the enolic proton of
form I, consistent with the predictions based on O−O
separations discussed above.
To further characterize the
13C NMR spectrum for solid
form II, a
13C−
1H HETCOR spectrum was acquired at 21.1 T.
The carbonyl region of that spectrum is shown in
Figure 3
,
where it clearly indicates that the two inner carbonyl
13C peaks
are correlated with the less shielded of the two enolic
1H
nuclei. Unfortunately, there is insufficient resolution in the
1H
spectrum for form II to use a similar approach to distinguish
between other
13C peaks from molecules A and B (e.g., while
Figure 1. 13C NMR spectra of forms I and II of solid curcumin, obtained with CP at 7.05 T with a magic-angle spinning frequency of 11 kHz.
Figure 2. 1H NMR spectra of forms I and II of solid curcumin acquired at 21.1 T with a magic-angle spinning frequency of 50 kHz.
Crystal Growth & Design
ArticleDOI:10.1021/acs.cgd.8b00859
Cryst. Growth Des. 2018, 18, 5556−5563
three peaks are resolved in the region of the methyl carbons,
the corresponding
1H peaks are not resolved; see
Figure S5
).
Further information is required to assign
13C NMR peaks to
either molecule A or B; for this, we turn to computational
results, discussed later.
While our single-crystal XRD data of curcumin form II
discussed above are consistent with those obtained in earlier
studies,
27,29such is not the case for our solid-state
13C NMR
spectrum for form II. Our
13C NMR spectrum for form II is
completely different than that reported by Sanphui et al.
27who
reported
13C NMR peaks in the 156−163 ppm region;
however, we did not observe any peaks in this region. The
authors assigned these peaks to C4 and C17 (
Scheme 2
), as
did Zhao et al.
43for form I. We only observed peaks in this
region for spectra acquired for form I prior to sample
recrystallization, indicating that these peaks arise from
impurities. A solid-state
13C NMR spectrum of a probable
impurity, bisdemethoxycurcumin (BDMC), contains a peak at
160 ppm; also,
13C NMR spectra for samples of BDMC and
demethoxycurcumin (DMC) dissolved in various solvents
contain a peak in the 159.7 to 160.5 ppm region.
86,87Commercial curcumin contains significant amounts of DMC
(≈17%) and BDMC (≈3%) impurities.
2The solid-state
13C NMR spectrum of form III reported by
Sanphui et al.
27appears to contain approximately twice the
number of peaks expected on the basis of the crystal
structure,
27which has one distinct molecule in the asymmetric
unit. For example, there are four
13C NMR peaks in the 175 to
190 ppm region rather than the two expected from the
reported crystal structure. Observation of twice as many
nonequivalent carbon centers as expected suggests either two
distinct molecules in the unit cell, or a spectrum for a mixture
of two or more compounds. These authors also reported a
13C
spectrum for form II, attributing the peak broadening to higher
amorphous content compared with spectra for the other
polymorphs; however, their reported chemical shifts
27are
inconsistent with our values.
DFT Calculation Results and Peak Assignment.
GIPAW DFT calculations were undertaken to further assign
13
C and
1H solid-state NMR spectra (
Figures 1
and
2
,
respectively) of form II of curcumin. A plot of experimental vs
computed
13C chemical shifts is shown in
Figure S6
. The R
2value of 0.997 for both molecules A and B indicates a strong
positive correlation, with only one significant outlier, for the
peak with an experimental value of approximately 105 ppm,
corresponding to C10. The calculation results, summarized in
Table S8
, suggest that the two outer
13C carbonyl peaks at
178.1 and 189.5 ppm are from molecule B, while the two inner
peaks at 179.6 and 189.5 ppm are from molecule A. These
results are consistent with the experimental
13C−
lH HETCOR
NMR spectrum discussed above. However, agreement between
experiment and theory is not as good for the
1H chemical shifts
(see
Table S8
) probably due to the narrower range of chemical
shifts for
1H. For example, calculations suggest that molecule
A, which contains the two inner carbonyl
13C peaks, also
contains the more shielded enolic
1H, contradicting the
13C−
1H HETCOR NMR results, which show that this proton
is in the molecule with the two outer carbonyl peaks. In light of
the better agreement between experimental and calculated
13C
chemical shifts, the error is thought to be in the calculated
1H
results, and thus, the least shielded enolic
1H is assigned to
molecule A. In a combined solid-state NMR and
computa-tional study of form I of curcumin and of dibenzoylmethane,
Kong et al. considered the nonclassical enolic proton
probability distribution caused by nuclear quantum effects,
45concluding that a computational methodology that treats this
proton as a static entity can lead to a failure of DFT results.
45Finally, it is well-known that
1H NMR chemical shifts of
hydrogen-bonded O−H groups are strongly dependent on
temperature
88−91(i.e., vibrational averaging and detailed
dynamics of the O−H moiety
92).
■
CONCLUSIONS
Form II of curcumin has been prepared and its crystal structure
confirmed by solid-state NMR spectroscopy and X-ray
crystallography. Although the experimental procedure for
obtaining red curcumin is not straightforward, once formed,
it is stable for months under normal storage conditions. Based
on
1H,
13C, and 2D
13C−
1H HETCOR NMR results and on
results obtained from single-crystal X-ray diffraction and from
GIPAW DFT calculations, we have assigned the
13C NMR
peaks for form II of curcumin. We conclude that peaks in the
156−163 ppm region previously assigned to C4 and C17 are
from impurities that can be removed through recrystallization.
Our high-resolution
13C NMR spectra for solid form II
indicate that it is possible to obtain crystalline powder samples
of this form through recrystallization. Finally, experimental
13
C−
1H HETCOR NMR results are consistent with GIPAW
DFT calculations in assigning
13C peaks to molecules A and B,
but these calculations failed to predict the relative
1H chemical
shifts of the enol protons.
■
ASSOCIATED CONTENT
*
S Supporting InformationThe Supporting Information is available free of charge on the
ACS Publications website
at DOI:
10.1021/acs.cgd.8b00859
.
Single-crystal X-ray diffraction, resonance assisted
hydro-gen bonding, and additional figures and tables (
)
Figure 3.Carbonyl region of the13C−1H HETCOR NMR spectrum for solid curcumin, form II, acquired at 21.1 T at an MAS frequency of 18 kHz. On the basis of the GIPAW DFT calculations, the blue inner two cross-peaks are from molecule A and the red outer two cross-peaks are from molecule B. The1H NMR chemical shifts of the enolic protons are 15.7 ppm (molecule A) and 14.5 ppm (molecule B). Note that the 1D spectra illustrated here were obtained in separate measurements with spinning frequencies of 50 kHz (1H) and 18 kHz (13C).
Accession Codes
CCDC
1847464
−
1847465
contain the supplementary
crys-tallographic data for this paper. These data can be obtained
free of charge via
www.ccdc.cam.ac.uk/data_request/cif
, or by
emailing
[email protected]
, or by contacting The
Cambridge Crystallographic Data Centre, 12 Union Road,
Cambridge CB2 1EZ, UK; fax: +44 1223 336033.
■
AUTHOR INFORMATION
Corresponding Author*
Tel: +1-780-492-4336. E-mail:
roderick.wasylishen@ualberta.
ca
.
ORCIDRoderick E. Wasylishen:
0000-0003-4150-3651Guy M. Bernard:
0000-0003-1507-6705Victor V. Terskikh:
0000-0003-1514-2610Vladimir K. Michaelis:
0000-0002-6708-7660 NotesThe authors declare no competing financial interest.
■
ACKNOWLEDGMENTS
The Natural Sciences and Engineering Research Council
(NSERC) of Canada and the University of Alberta are
acknowledged for generous research support. Access to the
21.1 T NMR spectrometer was provided by the National
Ultrahigh-Field NMR Facility for Solids (Ottawa, Canada), a
national research facility funded by a consortium of Canadian
universities and by an NSERC RTI grant, and supported by
the National Research Council of Canada and Bruker BioSpin,
managed by the University of Ottawa (
http://nmr900.ca
).
MAM was partially supported by the Undergraduate
Researcher Stipend provided by the University of Alberta
Undergraduate Research Initiative, and by the Dr. R. Norman
and Magda Kemeny Jones Summer Studentship. The authors
thank Dr. Robert McDonald for obtaining single-crystal X-ray
data and Dr. Michael Ferguson for helpful comments, Ms.
Qichao Wu and Ms. Michelle Ha for their assistance in the
preparation of the samples, and Ms. Zhuang Duan for
obtaining some preliminary NMR spectra.
■
REFERENCES
(1) Goel, A.; Kunnumakkara, A. B.; Aggarwal, B. B. Curcumin as “Curecumin”: From kitchen to clinic. Biochem. Pharmacol. 2008, 75, 787−809.
(2) Esatbeyoglu, T.; Huebbe, P.; Ernst, I. M. A.; Chin, D.; Wagner, A. E.; Rimbach, G. Curcumin − From Molecule to Biological Function. Angew. Chem., Int. Ed. 2012, 51, 5308−5332.
(3) Gupta, S. C.; Kismali, G.; Aggarwal, B. B. Curcumin, a Component of Turmeric: From Farm to Pharmacy. BioFactors 2013,
39, 2−13.
(4) Bairwa, K.; Grover, J.; Kania, M.; Jachak, S. M. Recent developments in chemistry and biology of curcumin analogues. RSC
Adv. 2014, 4, 13946−13978.
(5) Cooksey, C. J. Turmeric: old spice, new spice. Biotech. Histochem. 2017, 92, 309−314.
(6) Sharma, O. P. Antioxidant activity of curcumin and related compounds. Biochem. Pharmacol. 1976, 25, 1811−1812.
(7) Baum, L.; Ng, A. Curcumin interaction with copper and iron suggests one possible mechanism of action in Alzheimer’s disease animal models. J. Alzheimer's Dis. 2004, 6, 367−377.
(8) Menon, V. P.; Sudheer, A. R. Antioxidant and anti-inflammatory properties of curcumin. In The Molecular Targets and Therapeutic Uses
of Curcumin in Health and Disease; Aggarwal, B. B., Surh, Y.-J.,
Shishodia, S., Eds.; Springer: Boston, MA, 2007; pp 105−125.
(9) Salem, M.; Rohani, S.; Gillies, E. R. Curcumin, a promising anti-cancer therapeutic: a review of its chemical properties, bioactivity and approaches to cancer cell delivery. RSC Adv. 2014, 4, 10815−10829. (10) Hewlings, S. J.; Kalman, D. S. Curcumin: A Review of Its’ Effects on Human Health. Foods 2017, 6, 92.
(11) Arablou, T.; Kolahdouz-Mohammadi, R. Curcumin and endometriosis: Review on potential roles and molecular mechanisms.
Biomed. Pharmacother. 2018, 97, 91−97.
(12) Nelson, K. M.; Dahlin, J. L.; Bisson, J.; Graham, J.; Pauli, G. F.; Walters, M. A. The Essential Medicinal Chemistry of Curcumin. J.
Med. Chem. 2017, 60, 1620−1637.
(13) Padmanaban, G.; Nagaraj, V. A. Curcumin May Defy Medicinal Chemists. ACS Med. Chem. Lett. 2017, 8, 274.
(14) Nelson, K. M.; Dahlin, J. L.; Bisson, J.; Pauli, G. F.; Walters, M. A. Curcumin May (Not) Defy Science. ACS Med. Chem. Lett. 2017, 8, 467−470.
(15) Bahadori, F.; Demiray, M. A Realistic View on “The Essential Medicinal Chemistry of Curcumin. ACS Med. Chem. Lett. 2017, 8, 893−896.
(16) Tsuda, T. Curcumin: An Effective or Deceptive Dietary Factor? Challenges for Functional Food Scientists. J. Agric. Food Chem. 2018,
66, 1059−1060.
(17) Modasiya, M. K.; Patel, V. M. Studies on solubility of curcumin.
Int. J. Pharm. Life Sci. 2012, 3, 1490−1497.
(18) Dev, S.; Prabhakaran, P.; Filgueira, L.; Iyer, K. S.; Raston, C. L. Microfluidic fabrication of cationic curcumin nanoparticles as an anti-cancer agent. Nanoscale 2012, 4, 2575−2579.
(19) Sindhu, K.; Rajaram, A.; Sreeram, K. J.; Rajaram, R. Curcumin conjugated gold nanoparticle synthesis and its biocompatibility. RSC
Adv. 2014, 4, 1808−1818.
(20) Sanphui, P.; Goud, N. R.; Khandavilli, U. B. R.; Nangia, A. Fast Dissolving Curcumin Cocrystals. Cryst. Growth Des. 2011, 11, 4135− 4145.
(21) Zabihi, F.; Xin, N.; Jia, J.; Cheng, T.; Zhao, Y. Preparation of Nano-curcumin with Enhanced Dissolution Using Ultrasonic-Assisted Supercritical Anti-solvent Technique. Int. J. Food Eng. 2015, 11, 609− 617.
(22) Reddy, C. A.; Somepalli, V.; Golakoti, T.; Kanugula, A. K.; Karnewar, S.; Rajendiran, K.; Vasagiri, N.; Prabhakar, S.; Kuppusamy, P.; Kotamraju, S.; Kutala, V. K. Mitochondrial-Targeted Curcumi-noids: A Strategy to Enhance Bioavailability and Anticancer Efficacy of Curcumin. PLoS One 2014, 9, e89351.
(23) Garai, A.; Plant, I.; Banerjee, S.; Banik, B.; Kondaiah, P.; Chakravarty, A. R. Photorelease and Cellular Delivery of Mitocurcu-min from Its Cytotoxic Cobalt (III) Complex in Visible Light. Inorg.
Chem. 2016, 55, 6027−6035.
(24) Bhattacharyya, U.; Kumar, B.; Garai, A.; Bhattacharyya, A.; Kumar, A.; Banerjee, S.; Kondaiah, P.; Chakravarty, A. R. Curcumin “Drug” Stabilized in Oxidovanadium(IV)-BODIPY Conjugates for Mitochondria-Targeted Photocytotoxicity. Inorg. Chem. 2017, 56, 12457−12468.
(25) Tønnesen, H. H.; Karlsen, J.; Mostad, A. Structural Studies of Curcuminoids. I. The Crystal Structure of Curcumin. Acta Chem.
Scand. 1982, 36, 475−479.
(26) Parimita, S. P.; Ramshankar, Y. V.; Suresh, S.; Row, T. N. G. Redetermination of curcumin: (1E,4Z,6E)-5-hydroxy-1,7-bis(4-hy-droxy-3-methoxy-phenyl)hepta-1,4,6-trien-3-one. Acta Crystallogr.,
Sect. E: Struct. Rep. Online 2007, 63, o860−o862.
(27) Sanphui, P.; Goud, N. R.; Khandavilli, U. B. R.; Bhanoth, S.; Nangia, A. New polymorphs of curcumin. Chem. Commun. 2011, 47, 5013−5015.
(28) Reid, J. W.; Kaduk, J. A.; Garimella, S. V.; Tse, J. S. Rietveld refinement using synchrotron powder diffraction data for curcumin, C21H20O6, and comparison with density functional theory. Powder
Diffr. 2015, 30, 67−75.
(29) Parameswari, A. R.; Devipriya, B.; Jenniefer, S. J.; Muthiah, P. T.; Kumaradhas, P. Low Temperature Crystal Structure of 5- Hydroxy-1,7-Bis-(4-Hydroxy-3-Methoxy-Phenyl)-Hepta-1,6-Dien-3-one. J. Chem. Crystallogr. 2012, 42, 227−231.
Crystal Growth & Design
ArticleDOI:10.1021/acs.cgd.8b00859
Cryst. Growth Des. 2018, 18, 5556−5563
(30) Wohlfarth, C. Permittivity (dielectric constant) of liquids. In
CRC Handbook of Chemistry and Physics; Lide, D. R., Ed.; CRC Press:
Boca Raton, FL, 2004−2005; pp 6−155 to 6−177.
(31) Payton, F.; Sandusky, P.; Alworth, W. L. NMR Study of the Solution Structure of Curcumin. J. Nat. Prod. 2007, 70, 143−146.
(32) Liu, J.; Svärd, M.; Hippen, P.; Rasmuson, Å. C. Solubility and Crystal Nucleation in Organic Solvents of Two Polymorphs of Curcumin. J. Pharm. Sci. 2015, 104, 2183−2189.
(33) Ukrainczyk, M.; Hodnett, B. K.; Rasmuson, Å. C. Process Parameters in the Purification of Curcumin by Cooling Crystal-lization. Org. Process Res. Dev. 2016, 20, 1593−1602.
(34) Thorat, A. A.; Dalvi, S. V. Solid-State Phase Transformations and Storage Stability of Curcumin Polymorphs. Cryst. Growth Des. 2015, 15, 1757−1770.
(35) Harris, R. K. NMR crystallography: the use of chemical shifts.
Solid State Sci. 2004, 6, 1025−1037.
(36) Gobetto, R. Solid State NMR. In Making Crystals by Design; Braga, D., Grepioni, F., Eds.; Wiley-VCH: Weinheim, Germany, 2007; pp 266−292.
(37) Cahill, L. S.; Goward, G. R. Intermolecular Interactions & Structural Motifs. In NMR Crystallography; Harris, R. K., Wasylishen, R. E., Duer, M. J., Eds.; Wiley: Chichester, UK, 2009; Chapter 21, pp 305−319.
(38) Potrzebowski, M. J. Organic & Pharmaceutical Chemistry. In
NMR Crystallography; Harris, R. K., Wasylishen, R. E., Duer, M. J.,
Eds.; Wiley: Chichester, UK, 2009; Chapter 28, pp 435−453. (39) Apperley, D. C.; Harris, R. K.; Hodgkinson, P. Solid-State NMR.
Basic Principles & Practice; Momentum Press: New York, 2012;
Chapter 1.4, pp 12−14.
(40) Macholl, S.; Tietze, D.; Buntkowsky, G. NMR crystallography of amides, peptides and protein-ligand complexes. CrystEngComm 2013, 14, 8627−8638.
(41) Martineau, C.; Senker, J.; Taulelle, F. NMR Crystallography.
Annu. Rep. NMR Spectrosc. 2014, 82, 1−57.
(42) Bryce, D. L. NMR crystallography: structure and properties of materials from solid-state nuclear magnetic resonance observables.
IUCrJ 2017, 4, 350−359.
(43) Brog, J.-P.; Chanez, C.-L.; Crochet, A.; Fromm, K. M. Polymorphism, what it is and how to identify it: a systematic review.
RSC Adv. 2013, 3, 16905−16931.
(44) Zhao, X.-Z.; Jiang, T.; Wang, L.; Yang, H.; Zhang, S.; Zhou, P. Interaction of curcumin with Zn(II) and Cu(II) ions based on experiment and theoretical calculation. J. Mol. Struct. 2010, 984, 316− 325.
(45) Kong, X.; Brinkmann, A.; Terskikh, V.; Wasylishen, R. E.; Bernard, G. M.; Duan, Z.; Wu, Q.; Wu, G. Proton Probability Distribution in the O···H···O Low-Barrier Hydrogen Bond: A Combined Solid-State NMR and Quantum Chemical Computational Study of Dibenzoylmethane and Curcumin. J. Phys. Chem. B 2016,
120, 11692−11704.
(46) Dunitz, J. D.; Bernstein, J. Disappearing Polymorphs. Acc.
Chem. Res. 1995, 28, 193−200.
(47) Sheldrick, G. M. SHELXT-Integrated space-group and crystal-structure determination. Acta Crystallogr., Sect. A: Found. Adv. 2015,
71, 3−8.
(48) Sheldrick, G. M. Crystal structure refinement with SHELXL.
Acta Crystallogr., Sect. C: Struct. Chem. 2015, 71, 3−8.
(49) Pines, A.; Gibby, M. G.; Waugh, J. S. Proton-enhanced NMR of dilute spins in solids. J. Chem. Phys. 1973, 59, 569−590.
(50) Bennett, A. E.; Rienstra, C. M.; Auger, M.; Lakshmi, K. V.; Griffin, R. G. Heteronuclear decoupling in rotating solids. J. Chem.
Phys. 1995, 103, 6951−6958.
(51) Earl, W. L.; VanderHart, D. L. Measurement of13C Chemical Shifts in Solids. J. Magn. Reson. 1982, 48, 35−54.
(52) Brouwer, D. H.; Horvath, M. Minimizing the effects of RF inhomogeneity and phase transients allows resolution of two peaks in the 1H CRAMPS NMR spectrum of adamantane. Solid State Nucl.
Magn. Reson. 2015, 71, 30−40.
(53) Taylor, R. E.13C CP/MAS: Application to Glycine. Concepts
Magn. Reson. 2004, 22, 79−89.
(54) Clark, S. J.; Segall, M. D.; Pickard, C. J.; Hasnip, P. J.; Probert, M. I. J.; Refson, K.; Payne, M. C. First principles methods using CASTEP. Z. Kristallogr. - Cryst. Mater. 2005, 220, 567−570.
(55) Perdew, J. P.; Burke, K.; Ernzerhof, M. Generalized Gradient Approximation Made Simple. Phys. Rev. Lett. 1996, 77, 3865−3868.
(56) Perdew, J. P.; Burke, K.; Ernzerhof, M. Generalized Gradient Approximation Made Simple. Phys. Rev. Lett. 1997, 78, 1396.
(57) Broyden, C. G. The Convergence of a Class of Double-rank Minimization Algorithms. Part I. J. Inst. Math. Appl. 1970, 77, 76−90. (58) Broyden, C. G. The Convergence of a Class of Double-rank Minimization Algorithms. Part II. J. Inst. Math. Appl. 1970, 77, 222− 231.
(59) Fletcher, R. A. New Approach to Variable Metric Algorithms.
Comp. J. 1970, 13, 317−322.
(60) Goldfarb, D. A Family of Variable Metric Methods Derived by Variational Means. Math. Comp. 1970, 26, 23−26.
(61) Shanno, D. F. Conditioning of Quasi-Newton Methods for Function Minimization. Math. Comp. 1970, 24, 647−657.
(62) Jaffé, H. H.; Orchin, M. In Theory and Applications of Ultraviolet
Spectroscopy; John Wiley and Sons: New York, 1962; pp 233−235.
(63) Galasso, V.; Kovač, B.; Modelli, A.; Ottaviani, M. F.; Pichierri, F. Spectroscopic and Theoretical Study of the Electronic Structure of Curcumin and Related Fragment Molecules. J. Phys. Chem. A 2008,
112, 2331−2338.
(64) Khadem Sadigh, M.; Zakerhamidi, M. S.; Shamkhali, A. N.; Babaei, E. Photo-physical behaviors of various active forms of curcumin in polar and low polar environments. J. Photochem.
Photobiol., A 2017, 348, 188−198.
(65) Hibbert, F.; Emsley, J. Hydrogen Bonding and Chemical Reactivity. Adv. Phys. Org. Chem. 1990, 26, 255−379.
(66) Jeffrey, G. A. In An Introduction to Hydrogen Bonding; Oxford University Press: New York, 1997; Chapter 2, pp 11−32.
(67) Steiner, T. The Hydrogen Bond in the Solid State. Angew.
Chem., Int. Ed. 2002, 41, 48−76.
(68) McKenzie, R. H.; Bekker, C.; Athokpam, B.; Ramesh, S. G. Effect of quantum nuclear motion on hydrogen bonding. J. Chem.
Phys. 2014, 140, 174508.
(69) Emsley, J. The composition, structure and hydrogen bonding of the β-diketones. In Struct. Bonding (Berlin); Emsley, J., Ernst, R. D., Hathaway, B. J., Warren, K. D., Eds.; Springer: Berlin Heidelberg, 1984; Vol. 57, pp 147−191.
(70) Gilli, G.; Bellucci, F.; Ferretti, V.; Bertolasi, V. Evidence of Resonance-Assisted Hydrogen Bonding from Crystal-Structure Correlations on the Enol Form of the β-Diketone Fragment. J. Am.
Chem. Soc. 1989, 111, 1023−1028.
(71) Gilli, P.; Bertolasi, V.; Pretto, L.; Ferretti, V.; Gilli, G. Covalent versus Electrostatic Nature of the Strong Hydrogen Bond: Discrimination among Single, Double, and Asymmetric Single-Well Hydrogen Bonds by Variable-Temperature X-ray Crystallographic Methods in β-Diketone Enol RAHB Systems. J. Am. Chem. Soc. 2004,
126, 3845−3855.
(72) Grabowski, S. J. What Is the Covalency of Hydrogen Bonding?
Chem. Rev. 2011, 111, 2597−2625.
(73) Pople, J. A.; Beveridge, D. L. In Approximate Molecular Orbital
Theory; McGraw-Hill Book Company: New York, 1970; Chapter 4,
pp 110−113.
(74) Fleischer, E. B.; Sung, N.; Hawkinson, S. The Crystal Structure of Benzophenone. J. Phys. Chem. 1968, 72, 4311−4312.
(75) Larsen, N. W. Microwave Spectra of the Six Mono-13 C-Substituted Phenols and of Some Monodeuterated Species of Phenol. Complete Substitution Structure and Absolute Dipole Moment. J.
Mol. Struct. 1979, 51, 175−190.
(76) Tsuzuki, S.; Houjou, H.; Nagawa, Y.; Hiratani, K. High-Level ab Initio Calculations of Torsional Potential of Phenol, Anisole, and o-Hydroxyanisole: Effects of Intramolecular Hydrogen Bond. J. Phys.
(77) Dorofeeva, O. V.; Shishkov, I. F.; Karasev, N. M.; Vilkov, L. V.; Oberhammer, H. Molecular structures of 2-methoxyphenol and 1,2-dimethoxybenzene as studied by gas-phase electron diffraction and quantum chemical calculations. J. Mol. Struct. 2009, 933, 132−141.
(78) Siskos, M. G.; Choudhary, M. I.; Gerothanassis, I. P. Hydrogen Atomic Positions of O-H···O Hydrogen Bonds in Solution and in the Solid State: The Synergy of Quantum Chemical Calculations with1 H-NMR Chemical Shifts and X-ray Diffraction Methods. Molecules 2017, 22, 415.
(79) Berglund, B.; Vaughan, R. W. Correlations between proton chemical shift tensors, deuterium quadrupole couplings, and bond distances for hydrogen bonds in solids. J. Chem. Phys. 1980, 73, 2037−2043.
(80) Kaliaperumal, R.; Sears, R. E. J.; Ni, Q. W.; Furst, J. E. Proton chemical shifts in some hydrogen bonded solids and a correlation with bond lengths. J. Chem. Phys. 1989, 91, 7387−7391.
(81) Bertolasi, V.; Gilli, P.; Ferretti, V.; Gilli, G. Intramolecular O-H···O hydrogen bonds assisted by resonance. Correlation between crystallographic data and 1H NMR chemical shifts. J. Chem. Soc.,
Perkin Trans. 2 1997, 2, 945−952.
(82) Siskos, M. G.; Choudhary, M. I.; Gerothanassis, I. P. Refinement of labile hydrogen positions based on DFT calculations of 1H NMR chemical shifts: comparison with X-ray and neutron diffraction methods. Org. Biomol. Chem. 2017, 15, 4655−4666.
(83) Harris, R. K.; Jackson, P.; Merwin, L. H.; Say, B. J.; Hägele, G. Perspectives in High-resolution Solid-state Nuclear Magnetic Resonance, with Emphasis on Combined Rotation and Multiple-pulse Spectroscopy. J. Chem. Soc., Faraday Trans. 1 1988, 1 (84), 3649−3672.
(84) Emmler, Th.; Gieschler, S.; Limbach, H. H.; Buntkowsky, G. A simple method for characterization of OHO-hydrogen bonds by1 H-solid state NMR spectroscopy. J. Mol. Struct. 2004, 700, 29−38.
(85) Jeffrey, G. A.; Yeon, Y. The Correlation Between Hydrogen-Bond Lengths and Proton Chemical Shifts in Crystals. Acta
Crystallogr., Sect. B: Struct. Sci. 1986, B42, 410−413.
(86) Péret-Almeida, L.; Cherubino, A. P. F.; Alves, R. J.; Dufossé, L.; Glória, M. B. A. Separation and determination of the physico-chemical characteristics of curcumin, demethoxycurcumin and bisdemethoxycurcumin. Food Res. Int. 2005, 38, 1039−1044.
(87) Kiuchi, F.; Goto, Y.; Sugimoto, N.; Akao, N.; Kondo, K.; Tsuda, Y. Nematocidal Activity of Turmeric: Synergistic Action of Curcuminoids. Chem. Pharm. Bull. 1993, 41, 1640−1643.
(88) Liddel, U.; Ramsey, N. F. Temperature Dependent Magnetic Shielding in Ethyl Alcohol. J. Chem. Phys. 1951, 19, 1608.
(89) Arnold, J. T.; Packard, M. E. Variations in Absolute Chemical Shift of Nuclear Induction Signals of Hydroxyl Groups of Methyl and Ethyl Alcohol. J. Chem. Phys. 1951, 19, 1608−1609.
(90) Muller, N.; Reiter, R. C. Temperature Dependence of Chemical Shifts of Protons in Hydrogen Bonds. J. Chem. Phys. 1965, 42, 3265− 3269.
(91) Grzesiek, S.; Becker, E. D. Hydrogen Bonding. eMagRes. 2011, DOI: 10.1002/9780470034590.emrstm0216.pub2.
(92) Modig, K.; Halle, B. Proton Magnetic Shielding Tensor in Liquid Water. J. Am. Chem. Soc. 2002, 124, 12031−12041.
Crystal Growth & Design
ArticleDOI:10.1021/acs.cgd.8b00859
Cryst. Growth Des. 2018, 18, 5556−5563