Publisher’s version / Version de l'éditeur:
Vous avez des questions? Nous pouvons vous aider. Pour communiquer directement avec un auteur, consultez la première page de la revue dans laquelle son article a été publié afin de trouver ses coordonnées. Si vous n’arrivez pas à les repérer, communiquez avec nous à PublicationsArchive-ArchivesPublications@nrc-cnrc.gc.ca.
Questions? Contact the NRC Publications Archive team at
PublicationsArchive-ArchivesPublications@nrc-cnrc.gc.ca. If you wish to email the authors directly, please see the first page of the publication for their contact information.
https://publications-cnrc.canada.ca/fra/droits
L’accès à ce site Web et l’utilisation de son contenu sont assujettis aux conditions présentées dans le site LISEZ CES CONDITIONS ATTENTIVEMENT AVANT D’UTILISER CE SITE WEB.
Building Research Note, 1981-04
READ THESE TERMS AND CONDITIONS CAREFULLY BEFORE USING THIS WEBSITE. https://nrc-publications.canada.ca/eng/copyright
NRC Publications Archive Record / Notice des Archives des publications du CNRC :
https://nrc-publications.canada.ca/eng/view/object/?id=3941a913-cb5c-43f7-8778-205553e8802f https://publications-cnrc.canada.ca/fra/voir/objet/?id=3941a913-cb5c-43f7-8778-205553e8802f
NRC Publications Archive
Archives des publications du CNRC
This publication could be one of several versions: author’s original, accepted manuscript or the publisher’s version. / La version de cette publication peut être l’une des suivantes : la version prépublication de l’auteur, la version acceptée du manuscrit ou la version de l’éditeur.
For the publisher’s version, please access the DOI link below./ Pour consulter la version de l’éditeur, utilisez le lien DOI ci-dessous.
https://doi.org/10.4224/40000540
Access and use of this website and the material on it are subject to the Terms and Conditions set forth at
Performance of the Meadowvale Solar System (October 1976 to April
1978)
PERFORMANCE OF THE MEADOWVALE SOLAR SYSTEM (OCTOBER 1976
TO
APRIL 1978)by
B . E . SZBBITT and H. J U N G
TNTRODUCTION
T h e Meadowvale Solar Experiment i n Mississauga, Ontario, was one o f t h e first houses i n Canada to u s e s o l a r energy f o r space a n d
(13
scrvFce na'tcr h e a t i n g
.
It was b u i l t in 1975 w i t h financial a s s i s - t a n c c from t h e Federal Government. The s o l a r h e a t i n g system was d c s i g n c d to meet 6 0 to 7 0 per cent of t h e t o t a l space and servicewater h e a t i n g demand of a single-family home under Canadian climatic
conditions. F e a t u r e s of t h i s s o l a r h e a t i n g system include a s o l a r -
a s s i s t e d heat pump, semi-seasonal dual h e a t storage tanks, and o f f -
]leak e l e c t r i c a l heating o f storage water. The l a t t e r f e a t u r e was
121
added i n December 1977.
Thc Division o f Building Research of t h e N a t i o n a l Rcsearch Council of Canada h a s carried out a comprehensive monj.toring program
t o s t u d y t h c performance of t h e s o l a r h e a t i n g system and i t s associated
subsystems from October 1976 to A p r i l 1978 (3,4,5.6,7) T h i s paper constitutes the f i n a l monitoring r e p o r t on this project and d e s c r i b e s
t h e results o b t a i n e d and the problems encountered over t h e f u l l moni-
t o r i n g aeriod. The r e p o r t i n g format employed is based on t h a t recommended
DESCRIPTION OF THE ENVIRONMENT 1,ocat ion
Mis.;issaupa i s s i t u a t e d at 43' 45'N latitude, 79' 301W I o n p i r u d e ,
a t an altitude of 120 m above sea l e v e l . It i s a suburban town
located approximately 30 km sauthwest of Toronto, O n t a r i o . The
terrain is f l a t , and t h e air is f r e e of industrial pollution.
C l imatc
Rie r e g i o n has a humid continenTal climate with cool summers and e v e n l y distributed precipitation t h r o u g h o u t the year. Trewar-
t h n 1 8 classification f o r Toronro, Ontario, i s DBF. The r e g i o n
r c c c i v c s a mean total precipitation of 790 mmlyear, including a mean
annV31 snowfall of 141 cm/year, The mean annual duration of b r i g h t s u n s h i n e
is 2045 hours; a s a percentage of the maximum possible aver t h e whole year b r i g h t s u n s h i n e hours c o n s t i t u t e 45 per cent.
S o l a r Radiation, Ambient Temperature and Wind
-
Table I l i s t s t h e monthly means of d a i l y meteorological values at Toronto International Airport, about 16 km east of the house.
Includcd are fractions of maximum possible sunshine hours, mean daily
total a n d d i f f u s e insolation values on a horizontal surface, mean
ambient dry-bulb temperature, h e a t i n g degree d a y s p e r month, mean wind velocity and Albedo.
IIESCRTPTION OF
BUILDING AND
SYSTEMSB u i l d i n g
F i g u r e 1 shows t h e s o u t h face of t h e single-family detached 2
housc which h a s 135 rn of t o t a l l i v i n g area on two f l o o r s . I t a l s o h a s a heated f u l l basement and an unheated attached garage.
The e n t i r e s o u t h f a c e of the first f l o o r consists of double-glazed windows and an atrium. The house walls are i n s u l a t e d with e i t h e r
7 . h cm of polystyrene insulation or I S cm o f g l a s s fiber insulation; t h e ceiling is i n s u l a t e d w i t h 20 cm of glass f i b e r insulation. I n
thc f i r s t f l o o r l i v i n g room, there i s a fireplace w i t h a double- w a l l c d f i r e b o x d e s i g n e d to p r e h e a t incoming outdoor a i r . The house h e a t l o s s factor in t h e original design was taken as 260 W/K.
Solar Heating System
Figure 2 i s a schematic of the Meadowvale solar h e a t i n g system.
A description o f t h e major s y s t e m components i s given in Table IT.
Thc solar heating system was designed primarily for space h e a t i n g . The service water pre-heating system operates o n l y in t h e
s p r i n g , summer and early f a l l , d u r i n g which time solar energy is a l s o b e i n g stored f o r space h e a t i n g .
The f l a t - p l a t e collector array has a t o t a l s u r f a c e area of 2
6 4 . 4 m , and is mounted a t an a n g l e of 60" from rhe horizontal on
t h e south-facing roof. Water is t h e heat t r a n s p o r t medium in b o t h
t h c collection and heat distribution circuits. The collector pump
circulates w a t e r from s t o r a g e through the collector a r r a y whenever
thc d i f f c r e n t i a l temperature between t h e c o l l e c t o r p l a t e and storage t a n k watcr exceeds ~ O C , and s h u t s off when t h e r e t u r n w a t e r temperature
d r o p s tsclon t h e s t o r a g e t a n k water temperature. TFlc collector a r r a y a u t o m a t i c a l l y d r a i n s down f o r f r e e z e protection whenever i t s circula-
Thc s o l a r energy collected i s s t o r e d
i n
18 m3 of water dividedbetween two c o n c r e t e tanks situated in one corner o f t h e basement.
Both t a n k s are i n s u l a t e d on t h e t o p and sides, but are n o t i n s u l a t e d on t h e bottom, which i s about 1 m below the basement f l o o r . The
tl~esmal resistance values are; 8 . 6 f o r t h e covers, 4 . 2 f o r w a l l s cxposcd t o indoor conditions, and 6.9 f o r t h e walls adjacent to t h e c s t e r i o r basement walls ( a l l values are in a 2 - ~ / ~ ) .
The t a n k s are connected so as to operate at two temperature Lcvcls. Selcctor valves permit collector return water t o e n t e r c i t h e r t a n k and h e a t i n g water t o be d r a m from e i t h e r tank. I n
u s e , tank number 2 supplied t h e collection circuit and the heated
watcr was r e t u r n e d to tank number 1. Tank 1 was used to s u p ~ l y
t h e h e a t distribution circuit because it operated at: a h i g h e r tempe- r ; ~ t u r c t h a n tank 2 .
Spacc H e a t i n g Subsystem. - The space h e a t i n g subsystem c o n s i s t s o f
t w o t h e r m a l s t o r a g e tanks, a water-to-air h e a t exchanger, a water-
t o - a i r h e a t pump, an a i r distribution system and pump, valves,
piping and associated controls. Space heating is controlled by
a two-stage t h e r m o s t a t . When t h e r e i s a demand, s o l a r space h e a t i n g
can be a c c o r n p ~ i s h c d i n e i t h e r of two modes; d i r e c t l y or by t h e h e a t pump. Whcn the storage water temperature i s above 4 5 ' ~ , s t o r a g e
water i s r o u t e d directly t o a water-to-air heat exchanger, and heats t h e circulating air i n the hot air d i s t r i b u t i o n circuit. The water
flow is diverted f r o m t h e heat exchanger to a water-to-air heat
0
pump whenever the s t o r a g e water temperature i s below 45 C, on thc
assumption that dircct heating with 4 5 ' ~ water could c r e a t e occupant d i scornfort.
- 5 -
The h e a t pump extracts heat from the s t o r a g e warer, and discharges
heat at a h i g h e r temperature to t h e hot a i r d i s t r i b u t i o n c i r c u i t . h
mixing valve tempers t h e h o t storage water with t h e cold r e t u r n to
p r o v i d e the heat pump with water w i t h i n i t s required temperature
range of 15't to 3 0 ' ~ . When t h e storage water temperature drops below
1 5 ' ~ , t h e s o l a r space h e a t i n g system is shut o f f and
an
electrical resistance Sackup h e a t e r in t h e air distribution system supplies t h e t o t a l space h e z t i n g load.I n December 1977, the e l e c t r i c a l backup a i r h e a t e r was replaced
with an e l e c t r i c water h e a t e r t o take advantage of off-peak electric h e a t i n g . Electrical heat is added to storage tank 1 between m i d n i g h t
and 6 a.m. whenever the tank temperature drops below 3 3 ' ~ . T h i s
cnsurcs sufficient space h e a t i n g capacity in t h e h e a t pump mode f o r
t h e following day.
Service Water Heating Subsystem. - The s e r v i c e water heating subsystem
3
c o n s i s t s o f a 0.45 n preheat tank and conventional 0.27 m3 electric 130t water h e a t e r and tank. Hot water from the main solar storage t a n k is pumped t o an immersion heat exchanger in t h e preheat tank whenever t l ~ c preheat tank temperature drops below 4 3 ' ~ . In this way
c o l d feed water is preheated in t h e solar heated tank and piped into t h e e l e c t r j c h o t water h e a t e r which ~ a i s e s the water t o the desired discharge temperature of 4 3 ' ~ .
Monitoring System Description
The m o n i t o r i n g system included a Kaye Data Acquisition System 8 0 0 0 w i t h a magnetic tape r e c o r d i n g unit, a s e t of i n t e g r a t i n g heat
and power transducers. The measurements taken by t h i s equipment
a r e listed i.n T a b l c I11 and sensor locations a r e shown in Figure 2 .
From O c t o b e r 1976 through March 1977 m o n i t o r i n g of t h e solar
h e a t i n g system was done with t h e electric eneTgy meters and t h e
Siemens i n t e g r a t i n g h e a t meters, which were usually r e a d once a
d:iy. The Siemcns meter i n t e g r a t e d t h e product of electrical signals from a displacement water f l e w meter
and
a thermopile t h a t measured the flow t h r o u g h , and the temperature d i f f e r e n c e across, an energy s o u r c e or an energy consumer.F r o m A p r i l 1977 t h r o u g h April 1978 t h e Kaye d a t a l o g g e r was
used to automatically r e c o r d d a t a on magnetic tape every f i v e minutes. Shutdown o f t h i s monitoring system occurred frequently due to mornen- t a r y interruptions i n the electrical power service to t h e house.
An Epplcy pyranometer mounted at the same angle as t h e collector a r r a y measured thc t o t a l d i r e c t and d i f f u s e solas r a d i a t i o n . A model LO was originally i n s t a l l e d , b u t was replaced w i t h a model 8-48 on 9 March 1 9 7 8 .
The contribution o f the fireplace to space h e a t i n g was n o r measured directly.
An indication of t h e measurement accuracy estimated for t h e monitoring instrumentation is g i v e n in Appendix A .
SYSTEM THEliMAL PERFORhfAMCE SUMMARY
System thermal performance data a r e presented using t h r e e time s c a l e s ; h o u r l y , d a i l y and monthly. The monthly summary d a t a a r e presented here a l o n g w i t h some examples of hourly d a t a . D a i l y dntn, tabulated by month for t h e period April 1977 to April 1978 a r e
i n Appcndix A .
The hourly data supply details of system temperature and energy p r o f i l e s while t h e monthly data display seasonal variations i n system b e h a v i o r . The d a i l y tables contain day by day performance infomatierl
and are the b a s i s for the monthly data.
Space Ileating Subsystem [Winter Ope~ation)
Hourly temperature and power p r o f i l e s f o r operation in t h e direct a n d h e a t pump space h e a t i n g modes a r e shown i n F i g u r e 3 and 4
respectively. The average storage water temperature during t h e direct
h c a t i n g mode cxample (23 t o 26 March 1978) was 3 8 . 9 ' ~ ;
ir
was o n l y2 8 . h O c d u r i n g t h c heat pump mode example (1 to 4 January 1 9 7 8 ) .
With the exception of t h e energy required to r u n t h e pumps and f a n s ,
The s o l a r system was able to supply the t o t a l space h e a t i n g load from storage i n t h e direct heating mode example and 68 p e r cent in t h e heat pump mode example [i. e., a c o e f f i c i e n t o f performarlce of 5.1).
The temperature of tank 1 e x h i b i t e d a characteristic d r o p whcncvcr t h e s o l a r collection circuit p p w a s t u r n e d on in the morning. The drop i n tank 1 temperature was due t o e n t r y o f cooler
water drawn from tank 2 and circulated t h r o u g h t h e collectors. The
temperature r i s e across t h e collectors during the morning h o u r s was
l e s s than the temperature d i f f e r e n c e between t h e two t a n k s and,
consequently, t a n k 1 was cooled. A t t h e same t i m e , tank 2 w a s warmed by t h e water flawing from t a n k 1 to tank 2. During the non-collection
h o u r s , t h e temperature i n tank 2 g ~ a d u a l l y dropped a s warm watcr was
extracted from t a n k 1, passed through the direct h e a t i n g c o i f o r t h e h e a t pump evaporator, and r e t u r n e d t o t a n k 2 a s cooled w a t e r .
- 8 -
T h c temperature profiles for tank I i n F i g u r e s 3 and 4 d i f f e r e d
s i g n i f i c a n t l l r because t h e o f f - p e a k e l e c t r i c h e a t e r was t u r n e d on
betwccn m i d n i g h t and 6 a . m - whenever tank 1 temperature dropped below
3 3 ' ~ , a n d it continued to operate until i t had raised the tank I
tenpcrature above 3 3 ' ~ . The r e s u l t i n g s h a r p r i s e in tank 1 temperature a f t e r midnight i s only a p p a r e n t in Figure 4 when operating w i t h t h c
h e a t pump.
The increase i n i n d o o r temperature on b r i g h t sunny days due to
passi-ve s o l a r h e a t i n g i s evident in b o t h Figures 3 and 4 . The s o l a r
e n e r g y e n t e r i n g t h e s o u t h f a c i n g windows on b r i g h t sunny days w a s
sufficient to h e a t the e n t i r e house f o r several h o u r s around noon, i n
January as well a s March. Initially, passive solar heat gain caused minor
overheating i n t h e rooms with s o u t h facing windows. The problem was
subsequently c o r r e c t e d by o p e r a t i n g t h e c e n t r a l h e a t i n g f a n to distribute the h o t a i r to Che remainder o f t h e house.
Scrvicc Water Heating Subsystem (Summer Operation)
F i g u r c 5 shows t h e hourly values of storage tank temperatures, s o l a r collection, and s o l a r energy supplied to the s e r v i c e water
h e a t i n g s y s t e m over a seven-day period in July 1977. The t o t a l scrvice water h e a t i n g demand f o r t h i s period was 295 M J , of which
hO p e r c e n t was supplied by s o l a r energy and the r e m a i n i n g 4 0 p e r
c e n t 11y thc e l e c t r i c hot water h e a t e r . Over the same period the
amount of s o l a r energy collected was 1468 MJ, which was 28 p e r c e n t o f t h e total s o l a r energy i n c i d e n t on the collector array. 'fie n c t
increase i n s t o r e d energy i n t h e t w o t a n k s was 105 MJ resulting in
0
therefore, 80 per c e n t of t h e t o t a l solar energy collected was
lost t o t h e surroundings.
Ovcr-all System
A summary o f t h e system performance from October 1976 t o A p r i l 1978 i n terms of t h e monthly mean d a i l y values for each month of
m o n i t o r i n g i s given i n T a b l e s
TV
a E b ,F i g u r e 6 shows the heat balance f o r t h e s t o r a g e subsystem from
October 1976 to April 1978 based on monthly mean daily energy values.
T h e energy from storagc contributing to space heating is n o t equivalent t o t h e solar contribution to space heating from December 1977 through
April 1 9 7 8 . During t h i s p e r i o d , t h e storage water w a s h e a t e d by t h e
s o l a r c n e r g y collected and by the aff-peak electrical h e a t e r . The
monitored value of energy supplied to the space h e a t i n g system from s t o r a g e , t h e r e f o r e , c o n s i s t e d o f electrical as well as s o l a r energy.
'Ille end-of-month values o f the average temperature o f t h e two
storage tanks are a l s o plotted on Figure 6 . A control malfunction
t h a t circulated f l u i d continuously through t h e collectors from 26
August 1977 to 5 September 1977, dropped t h e tank temperature from
6z0c t o 50.3°~.
F i g u r c 7 s h o w s t h e total h e a t i n g load profile from October 1976
t o A p r i l 1978. The solar contribution during r h i s period, w a s
a p p r o x i m a t e l y 4 1 p e r c e n t of t h e total spscc and service warcar. h e a t i n g r v r l k l i r r m e r r t which was less than the d e s i g n goal of G O t o 70 I,cr c p j l t .
Ilrc s o l a r contsibution t o t h e space h e a t i n g requirement was 51 p e r c e n t arid t h c s o l a r c o n t s i b u t i o n to t h e service u i l t c r ~ c q u i r c m c n t was 13 pcr cent.
-
10-
The low s o l a r c o n t r j - b u t i o n to s e r v i c e water h e a t i n g was partially d u e t o the failure o f t h e pum-p s t a r t e r s w i t c h c i r c u i t which prevented s o l a r s e r v i c e water prcheating from August 1977 to November 1977; and was also d u e t o t h e operational mode t h a t eliminated service water p r c h e a t i n g d u r i n g the winter months
in
favour of space heating. Thesolas system provided 55 p e r cent o f the service water heating requirement when it was contributing t o the service water system.
One i m p o r t a n t f a c t o r t h a t adversely a f f e c t e d thc performance o f t h e s o l a r h e a t i n g system was the heat l a s s from t h e storage
t a n k s , e s p e c i a l l y from t h e uninsulated bottoms. From October 1976 to A p r i l 1978, the t o t a l heat Xass from storage was approximately 54 p e r cent of t h e t o t a l energy added to storage.
The minimum average d a i l y s t o r e d temperature w a s 1 2 ' ~ and
o c c u r r e d on 17 January 1977; t h e maximum temperature was BZOC and o c c u r r e d on 2 5 August 1977.
I n F i g u r e 8 t h e average power supplied by t h e space h e a t i n g
system on a d a i l y h a s i s is plotted a g a i n s t t h e d a F l y average temperature
difference between outdoor and indoor a i r f o r t h e 1977-78 heating s e a s o n , The s c a t t e r i n the d a t a is largely due to t h e v a r i a t i o n i n s o l a r radiation and occupancy effects including use o f t h e f i r e p l a c e . TIlc heat l o s s f a c t o r , r e p r e s e n t e d by t h e s l o p e ( 9 ) of the least squares
l i n e fit t o t h e d a t a shown in E i p r e 8a, i s 190 W/K. This indicates t h a t t h e t h e r m a l performance of t h e building envelope was a p p a r e n t l y b c t t e r t h a n t h e performance a n t i c i p a t e d i n t h e original desi.gn (i-e.,
260 W / K ) ,
- I 1 -
with up to 5 M J / I I I ~ i n c i d e n t s o l a r r a d i a t i o n and anothe-r group
nf days w i t h h i g h e r levels of solar radiation. The l e a s t squares l i n e s fit to both groups of d a t a i n d i c a t e t h a t on average about 1 Kllr
l c s s spacc h e a t i n g power was used
on
those days with moTe than 5 M J J m 2solar radiation. Since about 7 0 per cent of t h e h e a t i n g season days f c l l i n t o t h i s category, the average d a i l y benefit from passive solar g a i n was very roughly 65 M J .
The average daily energy supplied by t h e space h e a t i n g system
was approximaly 170 M J of which 89 M J was solar e n e r g y . The avcrage
d a i l y electrical consumption f o r lights and appliances w a s 104 M J
I l u r i n g t h e year May 197'7 to Apsil 1978 approximately 62,900 M.T ($524 at $ . 0 3 J k \ h ) were collected from 240,000 MJ incident on t h e s o l a r collectors. Solar energy d e l i v e r e d to t h e l o a d s amounted to 21,600 MJ
( $ B H O ) and t h a t l o s t from s t o r a g e was approxirnatcly 43 ,000 M.1.
S o l a r e n e r g y supplicd 18,900 M to t h e J n e t space h e a t i n g l o a d of
36,000 HJ. Solar energy provided 2700
MJ
of 18,200 M J supplied tot h e s e r v i c e wntcr heating subsystem. I t i s estimated t h a t passive
s o l a r g a i n s c o n t r i b u t e d roughly 14,060 MJ ($1151 to the g r o s s space h e a t i ng requirement.
SUBSYSTEM PERFOR11AKCE SUMMARY S o l a r Collection Sub?.-stem -
O v e r t h e 23 y e a r s o f operation, the solar collectors d i d not
experience any major problems related t o leakage, h o t spots, or
b r e a k a g e . 'rhcy d i d , however, experience recurring condensation
o n t h e inncr f a c e o f t h e cover g l a s s , c a u s i n g a r e s i d u e t o be lcft
on t h c i n s i d e of t h e g l a s s a f t e r t h e condensed water had evaporated. 'I71e c f f c c t of c o n d e n s a t j o n on collector performance h a s n o t been fully
d e t c r m i n e d . The moisture i n t h e collector d i d , however, cause c a r r o - s i o n of t h c temperature sensor on t h e absorber p l a t e , resulting in a
control malfunction w h i c h caused the collector pump T O operate continuously f r o m 26 August 1977 to 5 September 1977.
'rhc average collection e f f i c i e n c y between A p r i l 1977 and A p r i l
1 W 8 was 24 p e r c e n t , based on total available r a d i a t i o n . F i g u r e 9 shows two performance curves o f t h e Meadorwale s o l a r collectors.
CurxTc 1 was d c r i v e d from t h e instantaneous efficiency curve supplicd
h y t h e m a n u f a c t u r c r . Curve 2 i s t h e measured average d a i l y performance
t o determine the collector characteristics, FR ( ~ a ) and FRUL.*
Over the normal working range o f t h e collector parameter
2
T i H . .
,
0.04 to 0.08 m 'K/IV)' the d i f f e r e n c e between the <Ii n s t a n t a n e o u s curve and the measured collector array performance curve was a s much as 12 percentage points. This would s u g g e s t t h a t
an instantaneous e f f i c i e n c y curve should be used with caution when
d c s i g n i n g and sizing a solar h e a t i n g system.
S t o r a g c Subsystem
From March 1977 to March 1978, a period in which the initial and f i n a l average t a n k temperatures were nearly t h e same, t h e h e a t
l o s s from storage was approximately 60 per cent of t h e t o t a l solar
energy collected and off-peak electrical energy added. In the w i n t e r
months, it was estimated that about 4 p e r c e n t of the storage h e a t
loss went i n t o t h e basement from the tanks, t h e r e b y c o n t r i b u t i n g to space h e a t i n g .
*
FR (ra) and F U represent t h e maximum efficien0y;of t h e - c o l l e c t o r R Land i t s heat l o s s c h a r a c t e r i s t i c r e s p e c t i v e l y .
where
-ra = transmittance-absorptance product
F = h e a t removal f a c t o r
R
U = over-all heae l o s s coefficient
L
T. = collector inlet temperature
1
T = outdoor ambient temperature
a
Onc of t h e aims of t h c Mississauga s o l a r experiment was to
investigate t h e benefits derived from t h e use of d u a l storage t c ~ n k s . Thc improvements derived depend v e r y much on t h e heat l o s s c11ar;lctcrj s t i c o f t h e s o l a r collector used. A collector w i t h hig11
t t ~ c r m a l losscs would l l c n e f j t most from d u a l s t o r a g e t a n k s t l ~ a t provide xhc coldest possible water to the collector.
~ h c
following example
i sintended
t o show t h eimprovement in
collection achieved i n the Meadowale experiment with d u a l tanks. Consider t h e performance d a t a for 1 0 J u l y 1977. The avcrage values
oF t : ~ n k Z temperature, ambient temperature, and solar r a d i a t i o n h e a t
2
f l u x d u r i n g t h e collection period were 5 1 . 3 ' ~ , 2 1 . 3 ' ~ ~ and 548 \V/m ,
r e s p e c t i v e l y . The c o r r e s p o n d i n g collector parameter was 0.055 rnZ
.
K/W. :lccording to t h e measured curve i n Figure 9 , the average d n j l y e f f i - cicnc>. o f t h e collector array was 3 2 per cent. A reduction o f 2 ' ~ i n t a n k 2 tcmpcrature would have i n c r e a s e d t h e d a i l y efficiency to 3 3 pcrc c n t . From Nay 1977 t o April 1978, t h e m o n t h l y mean d a i l y temperature
d i f f e r e n c e between t h e t w o tanks averaged 2 ' ~ and seldom cxceeded 7 ' ~ .
{A temperature difference o f 1 4 . 5 ' ~ occurred on 20 December 1977, b u t
was Largely due to use of t h e off-peak heater.) To determine t h e worth
of t h e dual tanks rclative to a single tank, t h e increase i n collection
cfficjency must h e weighed against the added heat loss due t o a larger
storagc s u r f a c c area and t h e added csslt: of materials, piping and
c o n t r a l s
.
Sr~ace EIcatinr! Subsystem
"The controller f o r changing ovcr f r o m d i r e c t solar h e a t i n g mode
t o h e a t pump modc w e n t o u t o f adjustment d u r i n g the m o n i t o r i n g p e r i o d .
- J 5 -
of 4 5 ' ~ . By November 1977, however, t h e changeover had n o t o c c u r r e d
even though the storage temperature had f a l l e n to 3 3 O ~ . T h e indoor thermal environment d i d
n o t
s u f f e r at this low source temperature.As a result o f t h i s experience, the control was later s e t to changeover
3t
~ s ' c ,
permitting l o n g e r operation in t h e d i r e c t s o l a r heating mode. 'ale average coefficient of performance of the heat pump d u r i n gt h e monitoring p e r i o d was 3 . 1 . Heat pq operation allowed solar cncrgy t o c o n t r i b u t e t o space h e a t i n g as s t o r a g e water temperatures bclow 35'~. Operation o f t h e s y s t e m below this temperature resulted i n reduced storage heat l o s s ( e s p e c i a l l y important with a h i g h s t o r a g e loss system), and increased collected energy.
S e r v i c e Water Heating Subsystem
The subsystem was designed so t h a t h o t water was pumped from s o l a r storage sank 1 to a heat exchanger immersed in t h c preheat t a n k uhencvcr t h e p r e h e a t t a n k temperature dropped below 4 3 ' ~ . T h j s meant t h a t t h e preheat pump would have operated continuously when s o l a r sto-
T a g e t a n k 1 temperature was less t h a n 4 3 ' ~ . The p r e h e a t system was, therefore, p e r m i t t e d to operate only during the months when t h e main storage tank t m p e r a t u r e exceeded 4 3 ' ~ . The solar contribution to t h e scrvice water heating requirement of 55 p e r cent during t h e period
A p r i l t o J u l y 1 9 7 7 was p r o b a b l y limited by standby losses from t h e
s c r v i c e water h e a t i n g tanks and by t h e preheat exchanger performance.
'The a n n u a l s o l a r contribution to service water heating from A p r i l 1977 t o March 1978 was only 1 8 per c e n t . T h i s low annual s o l a r contribution was due to a long shut-down of t h e p r e h e a t i n g
s y s t e m i n l a t e summer and e a r l y fall caused by a control malfunction,
Off-Peak Electric Heating Subsystem
Off-peak e l e c t r i c hearing o f f e r s the a d v a n t a g e of u s i n g
cluctricity a t t h o s e times when conv~ntional e l e c t r i c a l demands a r e low. Tt h a s t h e potential, t h e r e f o r e , f o r reducing the peak capacity o f t h e electrical utilities. T h e merit o f such a hack-up e l e c t r i c
h e a t i n g s y s t e m may be marginal, however, when used w i t h a high-loss s t o r a g e subsystem.
The Meadowale storage subsystem lost about 20 per cent of t h e c n e r g y added to storage durlng the w i n t e r months. Because o f t h i s
h i g h storage l o s s , it was estimated t h a t t h e off-peak electric h e a t e r
consumed 17 per c e n t more electrical energy than a c o r ~ v e n t i o n a l
clectric back-up system to satisfy t h e same space h e a t i n g demand. Future Designs
Monitoring this solar system h a s made it apparent that a s i g n i f i - c a n t improvement i n t h e r m a l performance should b e p o s s i b l e by making
some relatively minor changes to t h e system d e s i g n .
The mosr significant of t h e s e would be t h e reduction of t h e sto- r a g e subsystem h e a t l ~ s s . It i s estfmated that a n i d e a l i z e d storage t a n k ( a r i g h t circular cylinder with no p i p i n g connections), insulated
2
t o R R . 5 (m * K / M ) , located in a room at 2 0 O ~ and operated a t t h e sane temperature as t h e Meadowvale s t o r a g e tanks, would have an average
Jnily h e a t loss o f l e s s t h a n 1 0 M J . This is approxim:ltely one t p n t h
oi' tirc observed avcrage d a i l y l o s s o f 106 MJ. T'hc rrduced t n n l i Io.-r; 1 1 i llcrease tank temperature. T h i h i g h e r tank temperature would make
II!C?I-C energy avai1;lble to t h e laads b u t it would a l s o reduce c-ullt-cI ion
- 1 7 -
D u r i n g t h e monitoring p e r i o d the changeover from dlrect s o l a r
h c a t i n g mode to h e a t pump mode was controlled by tank 1 temperature
h c i n g c i t h e r g r e a t e r than o r less t h a n a preset: temperature. Since
t31c set-point temperature must h e chosen f o r peak h e a t i n g l o a d condi-
t i o n s , it will u s u a l l y be higher than necessary. The use of a two-
stage thermostat to control the changeover should allow a larger
l j r a p o r t i o n of t h e h e a t i n g energy to be delivered in t h e d i r e c t mode
t t l e r c l ~ y increasing the solar energy contribution.
S i z i n g the water to a i r heat exchanger to c a r r y the load down
to a 30'~ e n t e r i n g water temperature would eliminate t h e need for the
c o n t r o l s and hardware which are used to temper water e n t e r i n g the
h ~ a t pump t o this temperature. The main b e n e f i t of this change would
be t h e system simplification and associated c o s t r e d u c t i o n .
The a n n u a l s o l a r contribution t o t h e service water hcating r e q u i -
rement could be improved by changing t h e system control to one that
activatres the p r e h e a t pump whenever the preheat tank temperature falls
below t a n k L temperature. A r e d u c t i o n in t h e heat l o s s from t h e main storage tanks would a l s o improve the contribution to service water
heating. Although not i n keeping w i t h t h e original design concept
of t h e Meadowvale solar experiment, preferentially supplying s o l a r
cncrgy to t h e service water heating system should increase t h e over-
a l l utilization of t h e s o l a r h e a t i n g system even though t h e solar
encrgy d e l i v e r e d to space may be reduced slightly.
I d e a l l y , the s e r v i c c water heating system should have sufficient
h e a t exchange capacity to maintain t h e preheat water temperature
c l o s c t o t h e source temperature. It should also be designed to
n ~ i ~ i i i ~ : i ~ . r s t n v d b y losses and allow the solar system to make u p these losses.
'The bleadowvale Solar Experiment h a s been s u c c e s s f u l in providing much u s e f u l i n f o r m a t i o n on the performance o f a solar system and i t s components i n t h e Canadian climate. Over a period o f 1 9 months, from Octohcr 1876 t h r o u g h April 1978, t h e s o l a r h e a t i n g system performed
s : l t i s f ; i c t o r i l y , but t h e performance could be improved significantly by seducing t h e s t o r a g e h e a t l o s s , and making o t h e r syscern d e s j g n
ch:~ngc*s. T h j s solar h e a t i n g system is considered to h e an e a r l y
prototype, and as such, an economic analysis b a s e d on i t s c o s t and
pcrfol-mance would be inappropriate. Information o b t a i n e d by ~ n o n i t a r i n g
t h i s systcm indicates t h a t f u t u r e designs w i l l deliver more u s c f u l
c n c r g y w h i l e employing significantly l e s s hardware.
T h e authors gratefully acknowledge t h e contributions o f
REFERENCES
D.P.
Lorriman. Mississauga Solar House Development P r o j e c t . Paper 111-37, Proceedings of t h e SESCI Conference, The Potential of S o l a r Energy f o r Canada, O t t a w a , Ontario, 1975.. J , M . B e l l , 0. Lorriman. Off-Peak Electrical Backup Experience
.in t h e Meadowvale Solar Experiment. Paper 3 - 1 - 7 , Vol. I ,
P r o c e e d i n g s of t h e SESCI Conference, Renewable Alternatives,
London, O n t a r i o , August 1978.
J . K . S a s a k i . Mississauga Solar House, P r o c e e d i n g s of t h e CCMS/ISES Conference on the Performance of Solar Heating and Cooling Systems, Dusseldorf, West Germany, April 1978.
B . E . Sibbitt, H . Jung and D. Lorriman. Performance of the
Meadowvale Solar Home. Paper 3-1-6, Vol. 1, Proceedings of t h e SESCI Conference, Renewable Alternatives, London, O n t a r i o , August 1978.
I,. Lorsiman. Meadowvale Solar Experiment Performance Kcpert.
Paper CI28Mpm14, Proceedings of t h e SESCI Conference, Solar Energy Updatc ' 7 7 , Edmonton, Alberta, 1977.
D. L ~ r r d m a n . F i r s t Annual Repart, Meadowvale Solar Experiment Monitoring Program. C o n t r a c t No. 932-556J0621, March 3 1 , 1978.
D. Lorsiman. Second Annual Report, Meadowvale Solar Experiment Monitoring Program. C o n t r a c t No. 032-556/0621, February, 1979. C.T. Trewartha. An Introduction to Climate. McGraw-Hill
Book Company, Toronto, 1968.
W.C. Brown. Mark
XI
Energy Research P r o j e c t , Comparison ofS t a n d a r d and Upgraded Houses. National Research Council of Canada, D i v i s i o n o f Building Research, Building Research Note 160, June 1980.
T a b l e I 1 S o l a r System S o l a r C o l l e c t o r Total g r o s s a r e a T o t a l a p e r a t u r e a r e a T h e r m a l p e r f o r m a n c e a s s u p p l i e d b y m a n u f a c t u r e r F " T C X ] , F I U L C o v e r A b s o r b e r a n d t u b e s I n s u l a t i o n S t o r a g e B u m b e r o f tanks D i m e n s i o n s o f e a c h t a n k T o t a l volume o f w a t e r in two t a n k s I n s r i l a t i o n 0 . 7 6 , 6 . 3 5 w/~'-K 0 . 7 3 , 6.1 w / r n 2 ~ # S i n g l e s h e e t , law-iron g l a s s C o p p e r , with s e l e c t i v e c u p r i c o x i d e c o a t i n g 6 . 3 em glass f t b e r 2 2 . 7 6 rn x 1 . 3 1 m x 2 . 7 4 m d e e p 18 m 3 1 0 crn p o l y u r e t h a n e a r o u n d a l l s i d e s ( R = 4 . 2 ) , a d d i t i o n a l 7 . 6 c m p o l y s t y r e n e b o a r d s ( R = 2 - 6 ) a d j a c e n t t a e x t e r i o r wall; 2 3 crn g l a s s - f i b e r p l u s 7 . 6 c m p o l y s t y r e n e b o a r d o n t o p ( R ~ 8 . 6 r n 2 * K / w ) B e a t T r a n s f e r S u b - S y s t e m s S p a c e h a t i n g h e a t e x c h a n g e r !Ica t p u m p { w a t e r - t o - a i r ) 4 row w a t e r s o i l with c a p a c i t y t o r a i s e 0 . 5 m 3 / s o f a i r f r o m 2 4 O C to 4 3 . 3 O ~ with 0 . 6 4 l / s o f w a t e r e n t e r i n g a t 4 9 " ~ 15 k w h e a t i n g c a p a c i t y w i t h 0 . 5
m v s
o r a i r e n t e r i n g a t 2 4 O ~ a n d 0 - 6 411s
of w a t e r e n t e r i n g at 15 . ~ O C A u x i l i a r y E l e c t r i c Heaters S i d e - a r m h e a t e r (tank I) S e r v i c e - w a t e r h e a t e r 2 0 kW c a p a c i t y 4 . 5 kW c a p a c i t yT a b l e
I11
Meadowvale S o l a r E x p e r i m e n tMeasurements
Siemens H e a tFlow
M e a s u r e m e n t s
?-
s o l a r e n e r g y c o l l e c t e d - e n e r g y from s t o r a g e to t h es p a c e
h e a t exchanger a n d heat pump-
e n e r g y from
s t o r a g e
to
t h eservice-water
p r e h e a t t a n k E l e c t r L c a l E n e r g y Measurements - h e a t p u m p c o m p r e s s o r a n d f a n-
resistance
s p a c e
h e a t e r-
service water h e a t e r-
t o t a l
consumedin the
h o u s eKave
8 0 0 0Measurements
Temperatures - t h e r m o c o u p l e s-
t o p o f t a n k 81-
t o p o ft a n k
#2 - m i d d l e o ftank
/I1-
m i d d l e o f tank 8 2 -bottom of tank 81
-
bottom
of
tank
#2
-
i n d o o r - outdoes-
c o l l e c t o r s u p p l ywater
-
c o l l e c t o rr e t u r n w a t e r
-
s p a c e h e a t i n gc i r c u i t
s u p p l ywater
-
s p a c eh e a t i n g
c i r c u i t r e t u r n water-
service-water
h e a t exchanger s u p p l ywater
-
service-water h e a t e x c h a n g e rr e t u r n water
D i f f e r e n t i a l Temperatures
-
t h e r m o p i l e s-
r i s eacross
t h e c o l l e c t o r-
d s o p a c r o s s t h e s p a c e heatingc i r c u i t
- d r o p across t h e service-water h e a t i n g
circuit
R a d i a t i o n a n d Pump E n e r g i e s
- t o t a l s o l a r r a d i a t i o n incident on
plane
o f c o l l e c t o r sm-A -a r o w -d la C sl m - A rd
=
a m u = + aPUMP
"
INSERVlCEFROMQECEMBER1977*' REMOVED FROM SERVICE I N DECEMBER 1977
F I G U R E 2
50LAR COLLECTION SOLAR 6 NC 1 DENT
SOLAR C OPLECTED
SOLAR TO
SPACE
HZAT I NGIN DIRECT MODE
MAR 2 3
M A R
24 MAR 25 M A R 26 1978F I G U R E 3
A V E R A G E H O U R L Y V A L U E S OF T E M P E R A T U R E A N D P O W E R I N THE
D I R E C T
S P A C E H E A T I N G M O D ESOLAR INCIDENT
SOLAR COLLECTED
TOTAL (STORAGE & HEAT
PUMP)
LOAD MET B Y STORAGE ! SOLAR &
J A N 1 J A N 2 J A N 3
A V E R A G E H O U R L Y V A L U E S O F T E M P E R A T U R E AND
0
( a ) A L L D A T A
7
h
I
3
I
I
1
I
1
- -0- DAl LY l NCl DENT SOLAR RAD l AT1 ON
c
5 M J / ~ '-
DAILY I N C I D E N T S O L A R R A D ~ A T ~ O N > ~ M ~ / ~ ~ --
--
-
-
-I
A V E R A G E D A l L Y l N D O O R TO O U T D O O R T E M P E R A T U R E D I F F E R E N C E , KI
I
1
I
1
I b ) EFFECT O F S O L A R R A D I A T I O N I N T E N S I T Y-
AVERAGE HEAT LOSS FACTOR = SLOPE = 190 W/K- - - - + - - 1 1
I
F I G U R E 8 S P A C E H E A T I N G P O W E R , 1977-78 H E A T I N G S E A S O NM A N U F A C T U R E R ' S I N S T A W T A N E O U S C O L L E C T O R E F F l C I E N C Y C U R V E 8 0
---
M E A S U R E D A V E R A G E D A I L Y C O L L E C T O R A R R A Y E F F I C I E N C Y C U R V Ese
-
60 C O L L E C T O R P A R A M E T E R > 0 Z W-
T, A M B I E N T T E M P E R A T U R E C)-
H S O L A R I R R A D I A T I O N 40 LL W 20
0 F I G U R E 9 C O L L E C T O R E F F lC
I E N C YAPPENDIX A
DAILY
PERFORMANCE
SUMMARYA d e s c r i p t i o n and expected error of solar system and environmen-
l a 1 parameters i s contained in Table A l . Tables of mean and integrate^'
d a i l y v a l u e s of t h e s e parameters follow in Table 62 t h r o u g h A14. The
t a b l e s cover t h e period, April 1977 to April 1978, when t h e Kaye d a t a i ~ c q u i s i t i e n system w a s the prime source of recorded d a t a . Monitoring
system shutdown occurred q u i t e f r e q u e n t l y because of momentary e l e c t r i c
3 u w e r i n t e r r u p t i o n s and, consequently, t h e r e were s e v e r a l days w i t h no
monitored data or w i t h incomplete data. Only those d a y s with more thai:
21.5 h o u r s of monitored data a r e
shown
i n
the t a b l e s . The monthly meand a i l y q u a n t i t i e s t a b u l a t e d are based on t h e average of o n l y those days shown.
Negative v a l u e s o f s o l a r energy collected were due to operation
of t h e collector pump when t h e collector return water temperature was l e s s than the supply temperature. Such o p e r a t i o n occurred a t the begin- n i n g and cnd o f some d a i l y collection p e r i o d s and r e s u l t e d in dissipa-
t i o n of stored energy to outdoors.
The t a b u l a t e d values o f s o l a r energy collected from 26 A u g u s t
1977 t o 5 September 1977 were
lower than
they should have been due t o a c o n t r o l malfunction caused by corrosion of t h e temperature sensor on t h e absorber p l a t e . Because o f this control malfunction, t h ecollection pump operated continuously over an eleven-day p e r i o d ,
d i s s i p a t i n g energy from storage at night and d u r i n g overcast days. The absence of s o l a r service water p r e h e a t i n g d u r i n g the late summer and fall of 1977 was due t o t h e failure of a starter s w i t c h
A 2
i n d i c a t o r light for the service water h e a t i n g p m p on 22 July 1977. The f a u l t was not c o r r e c t e d until mid-October when it was decided to leave the service water p r e h e a t i n g system turned off.
The electric kWh meter measuring t h e service water electrical consumption was inoperable for the entire month of April 1978. An estimated v a l u e o f 51.8 MJ/day was, t h e r e f o r e , introduced in t h e
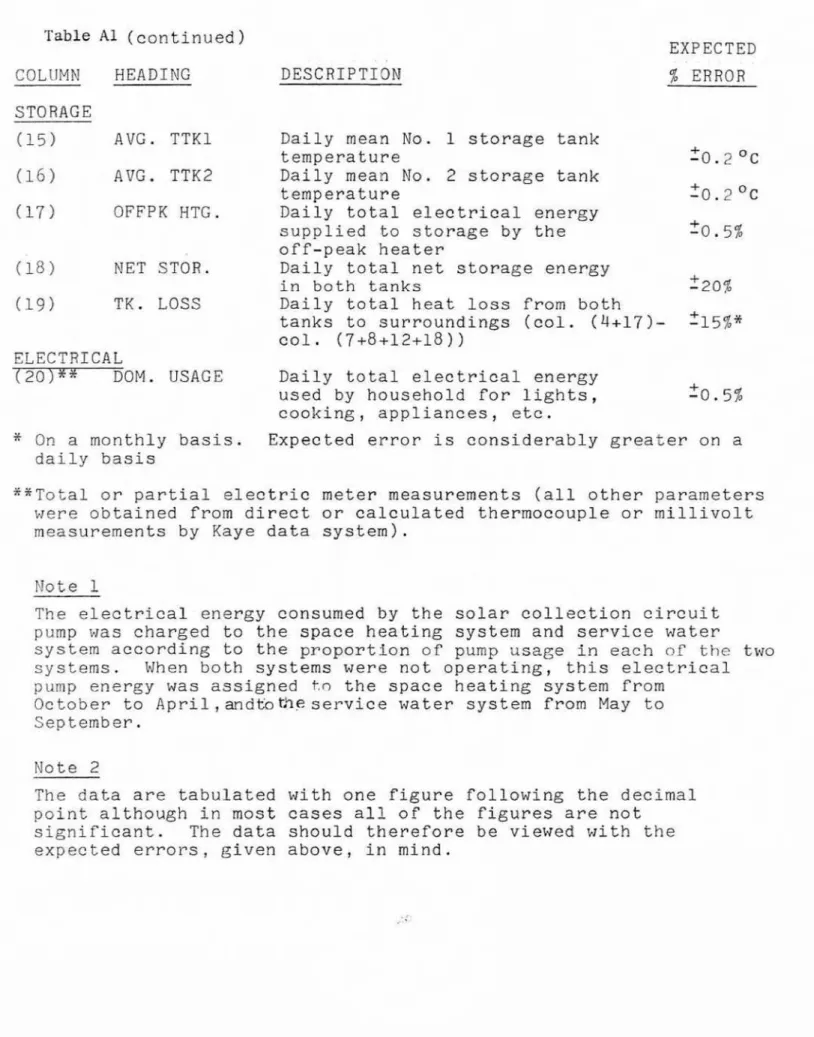
T a b l e A 1 D e a c r f p t i o n and E x p e c t e d E r r o r of S o l a r S y s t ~ m a n d ~ n v i r o n m e n t a l Parameters L l s t e d i n M o n t h l y S u m m a r y T a b l e s C O L U M N H E A D I N G D E S C R I P T I O N
11 1
DAY Day o f t h e y e a r A M B I E N T C O N D I T I O N E X P E C T E D 5: E R R O R-
( 2>
A V G . TAME. D a i l y mean a m b i e n t t e m p e r a t u r eC
3 S O L A R I N C D . D a i l y t o t a l s o l a r e n e r g y i n c i d e n t o n collector array tilted a t 6 0 ° f r o m h o r i z o n t a l S O L A R C O L L E C T I O N ( 4 C O L L . D a i l y total s o l a r energy c o l l e c t e d( 5
1
E F F C Y . Daily solar collection efficiency(column ( 4 ) / c o l u m n (3)xlQO)
E N E R G Y I N P U T S T O S P A C E H E A T I N G SYSTEM
1 6 ) " TOTAL ENGY. D a i l y t o t a l e n e r g y (solar & e l e c t r i c a l )
s a p p l i e d t o s p a c e h e a t i n g s y s t e m 1 7 ) DIR. STOR. D a L l y t o t a l s t o r a g e e n e r g y ( s o l a r a n d o f f - p e a k electrical) s u p p l i e d d i r e c t l y f o r s p a c e h e a t i n g ( 8 1 E . P . S T O R . D a i l y t o t a l s t o r a g e e n e r g y (solar a n d off-peak electrical) s u p p l i e d to h e a t pump f a r space h e a t l n g C S I * H . P . E L E C . D a i l y t o t a l e l e c t r i c a l energy r e q u i r e d b y h e a t pump ( c o m p r e s s o r a n d f a n )
(10) PUMP & F A N S D a i l y t o t a l e l e c t r i c a l energy r e q u i r e d
b y s o l a r a p a c e h e a t i n g c i r c u i t p u m p ,
s p a c e h e a t i n g d i s t r i b u t i o n f a n s w h e n
n o t in solar heat pump m o d e , and
solar c o E l e c t i o n circuit pump ( s e e
n o t e I)
E N E R G Y INPUTS T O DOMESTIC N O T WATER SYSTEM - -
(11)* T O T A L E N G Y . D a i l y t o t a l energy (solar & e l e c t s l c a l ) f 2 %
s u p p l i e d t o s e r v i c e w a t e r system ( 1 2 ) S T O R . D a i l y t o t a l s t o r a g e energy ( s o l a r and off-peak e l e c t r f c a l ) s u p p l i e d 2 0 s e r v i c e - 5 5 X w a t e r s y s t e m (13)* R . H . E L E C . Daily t o t a l e l e c t r i c a l s e r v i c e -water +0.5X r e s i s t a n c e heating e n e r g y ( 1 4 ) P U M P E L E C . D a i l y t o t a l e l e c t r i c a l e n e r g y r e q u i r e d b y s o l a r s e r v i c e water c i r c u i t p u m p a r d kl. 5%: solar c a l l e c t i o n c i r c u i t pump ( s e e n o t e 1)
Table ( c o n t i n u e d ) EXPECTED COL!IMN H E A D I N G
DESCRIPTISN
S T O R A G E ( 1 5 ) A V G . T T K l(161
A V G .TTK2
117)
OFFPKHTG.
( 1 8 ) NET STOR.(19)
TK.
LOSS ELECTRICAL / 2 0 ) * * DOM.USAGE
*
On a m o n t h l y b a s i s . daily b a s i s%
E R R O RDaily mean No. 1 s t o r a g e tank
+
t e m p e r a t u r e - 0 . 2 O C
D a i l y
mean
No. 2 s t o r a g e tank4-
t e m p e r a t u r e
- 0 . 2 O CDaily t o t a l e l e c t r i c a l energy
s u p p l i e d
t o
s t o r a g e bythe
20.5% off-peak heaterDaily total
net
storage energyin b o t h t a n k s 220%
D a i l y total heat loss f r o m both
tanks
to
s u r ~ o u n d i n g s (col. ( 4 + 2 7 ) - 2 1 5 % * c o l a (7+8+12+18)3Daily total electrical energy
used by h o u s e h o l d
f o r
lights,20.5%
c o o k i n g , appliances, etc.Expected e r r o r i s c o n s i d e r a b l y g r e a t e r on
a
**Totalor
p a s t i a lelectric meter measurements
( a l l o t h e r parameterswere
o b t a i n e d from direct o r calculated thesmobouple or millivoIt measurements b y Kaye data s y s t e m ) .Note
1The e l e c t r i c a l energy consumed by t h e s o l a r c o l l e c t i o n
circuit
pump was charged
to
t h e s p a c e h e a t i n g s y s t e m a n d s e r v i c ewater
s y s t e m according to t h e p r o p o r t i o n of pump usage in each of t h e two s y s t e m s . When b o t h s y s t e m s were
not
o p e r a t i n g , this e l e c t r i c a l pump e n e r g ywas
a s s i g n e d ?.n t h e s p a c e h e a t i n g s y s t e m fromO c t o b e r to A p r i l , andtiot?le s e r v i c e water system from May
to
S e p t e m b e r .N o t e 2
T h e d a t a
a r e
t a b u l a t e d w i t hone
f i g u r e following t h e decimalp o i n t
although i n most
c a s e sall
o f t h e f i g u r e s a r e n o tsignificant. T h e d a t a should t h e r e f o r e b e v i e w e d w i t h t h e e x p e c t e d e r r o r s , g i v e n a b o v e , in m i n d .
I 1 1 1
-
1 0 3 0 ~ 9 0 0 0 0 0 0 0 0 0 ~ ~ ~ h 0 0 1 ~ h0 ~ h ~ m ~ n ~ ~ ~ ~ ~ l ~ U - A l r r r - r - r * - r - - . - * m - ~ r ~ . ~ . - ~ -.
~ - ~ - ~ ~ I ~ w N ~ I Q O O ~ ~ ~ ~ ~ ~ ~ ~ ~ Oo O O Q I ~ O Q ~ ~ ~ ~ O ~ ~ ~ O ~ ~ . D I Cn 1 3 - l - d 4 M N N-4 d C U r 7 l 7 1 4 maul V I I- I
-
i m a (n I R U - A I- -
> I E W K * 1 9 9 w I 2 1 - 4 1 P l M r a w v r-
l I - # A - . O D u p - a- -
(3 u L 0 0 2 1 3 2 Z Q 1 W 1 I - W - w I I-
I*
1 9 Q J ~ L I - n t- -
A # L Hn R T m 3 1 - ~V I ~ O I U I L j I I f E l-
1 no1 4 1 2 - A *- -
J I J ~ $ a m ~ a 1 Ll 1 v 1 m - l V ) ~ U-
r m m I - r l r - l U mmr. 3 s U 3 Z F . t- -
z t A U \ r n I o m 3 1 3 Z 7 V I TC)* u l r n - Z-
1 1-
I X I-
4 rnrn l - J - m - a- -
4 1 K ! J T U A 1 m - * 1 > u r n r u m 4.4 - a - - V L I * r A 1 . + N m Q 4 I R T C U R I 0 V*
d d c '1 - m - h I Y W - J U l v Fa=.- 1 A - Y I I 1 - - n I c w ~ m I W W 2 d I Z F - V I VI B I I Y - A D CL 7 h I L a x - + l L C - V m a x I B - N - h I O X U 9 I > + W d D U C - V I m m s - 1 -o m m m * * m s m 1 1 . 4 4 . 4 m m m d h v )