Publisher’s version / Version de l'éditeur:
Vous avez des questions? Nous pouvons vous aider. Pour communiquer directement avec un auteur, consultez la première page de la revue dans laquelle son article a été publié afin de trouver ses coordonnées. Si vous n’arrivez pas à les repérer, communiquez avec nous à PublicationsArchive-ArchivesPublications@nrc-cnrc.gc.ca.
Questions? Contact the NRC Publications Archive team at
PublicationsArchive-ArchivesPublications@nrc-cnrc.gc.ca. If you wish to email the authors directly, please see the first page of the publication for their contact information.
https://publications-cnrc.canada.ca/fra/droits
L’accès à ce site Web et l’utilisation de son contenu sont assujettis aux conditions présentées dans le site
LISEZ CES CONDITIONS ATTENTIVEMENT AVANT D’UTILISER CE SITE WEB.
1st International Symposium on Laser Ultrasonics: Science, Technology and Applications [Proceedings], pp. 1-7, 2008
READ THESE TERMS AND CONDITIONS CAREFULLY BEFORE USING THIS WEBSITE.
https://nrc-publications.canada.ca/eng/copyright
NRC Publications Archive Record / Notice des Archives des publications du CNRC :
https://nrc-publications.canada.ca/eng/view/object/?id=de35a8d9-eb5b-4116-8ddb-9e89ebc27574 https://publications-cnrc.canada.ca/fra/voir/objet/?id=de35a8d9-eb5b-4116-8ddb-9e89ebc27574
NRC Publications Archive
Archives des publications du CNRC
This publication could be one of several versions: author’s original, accepted manuscript or the publisher’s version. / La version de cette publication peut être l’une des suivantes : la version prépublication de l’auteur, la version acceptée du manuscrit ou la version de l’éditeur.
Access and use of this website and the material on it are subject to the Terms and Conditions set forth at In-Situ Monitoring of Microstructure during Thermomechanical Simulations using Laser-Ultrasonics
In-Situ Monitoring of Microstructure during Thermomechanical
Simulations using Laser-Ultrasonics
André MOREAU 1, Silvio E. KRUGER 1, Marjolaine CÔTÉ 2, Philippe BOCHER 2
1 Industrial Materials Institute, National Research Council of Canada,
75 de Mortagne Blvd., Boucherville, QC Canada J4B 6Y4 Phone: +1-450-641-5237, Fax +1-450-641-5106;
Andre.Moreau@CNRC-NRC.gc.ca, Silvio.Kruger@CNRC-NRC.gc.ca
2 Department of Mechanical Engineering, Ecole de Technologie Supérieure,
1100, Notre-Dame West, Montréal, QC Canada H3C 1K3 Marjolaine.Cote@pwc.ca, Philippe.Bocher@etsmtl.ca
Abstract
Ultrasonic velocity and attenuation measurements are powerful tools to infer information about the microstructure and properties of metals and their alloys. To begin, elastic constants can be measured with
precision as high as one part in 104. At this level of precision, changes in elastic constants caused by
texture, phase transformations, and various internal friction phenomena can be sensed easily. Ultrasonic attenuation can be measured also. In relatively anisotropic metals such as iron and steels, ultrasonic attenuation is dominated by scattering by the grain structure. In weakly anisotropic metals, such as aluminium and its alloys, the attenuation is mostly due to internal friction mechanisms caused by moving dislocations or other phenomena.
Until now, ultrasonic measurements could be done during physical simulations only with great difficulty. However, laser-ultrasonics is a remote-sensing technology that enables to easily generate and detect wideband ultrasound pulses with lasers. It works at any sample temperature and on moving samples. We
have instrumented a Gleeble∗ 3500 thermomechanical simulator with laser-ultrasound technology. This
paper reviews the principles of laser-ultrasound technology and its capabilities for in-situ monitoring of physical simulations with the Gleeble.
Keywords: Laser-ultrasound, ultrasound, microstructure, recrystallization, phase transformation,
austenite, texture, elastic modulus
1. Introduction
Thermomechanical simulators are used by metallurgists to perform physical simulations of various metals shaping processes. Such simulators allow applying almost any thermal process and a wide variety of mechanical deformations. While metals shaping processes have the primary function of imparting a shape, the microstructure and mechanical properties of the product are of nearly equal importance. Yet, it is precisely this shaping process orthe subsequent thermal process that determines the microstructure.
We have instrumented a Gleeble* 3500 thermomechanical simulator with laser-ultrasound (LUS) sensing technology to monitor the evolution of microstructural and material’s properties during thermomechanical processing. The Gleeble 3500 is a widely used, commercially available simulator. The hardware and measurement techniques are described elsewhere [1-8]. Here, we review various applications of our sensor to in-situ measurements of elastic moduli, microstructure, and monitoring thermomechanical simulations. We also include some new, unpublished examples.
2. Laser-ultrasonic measurement of elastic moduli and microstructure
LUS, and ultrasonic technologies in general, allow measuring ultrasound velocity and attenuation. Velocity is a direct measurement of elastic moduli, which are themselves influenced by temperature, alloying, phase transformations, texture, precipitates, and internal friction. Attenuation is caused by scattering by the microstructure (i.e. by the grains) and by internal friction. Consequently, ultrasonics can sense all of these materials’ features. The potential for metallurgical engineering applications is nearly unlimited, but careful data interpretation is required.
2.1 Velocity and elastic moduli
The simplest method to measure ultrasound velocity, v, is to measure the time difference, ∆t, between two successive echoes bouncing between the two parallel
surfaces of a sample having a thickness, h. The velocity is given by the relation
t h
v=2 ∆ . It is related to an elastic modulus, M, and density, ρ, through v= M ρ .
Clearly, if a material’s density is known or can be measured, velocity measurements are a direct measurement of elastic moduli. Ultrasonics is simply the best method to measure elastic moduli because of its high precision and accuracy (of order 0.01% to 1% depending on the experimental conditions). Which modulus is measured depends on which type of ultrasonic pulse is propagated. For a shear wave, M is the shear modulus. For a compression wave travelling in the thickness direction (often denoted the “3” direction) of a plate, M is c33, one component of the elastic stiffness tensor. Assuming
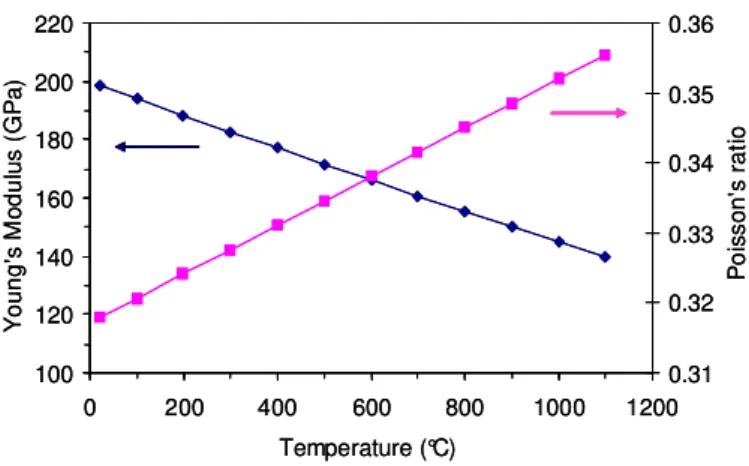
that the elastic properties are isotropic, a common engineering approximation, then these two measurements can be converted to Young’s modulus and Poisson’s ratio, or to bulk compressibility and shear modulus. This is illustrated in Fig. 1.
100 120 140 160 180 200 220 0 200 400 600 800 1000 1200 Temperature (°C) Y o u n g 's M o d u lu s ( G P a ) 0.31 0.32 0.33 0.34 0.35 0.36 P o is s o n 's r a ti o 100 120 140 160 180 200 220 0 200 400 600 800 1000 1200 Temperature (°C) Y o u n g 's M o d u lu s ( G P a ) 0.31 0.32 0.33 0.34 0.35 0.36 P o is s o n 's r a ti o
Figure 1. Young’s modulus & Poisson’s ratio of an austenitic stainless steel as a function of temperature.
2.2 Elastic moduli and texture
At the level of 1%, the elastic properties are rarely isotropic and one can easily measure ultrasound velocity variations with propagation direction. Usually, the reason for this anisotropy is crystallographic texture, i.e. the preferential alignment of the crystallographic axes of grains. Single crystals have anisotropic elastic constants and ultrasonic velocities. For example, the compression velocity in iron in the <100>,
<110>, and <111> directions are 5488, 6225, and 6453 m/s, respectively. Clearly, if the <111> directions of the single crystals align perpendicularly to the surface, the velocity will be higher in that direction than if there were no alignment. Because LUS has a measurement precision and accuracy of 0.01-1%, texture variations can be sensed easily, even in materials that are manufactured with high uniformity and reproducibility. The above example of iron illustrates how texture affects velocity. Inversely, it is also possible to measure some texture coefficients, i.e. to obtain a quantitative assessment of the crystallographic orientation distribution, from ultrasonic velocity measurements. Unlike X-ray measurements of texture which provide information from the sample’s surface, LUS measurements average the texture throughout the entire sample thickness. This can be advantageous because it is the average bulk texture that determines the material’s bulk properties. Fig. 2 shows a comparison of texture measured by LUS and neutron diffraction in the aluminium alloy 5754 during recrystallization at 325 °C.
3 4 5 6 7 1 10 100 1000 10000 Time (s) W 4 0 0 ( x 1 0 -3 ) -2 -1 0 1 2 W 4 2 0 ( x 1 0 -3 ) W400 Neutrons W420 Neutrons
Figure 2. Evolution of two texture coefficients (ODCs) during the isothermal annealing of the aluminium alloy 5754 at 325 °C. Solid symbols: In-situ, laser-ultrasonic measurements. X symbols and line: Neutron
diffraction measurements on quenched samples [2].
2.3 Elastic moduli and other phenomena
Generally, any phenomenon that affects elastic moduli can be sensed with ultrasonics. This includes phase transformations, the precipitation of solid solution elements during aging and internal friction effects. Usually, these effects can be seen when texture does not vary. Fig. 3 shows the temperature variation of the compression and shear resonance frequencies in the thickness of a 1 mm thick sample of martensitic stainless steel 415. One can easily measure the temperatures of the ferromagnetic phase transformation at (Curie temperature), the martensite (M) to austenite (γ) transformation during heating, and of reverse transformation kinetics during cooling.
2.4 Attenuation and grain size
Just as velocity is measured from the arrival times of two successive echoes bouncing between two parallel surfaces, the simplest way to measure attenuation is to take the amplitude ratio of successive echoes. Although ultrasound velocity is mostly
frequency-independent, attenuation is not. So the amplitude ratio can be calculated for each frequency component of the ultrasound pulse. Often, the main cause of attenuation is scattering by grains. The larger the grains are, the larger the scattering and the larger the attenuation. This leads to a simple method to measure grain size as shown in Fig. 4.
2.6 2.7 2.8 2.9 3 3.1 3.2 3.3 0 200 400 600 800 1000 Temperature (°C) R e d : L o n g itu d in a l F re q . (M H z ) 1.1 1.2 1.3 1.4 1.5 1.6 1.7 B lu e : T ra n s v e rs e F re q . (M H z ) TΜ→γ Tγ→Μ TCurie
Figure 3. Compression (red) and shear (blue) resonance frequencies in the thickness of a 415 martensitic stainless steel sheet during heating and cooling at 11 °C/s. The arrows indicate the direction of time. The
dashed lines indicate phase transformation temperatures.
0 100 200 0 2 4 6 1008 1020 1035 1074 A36 A u s te n it e G ra in S iz e ( µ m ) Ultrasonic Attenuation at 15 MHz (dB/mm) AISI grades
Figure 4. Austenite grain size vs. laser-ultrasonic attenuation at 15 MHz in austenitic steel at 1100 °C. Austenite grain size was obtained by standard metallographic techniques on quenched samples [3,4].
2.5 Attenuation and other phenomena
When grain size is very small or for some materials having weak grain scattering (like aluminium) attenuation may be attributed in a large part to internal friction phenomena. Examples of internal friction phenomena that have been measured with LUS include dislocation motion, Snoek relaxation, and magnetoelastic relaxation [5].
3. Laser-ultrasonic, in-situ characterization of metallurgical processes
3.1 Recrystallization of aluminium alloys
When a cold rolled metal such as aluminium recrystallizes there is usually a change in crystallographic texture. This texture variation causes a change of ultrasound velocity. By monitoring the velocity change from the initial, cold-rolled value to the final and annealed value, one can estimate the recrystallized fraction, as illustrated in Fig. 5. In this figure, each metallurgical data point was made by interrupting the process, quenching the sample, and doing a standard metallographic examination. This can take days. In contrast, LUS yields an entire curve in a single experiment on one sample. In addition, LUS has much higher temporal resolution and can reveal details that could be missed if only a few metallurgical data points were available.
0 0.2 0.4 0.6 0.8 1 1 10 100 1000 10000 Time (s) R e c ry s ta liz e d f ra c ti o n 350 °C 325 °C 300 °C 0 0.2 0.4 0.6 0.8 1 1 10 100 1000 10000 Time (s) R e c ry s ta liz e d f ra c ti o n 350 °C 325 °C 300 °C
Figure 5. Recrystallized fraction of AA5754 vs. isothermal annealing time. Triangles: laser-ultrasonic measurements. Squares: measured by metallography on quenched samples [6].
3.2 Austenite decomposition and retained austenite
Fig. 3 shows how the velocity varies with temperature and phases in a stainless steel 415 containing 13% Cr and 4% Ni. These elements delay considerably the ferrite/pearlite transformation in favour of a martensitic transformation which occurs at lower temperatures. As a result, a strong hysteresis is observed in the martensitic phase transformation [7]. Assuming that the initial and high temperature phases are 85% martensite and 100% austenite, respectively, the measured velocity can be compared to the velocity in the two known materials at a given temperature to estimate the transformed austenite fraction or, equivalently, the retained austenite fraction. This was calculated from the compression resonance of Fig. 3. The LUS measurements agree well with dilatometry measurements made using a mechanical dilatometer inside the Gleeble (Fig. 6). However, our mechanical dilatometer suffers from mechanical backlash and this forced us to rescale the dilatometry measurements. Dilatometry is also affected by stresses and strains caused by thermal gradients inside the sample and from the distribution of solid solution elements like carbon. LUS measurements are not
affected by these factors. This results in more accurate measurements of phase transformations and austenite decomposition [8].
3.3 Recrystallization and grain growth of steel transfer bars
Steel transfer bars are the result of processing 20 cm thick slabs through the hot-rolling, roughing mill. They are sent next to the hot-rolling, finishing mill where they become plates with a 6-8 mm thickness. To control the microstructure and mechanical properties of the plates, it is important to understand and control if and how quickly the grains recrystallize and grow after hot deformation. This information is important because one would like to know if the effect of successive processing steps is cumulative or not. If the microstructure has time to fully recover between processing steps, then there is no cumulative effect. 0 0.2 0.4 0.6 0.8 1 0 100 200 300 400 Temperature (°C) R e ta in e d A u s te n ite F ra c tio n LUS Dilatometry (rescaled) Ms
Figure 6. Retained austenite fraction during cooling of 415 stainless steel. Blue: LUS. Purple: dilatometry
This metallurgical process was simulated on a low-carbon, complex phase steel containing molybdenum and niobium as its main micro alloying elements. Cylindrical samples were soaked for 2 minutes at 1250 °C then cooled to deformation temperatures of 1000, 1050, and 1100°C. They were allowed to thermally equilibrate for a few seconds at that temperature. Then they were given a compressive strain of 0.3 at a strain rate of 1 s-1. LUS measurements were made as soon as the deformation ended and grain size was monitored as a function of time (Fig. 7). Initially, during recovery, the grain size remains constant. Then, as the deformed microstructure recrystallizes, the average grain size diminishes. The point of minimum grain size corresponds to full recrystallization. Following this point, grain size increases due to grain growth. Clearly, the kinetics occurs faster at higher temperatures.
Such a study would have been very difficult to do with standard metallurgical methods on quenched samples. First, it would have been essentially impossible to measure at the earliest times, from 0.1 to a few seconds. Second, prior austenite grain size is extremely difficult to measure on this alloy after quenching. Finally, a study on a few quenched samples would not have provided such precise details as a function of time.
50 100 150 200 250 0.1 1 10 100 1000 Time (s) G ra in S iz e (µ m ) 1100°C 1000°C 1050°C
Figure 7. Grain size vs. time in a complex phase steel following hot deformation at three different temperatures [9].
4. Concluding remarks
Laser-ultrasonics provides in-situ, non-contact measurements of the properties and microstructure of metals during thermomechanical simulations in the Gleeble. LUS technology has proven that it can characterize many thermomechanical processes with excellent accuracy. It is fast and can save a lot of time in metallographic laboratories. LUS also enables studies that would be impossible to do any other way. We hope that once LUS technology has revolutionized in-situ characterization of metallurgical processes, it will also revolutionize in-line process monitoring and control.
References
1 . A. Moreau, D. Lévesque, M. Lord, M. Dubois, J.-P. Monchalin, C. Padioleau, and J. F. Bussière. Ultrasonics 40, pp. 1047-1056, 2002.
2. A. Moreau, S. E. Kruger, M. Militzer and K. T. Conlon. Unpublished.
3. M. Dubois, A. Moreau, M. Militzer and J. F. Bussière. Scripta Mater. 39, pp. 735-741, 1998.
4. M. Dubois, M. Militzer, A. Moreau and J. F. Bussière. Scripta Mater. 42, pp. 867-874, 2000.
5. S. Bolognini and A. Moreau. J. of Appl. Phys. 94 (6), pp. 3771-3780, 2003.
6. S. E. Kruger, A. Moreau, M. Militzer and T. Biggs. Thermec 2003 Internat. Conf.
on Processing & Manuf. of Adv. Mater., Part 1. (Trans Tech Publications,
Switzerland 2003) pp. 483-488.
7. M. Côté. Etude des cinétiques de transformation de phase d’un acier inoxydable
martensitique 13%Cr-4%Ni. Master’s thesis of Mechanical engineering
(Montréal, Ecole de technologie supérieure de Montréal, 2007).
8. S. E. Kruger and E. B. Damm. Mater. Sci. & Eng. A 425, pp. 238-243, 2006.
9. S. Sarkar, W. J. Poole, M. Militzer and A. Moreau. Metallurgical and Mater.


![Figure 7. Grain size vs. time in a complex phase steel following hot deformation at three different temperatures [9]](https://thumb-eu.123doks.com/thumbv2/123doknet/14167263.474056/8.892.234.665.136.425/figure-grain-complex-phase-following-deformation-different-temperatures.webp)
