Publisher’s version / Version de l'éditeur:
ASHRAE Transactions, 2, pp. 1579-1594, 1988
READ THESE TERMS AND CONDITIONS CAREFULLY BEFORE USING THIS WEBSITE. https://nrc-publications.canada.ca/eng/copyright
Vous avez des questions? Nous pouvons vous aider. Pour communiquer directement avec un auteur, consultez la première page de la revue dans laquelle son article a été publié afin de trouver ses coordonnées. Si vous n’arrivez pas à les repérer, communiquez avec nous à PublicationsArchive-ArchivesPublications@nrc-cnrc.gc.ca.
Questions? Contact the NRC Publications Archive team at
PublicationsArchive-ArchivesPublications@nrc-cnrc.gc.ca. If you wish to email the authors directly, please see the first page of the publication for their contact information.
NRC Publications Archive
Archives des publications du CNRC
This publication could be one of several versions: author’s original, accepted manuscript or the publisher’s version. / La version de cette publication peut être l’une des suivantes : la version prépublication de l’auteur, la version acceptée du manuscrit ou la version de l’éditeur.
Access and use of this website and the material on it are subject to the Terms and Conditions set forth at
Heat flow through a roof insulation having moisture contents between
0 and 1% by volume, in summer
Hedlin, C. P.
https://publications-cnrc.canada.ca/fra/droits
L’accès à ce site Web et l’utilisation de son contenu sont assujettis aux conditions présentées dans le site LISEZ CES CONDITIONS ATTENTIVEMENT AVANT D’UTILISER CE SITE WEB.
NRC Publications Record / Notice d'Archives des publications de CNRC: https://nrc-publications.canada.ca/eng/view/object/?id=5dc739b2-21ca-400d-972e-3d051686f4f8 https://publications-cnrc.canada.ca/fra/voir/objet/?id=5dc739b2-21ca-400d-972e-3d051686f4f8
Ser
l ' i C l UNational Research Conseil national
n o .
163611
c * 2 ouncil Canada de recherche$ Canada
BLDG
Institute for lnstitut deResearch in recherche en Construction construction
Heat Flow Through a Roof Insulation
Having Moisture Contents Between 0
and
1%
by Volume, in Summer
by C.P. Hedlin
Reprinted from
ASHRAE Transactions 1988 Part 2, p. 1579-1 594
(IRC Paper No. 1636) NFPC I R C
-
C l s nL I B R A R Y
1
FEB 9
19%La pdsence d'humidit6 diminue l'efficacit6
&
l'isolant &s toitures-terrasses. Elle accroit
le transfert d'energie par conduction et, dans certaines conditions, sous l'effet d'un
processus d'evaporation-condensation,
l'humidit6 qui se trouve dans les dgions chaudes
de l'isolant migrant vers les dgions bides.
Dans ce document, l'auteur s'int6resse surtout
B
l'effet observe lorsque la teneur en
humidit6 est de
1
%ou moins en volume, l'Ct6, mais il pdsente aussi, aux fins de
comparaison, &s d o m h s concernant &s teneurs en humidid plus 6levhs.
Il
fait 6tat &s
dsultats observes dans le cas d'isolant
&
fibre
&
verre place sur le toit d'une installation
d'essais exterieure, oh il a subi des variations de tempbrature dues aux conditions
m 6 ~ l o g i q u e s .
Les oscillations & la temPQature ext6rieure ont caud d'un jour
B
l'autre
&s
renversements de l'dcart & te@rature entre les &ux faces de l'isolant.
L'dcoulement & chaleur dans le toit et les temp6ratms sur les faces suweure et inferieure
de l'isolant ont Ct6 mesurds
rfi-tivement l'&de thermofluxm6tres et de
thermocouples. Les dom
les 20 minutes et
analydes par ordinateur.
On
a compad les valeur
aux memes condition1
accroissement
&
l'&b
teneur en humidid &ail
lant sec soumis
.'un important
xluit lorsque la
.
HEAT FLOW THROUGH
A ROOF INSULATION
HAVING MOISTURE CONTENTS
BETWEEN
0
AND
1%
BY VOLUME,
IN SUMMER
C.P. Hedlin, Ph.D. ASHRAE Fellow
ABSTRACT
The effectiveness of flat roof insulation is reduced by the presence of moisture. It will increase energy transfer by conduction and, under certain conditions, by an evaporation-condensation process, in which moisture moves from warm to colder regions of the insulation.
This paper is primarily devoted to the effect where the moisture content is 1% by volume, or less, in summertime, although data for higher moisture contents are included for comparison purposes. It presents results for glass fiber insulation placed on the roof of an outdoor test building, where it underwent temperature changes produced by the prevailing weather conditions. The swings in outdoor temperature produced daily reversals in temperature difference across the insulation.
Heat flows through the roof and the temperatures at the top and bottom surfaces of the insulation were measured with.heat flux transducers and thermocouples, respectively. The data were recorded digitally every 20
minutes and analyzed by computer.
The measured values were compared to values estimated for dry insulation subjected to the same temperature conditions. The results indicate that a significant increase in energy exchange (gain and loss) through the roof occurred for moisture contents less than 1% by volume.
I INTRODUCTION I
I
~hermal flow into or out of a building. The presence of moisture increases the insulation must be dry in order to be most effective in impeding heat transfer of energy, since moisture in either liquid or solid form will have a higher thermal conductivity than the insulation. Further, if the insulation is porous, a significant amount of energy may also be transferred by a process in which moisture is evaporated in a warm region, migrates under vapor pressure difference, and condenses in a colder one. The effects will vary with the weather conditions; in continuously freezing weather, moisture will normally be deposited near to the cold surface of the insulation asfrost or liquid and its effect will be limited to its influence on thermal conductivity. In warm weather, the temperature difference across the
insulation reverses periodically (probably daily), and the
evaporation-condensation p,tocess comes into play (Hedlin 1987, 1983; Bomberg and Shirtliffe 1978; Langlais et al. 1983; Shuman 1980; Thomas 1980).
The rate of energy transfer is affected by moisture content and temperature. Large amounts of moisture cause a severe reduction in the thermal resistance of insulation; there is a sufficient bulk of moisture to C.P. Hedli'n, Ph.D., is Senior Research Officer, Institute for Research in Construction, National Research Council of Canada, Saskatoon, Saskatchewan.
materially increase heat transfer at all times of the year. However, the effects of small amounts of moisture are perhaps less well defined. There is evidence that even small amounts of moisture, e.g., a fraction of a percent by volume, may have a significant effect. Thus, using damp insulation or
allowing moisture from a light rain or even dew to be built into the roof may
significantly reduce the effectiveness of a porous insulation.
The moisture content of insulation may range from oven dry to complete saturation. In this report, moisture contents are expressed in terms of
percent of gross volume. Thus, the maximum possible moisture content would be somewhat less than 100% by volume, since the insulation material occupies some volume.
This report gives the results of field-type measurements of heat flows through a mineral fiber insulation with moisture contents ranging from 0% to 9% by volume. Measurements were made in the summer season. The main attention is given to moisture contents (mc) in the range from 0.1% to 1% mc by volume. Results for those moisture contents are compared to heat flows in dry
insulation and, in some cases, to heat flows in insulation with 3% mc. The decision to use 3% mc data for comparison was an arbitrary one; data for other moisture contents were also available.
Since the measurements were not usually made simultaneously, it was necessary to make the comparisons using computational procedures. To do this, transfer functions were used (Stephenson and Mitalas 1971; Hedlin 1985). Coefficients obtained from measurements on dry insulation were used in
conjunction with temperature sets obtained in tests on the 0.1%, 0.25%, 0.5%, and 1% mc specimens. This, ideally, would give heat fluxes for dry specimens under surface temperature conditions identical to those of the test specimens and permit estimation of the effect of moisture content effect on heat flux. An alternative method is to measure heat fluxes for materials simultaneously under the same ambient conditions.
Both are valid bases for comparing performance, but they are different. In the first, the surface temperatures are affected by the heat transfer process; the evaporation of moisture in the moist material will have a cooling effect; also, the moisture can be expected to affect the time phase of the heat flow. Therefore, application of identical temperature conditions to the dry material is somewhat artificial. In the second approach, the moist
and dry insulations each perform
as
a part of a system. However, thei
Iconditions are not likely to be quite the same for two test sites, e-g.,
1
small differences
in
surface absorptivity to solar radiation, possibledifferences in exposure of the top surface to weather effects, differences in
thermal resistances within the experimental roof (apart from the moisture
contents of the insulation). Even if these effects were small, they would
introduce some uncertainty into the comparisons.
Information on the effect of moisture has practical significance. In warm weather, poor performance of roof insulation may materially increase the cooling load of the building it is intended to protect or allow wider swings in interior temperature than would occur if the insulation was dry.
MEASUREMENT METHODS
Measurements were made at the Outdoor Test Facility of the Institute For Research in Construction, NRC Canada, at Saskatoon. That facility was constructed so that experimental roof and wall systems can be put in place and their performances monitored. The roof is subject to the prevailing
weather; however, substantial variation in roof temperature conditions can be produced by using top covers with different masses and absorptivity to solar radiation. Heat traps may be used to produce high temperatures.
In these studies, glass fiber insulation 61 rnm thick and 600 mm square
was used. k circular piece 107 rnm in diameter was cut from the center of each
specimen. It was sealed in 0.15 mm thick polyethylene, and moisture was added
In earlier work (Hedlin 1983, 1987), measurements were made on
insulation with moisture contents ranging from 1% to about 20% by volume. In the present case, specimens were prepared having 0.1%, 0.25%, 0.5% and 1% moisture content. The latter represent small amounts of moisture, and it is necessary to take measures to encourage uniform distribution radially across the specimen. In most cases, in order to achieve this, filter paper cut to the size of the insulation test piece was inserted so that it covered the top surface of the specimen. Water in the amount required to reach the desired moisture content was added to it and the specimen was resealed. It was
assumed that the wicking action of the filter paper would achieve the desired distribution. Observation indicated that the entire surface of the filter paper did become wet; however, beyond that, it was not possible to determine whether there was lateral uniformity of moisture within the specimen.
Alternatively, water droplets were distributed over the specimen surface. Both methods were used. No difference in the results was distinguished.
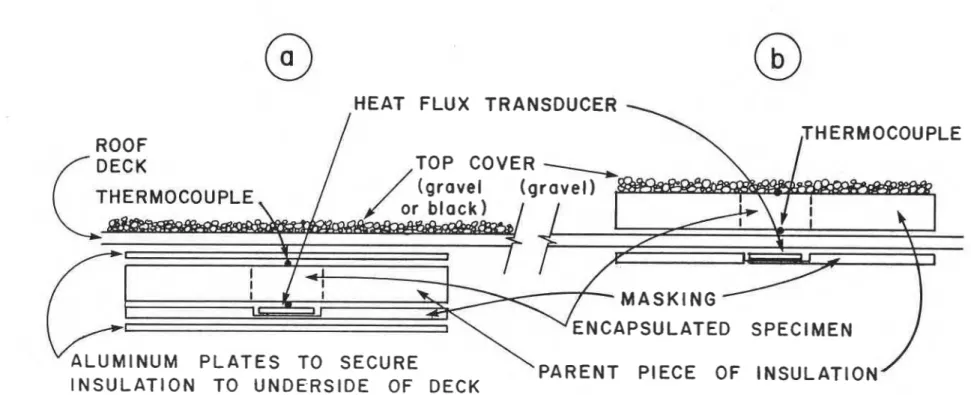
The damp specimen was inserted back in its original location in the parent piece, and the assembly was mounted in the roof. A heat flux transducer 100 mrn in diameter was located beneath the insulation, and
thermocouples were located at the upper and lower surfaces of the insulation as shown in Figure 1. The thermocouple and heat flux meter outputs were recorded digitally every 20 minutes. These were averaged to produce hourly values that were fed into a computer for analysis.
Tests were run for periods of one to two weeks during the summer. A t the end of a test period, the specimen was reweighed to determine the change in moisture content. Normally there was a loss; moisture may have permeated through the polyethylene or through imperfections in the seal. For example, in one test, a specimen having a volume of 550 cm3 was dried under vacuum in an oven at 38OC and 1.441 gm of water were added to it. Two weeks later, at
the end of the test, it was found to have lost 0.222 gm of water. Thus its moisture content declined from 0.26% to 0.22% by volume during the test. It is described as having 0.25% mc.
Two types of roof cover were used:
1. The deck surface (Figure la) or insulation (Figure lbl was covered with a 40 mm thick layer of coarse gravel.
2. The deck surface was black with no gravel cover. This applied only to Figure la.
These two arrangements produce significantly different temperature variations at the top surface of the insulation due to increased absorption and emission of radiation by the black surface and the smaller thermal mass of the second sys tern.
EQUATIONS
Transfer functions were used to represent heat flux for analytical purposes. Sensible heat flux was represented by Equation 1.
where
Jo = 1
Q = heat flux, w/m2
TT and TB are temperatures at the top and bottom surfaces of the insulation, respectively.
In all cases in this report, hourly values were used; the subscripts 0, 1, and 2 refer to current time and to times 1 and 2 hours earlier, respectively. (In the following analyses, sensible heat, Qs=QO in Equation 1).
Table 1 contains two sets of transfer coefficients. The first was obtained from measurements on a piece of dry insulation 600 mm square, representing (approximately) common roofing applications. The second was
obtained from measurements on a dry, encapsulated piece, representing the arrangement used in these tests. These data are used later to compare the thermal conductances of the two systems. Ninety-six data sets (four days of data) and 48 data sets (two days of data) were solved simultaneously to obtain sets #1 and 2 in Table 1.
RESULTS
Effect of Encapsulation on Heat Flow
Since encapsulation might
have
affected the result, a test was carried out to assess the effect. A s mentioned above, the first set of coefficients in Table 1 i s for a large piece of insulation, while the second is for an encapsulated piece. In order to compare their behavior, the conductances ( C )for the two cases were calculated. This can be done using either the I or the
K coefficients or, as in Equation 2, using both of them to get an average
L 2(1
-
CJ)1
For set # 1 the conductance is 0.568 w / m 2 = ~ and for set # 2 it is 0.560 w/m2*K. These values are within experimental error of the measurement method and suggest that the encapsulation did not affect the result significantly in
I this case.
Measurements on moist insulations
I
- Measured heat fluxes for moist insulation are given along withtemperature differences and heat fluxes estimated for dry insulation using the measured temperatures. Results are presented in two ways:
-
as hourly measured or calculated values. Positive ( + ) represents outflow of energy or a temperature difference in which the bottom surface temperature of the insulation exceeds that of the top surface. Negative ( - 1 flow means energy flow into the building.-
as cumulative positive or negative values in which totals areaccumulated until the energy flow or temperature difference reverses direction.
Temperature differences provide a measure of the force producing energy transfer. Since water vapor transfer rate varies with vapor pressure differences, which do not vary linearly with temperature differences, the
temperature difference provides only an approximate measure of driving force.
I
!
Sets of data are produced corresponding to the two top coverarrangements:
1. For the heavy gravel cover, data were obtained for moisture contents of 0%, 0.1%, 0.25%, 0.5%, 1%, 3% and 9% by volume. The gravel had a marked effect on the temperature and heat flow in the system due to
its mass and its moderate absorptivity for solar radiation. Top surface temperatures of the insulation did not exceed 50°C. Hourly and cumulative results are plotted in Figures 2a to 2f for periods of .five days. The latter are given in bar graph form.
2. For the black roof with no gravel cover, measurements were made for 0.25%, 0.5% and 1% mc. Top surface temperatures ranged up to 70°C.
a) Results for 0.1% mc. Two separate sets of measurements were made on insulation with 0.1% mc. Results were not significantly
different for the two sets. One of them is plotted in Figure 2a. Neither the hourly nor the cumulative plots demonstrate any
significant effect due to the moisture.
In Figure 4 the heat flux measured for the 0.1% mc specimen and the heat flux calculated for dry material are given. The vertical scale is expanded. Even with the expanded scale, the differences appear to be minor.
b) Results for 0.25% mc. Figures 2b and 3b show results for the 0.25% mc specimen. Its heat flux exceeds that predicted for the dry insulation. Both the time plots and the cumulative values confirm the difference.
In Figure 5a the heat flux is compared to that estimated for dry insulation. For most of the time it exceeded that of the dry insulation; however, it began to fall off, and from hour 60 to hour 84, it followed the predicted trace for dry insulation. The day starting with hour 48 was cool; no reversal in temperature occurred; hence, moisture was not driven back toward the upper surface of the insulation. This behavior could be attributed to depletion of moisture at the lower surface and a cessation of the evaporation-condensation energy transfer.
For Figure 2b the daily totals of heat flow usually exceeded those of the dry specimen except in extreme cases. In Figure 3a the ratios of the measured/dry daily totals of heat flow range from about 1 to 2.
C) Results for 0.5% mc. In Figure 2c, for 0.5% mc, the measured heat flux exceeds the predicted flux for dry insulation. In
Figure 5b the measured flux normally exceeds that of the dry
insulation. Comparing daily totals in Figure 2c; the measured values always exceeded those of the dry specimen. In Figure 3b the ratios of the measured/dry totals were normally 2 or greater
d) Results for I%, 3%, and 9% mc. In Figures 2d, 2e and 2f, the
measured flux consistently exceeds that predicted for dry
insulation. In Figure 2 daily totals of the measured values for the 1% mc specimen consistently exceeded those of the dry
insulation.
The foregoing analyses used dry insulation heat fluxes that were
predicted from the observed temperatures. However, the temperature patterns in moist and dry insulations subjected to the same external environment will be different due to the effect of moisture in the wet one. One example of the effect was obtained based on tests made simultaneously on a dry specimen and on specimens with 1% and 9% mc under the gravel cover. As expected, the temperatures of the dry insulation differed from those of the wet ones. For example, in the ten-day test on which this comparison was made, the dry insulation reached a maximum temperature of 50°C while the wet ones both reached 46OC.
Figure 6 contains results for measurements on dry and 1% mc specimens
and heat flux computed for dry insulation using the temperatures for the 1% mc test. (The latter two curves correspond to two curves in Figure 2dl. These curves show that the heat flux measured for the dry insulation exceeds the computed value by about 20%.
Table 3 contains Qt*, Qd*, and Qm*. These are, respectively, daily average totals of the measured energy 'low, the energy flow estimated or measured for dry insulation, and the heat flow attributed to moisture
(QmX=Qt*-Qd*). Values are in wh/m2-day. In Figure 7 ratios Qt*/Qd* are
for each moisture content. These ratios are plotted against moisture content. Inspection of values for gravel cover shows that ratios of QtX/Qd* for gravel cover and the black surface rise sharply to about 2.6 at 1% mc and more
gradually thereafter, reaching 3.5 at 9% mc, when the estimated values for Qd* are used. However, if the measured values for Qd* are used, the ratios
are about 2.2 at 1% mc and 2.4 at 9 % mc.
DISCUSSION
The model used here to estimate heat flux in moist insulation is a very simple one. It is assumed that moisture is evaporated at the warm surface of the insulation, moves through the insulation, and condenses at the cold surface, transporting energy at the same time. In fact, the process will be much more complicated; there will be intermediate condensation and
reevaporation as temperatures in the interior of the insulation changes with time. Further, while there may be free moisture at the warm surface
initially, its supply will be depleted, particularly in hot weather when high temperatures will be reached at the top surface of the insulation. In spite of these deficiencies, this approach is able to provide an approximate method for estimating energy transfer. As indicated above, depletion effects come into play, and analysis based on the model would tend to overpredict heat fluxes during hot weather.
Conversion of 1 kg of water to vapor requires about 2450 kJ or 681 yh of
energy. Insulation 61 mm thick with 1% mc contains 0.61 kg of moisture/mL of
roof. Thus, its evaporation at one surface and condensation at the other would be attended by the transfer of about 410 wh/m2 of roof. This assumes
that gravity or 'wicking does not return liquid to the original surface. This
should represent the maximum amount transferable by that means in one ( + ) or
( - 1 component of the cycle. For 0.1%, 0.25% and 0.5% mc, the amounts of energy would be 40, 100, and 200 wh/m2, respectively. The amounts of energy transfer attributable to moisture effects, which would include the effect on conduction as well as evaporation-condensation, were less than half of these quantities;
When compared to physical deterioration of the roofing system, the effect of moisture on energy transfer is probably of secondary interest to most building owners. However, the insulation is placed for the purpose of controlling energy transfer and failure to do so results in poorer control of the building's internal environment, with increased heating and cooling load and/or poorer conditions for the occupants or equipment.
The present study suggests that 1% mc by volume in 61 mm thick glass
fiber insulation can increase heat flows by a factor of more than 2 in
summer. For 0.25% and 0.5% mc, the increases were less but may exceed 50%. In cold weather, with no reversals in temperature difference, this small amount of moisture would have an insignificant effect.
The amounts of moisture are small. A reasonably heavy dew may deposit 1
mm of moisture. In the 61 mm thick material used in these tests, that would
amount to 1.6% mc, or several times as much as the lower amounts used here. This supports the contention that insulation placed on a damp roof or
subjected to even a small amount of rain may contain enough moisture to significantly affect its performance. The long-term effect would depend on whether the roof can dry out.
Summary
1. Heat gains and losses through an insulated roof were measured under
field-type conditions in summer. The interior of the building remained at about 20-25°C and the outside conditions were those of the prevailing weather. In o.ne set of measurements, the top surface temperatures of the
insulation did not exceed 50°C. In another set they reached 70°C.
2. The insulation was a rigid mineral fiber with moisture contents of O%, 0.1%, G.25%, 0.5%, 1%, 3%, and 9% by volume. Heat fluxes were measured with heat flux transducers and temperatures with thermocouples. The
results were recorded digitally every 20 minutes. Hourly averages were used in the analyses.
3. The deck of the building was light, i.e., 9 mrn plywood. It would have
only a small effect on the heat transfer process as compared to a heavier deck.
4. The heat exchange is cyclic. Energy is transferred outward at night and
inward during the day. When regular reversals occur, transfer of energy in one direction during one component of the cycle can be balanced by transfer in the other when the gradient reverses. If reversals in temperature gradient do not occur, the moisture will tend to migrate toward the cool surface, and unless it is returned, e.g., by gravity, the evaporation-condensation process will eventually cease.
5 . Estimates of heat flux for dry insulation as done here may be too low. This might occur because temperature differences across a damp specimen
(used for the estimate) would be lower than those across a dry specimen mounted on the roof under the same conditions. One test in which
measurements were made on a dry specimen simultaneously with
measurements on a moist one gave values about 10% higher for ( + ) flux
and 30% higher for ( - ) flux than those found by the computational method
used here.
6. With the possible exception of insulation with 0.1% mc, the energy
transfer values for the moist insulation exceeded those estimated for dry insulation in all cases. The effect of moisture on energy transfer increased rapidly up to about 1% mc and more slowly for moisture content increases above that level.
7. Even quite small amounts of moisture, e.g., less than 1% by volume, may
significantly reduce the effectiveness of porous insulations when temperature reversals occur. In cold weather, when reversals do occur, the effect will probably be small, perhaps negligible. In many cases such small amounts of moisture may be built into roofs if damp
components are used. In the process large areas of the roof may be affected. Where a small amount of moisture is concerned, it may be dissipated and the roof dried out, although that would depend on circumstances.
NOMENCLATURE
I, J , K = transfer coefficients
TT, TB = temperatures, top, bottom surfaces of the
insulations
Q = heat flux, W/m2
Q
*
= cumulative heat flux, Wh/m2-daySubscripts -
t, d l
m
= total, dry, moistREFERENCES
Bomberg, M., and Shirtliffe, C. 1978. Influence of moisture and moisture gradients on heat transfer through porous materials. ASTM STP 660, Thermal Transmission Measurements of Insulation, pp. 211-33 (NRCC 17138).
Hedlin, C. P. 1985. Calculation of thermal conductance based on measurement
of heat flow rates in flat roofing using heat flux transducers. ASTM STP 885,
Building A~plications of Heat Flux Transducers, Dec. pp. 181-201. NRCC
Hedlin, C.P. 1983. Effect of moisture on thermal resistance of some
insulations in a flat roof under field-type conditions. Thermal Insulation,
Materials, and Systems for Energy Conservation in the 80's. ASTM STP 789, Jan., pp. 602-25 (NRCC 22430).
Hedlin, C.P. 1988. Heat transfer in a wet porous thermal insulation in a
flat roof. :?ournal of Thermal Insulation Jan., p p . 165-188.
Hedlin, C.P. 1987. Seasonal variations in the modes of heat transfer in a moist porous thermal insulation in a flat roof. Journal of Thermal
Insulation. Aug.
Langlais, C., et al. 1983. Influence of moisture on heat transfer through
fibrous insulating materials. ASTM STP 789, Thermal Insulation Materials and
Systems for Energy Conservation in the 801s, pp. 563-81.
Shuman, E.C. 1980. Field measurement of heat flux through a roof with
saturated thermal insulation and covered with black and white granules. ASTM STP 718, Dec., pp. 519-39.
Stephenson, D.G., and Mitalas, G.P. 1971. Calculation of heat conduction transfer functions for multilayer slabs. ASHRAE Transactions, Vol. 77, Pt. 11, pp. 117-26. NRCC 14015.
Thomas, W. C., et al. 1980. Heat transfer in glass fiber roof-insulating material. ASTM STP 718, pp. 582-601.
TABLE
1
Transfer coefficients for dry glass fiber insulation 61 mm thick. Set # 1 is for a specimen 600 mm square. Set # 2 is for an encapsulated specimen 107 mm
in diameter.
Set 10 I 1 I 2 J1 2 KO KI K2
li
1 -.18952-.20342+.12617+.49013+.04006+.57626+.14134-.45087
TABLE 2
Daily average totals of heat flows measured for specimens
of
different moisture content (Qt*), average computedor
measured heat fluxes for dry insulation (Qd* ),
and differences (Qm* = Qt* -Qd* 1.
Values are in wh/rn2*day.Asterisks
are
used to distinguish these cumulative values from the hourly values. ( m ) designates those lines that contain measured heat flow for dry insulation, a s opposed to calculated values.Gravel cover Black surface
mc Qt* Qd* Qm* Qt* Qd* Qm* Qt* Qd* Qm* Qt* Qd* Qm*
% vol
(
+
1 (-
1 (+
1 (-
10.1 50 47 3 11 7 4
w
HEAT FLUX TRANSDUCER
/
THERMOCOUPLE
ROOF 'M A S K I N G
CAPSULATE
/
ID SPECIMEN
- - - . - - - - . - . -I N S U L A T I O N TO UNDERSIDE OF
DECK
Figure I Two arrangements used for measurement of heat /lux in moist insulafions. Figure l a had
either 40 mm thick coarse gravel cover or was an unprotected black surface. Figure 16
had gravel cover. Thermocouples located at top and bottom surfaces of insulation specimens.
Figure 2 The six panels show results for 0.1. 0.25. 0.5. 1. 3 and 9% mc mineral fiber insulation 61
mm thick. under 40 mm thick gravel cover. The bottom curves in each panel show the temperature difference (K). the estimated heat flux for dry insulation and the measured heat flux for the indicated moisture content. The top section of each panel gives daily totals of temperature difference (Kh i r . degree hours), estimated heat flow for d r y
20
15
-10
-
-15
--.-
DRY
0.25
mc
-20
-...
...*.
MEASURED
T
DlFF
-25
0
I 1 1 I I I I I 10
12
24
36
48
60
72
84
96
108 120
HOUR NUMBER
Figure 5 Measured heat fluxes for 0.25 and 0.5% mc insulation and heat fluxes predicted for dry insulation using the temperature sets obtained in the tests.
O
GRAVEL
Q * ~
C A L C U L A T E D
O
B L A C K
Q * ~
C A L C U L A T E D
GRAVEL
Q * ~
M E A S U R E D
MOISTURE
CONTENT,
O/oBY VOLUME
Figure 7 Rrios of Qt*/Qde for tests on gravel and block roof surfaces plotfed against
DISCUSSION
D.M. Burch, Mechanical Engineer, National Bureau of Standards, Gaithersburg, MD: Have you conjectured on the mechanism by which moisture has such a large effect on the heat transfer?
C.P. Hedlin: Yes. We have based some analyses on a very simple model. It assumes that moisture at the warm surface (interior at night and exterior during the day) evaporates and migrates through the insulation. It is assumed to condense at the cold surface. The process is reversed when the temperature difference reverses. Since the latent heat of vaporization is involved, the effect on heat transmission is significant, even when the insulation contains small amounts of moisture, e.g., less than 1% by volume.