HAL Id: hal-01990087
https://hal.archives-ouvertes.fr/hal-01990087
Submitted on 28 Oct 2019
HAL is a multi-disciplinary open access
archive for the deposit and dissemination of
sci-entific research documents, whether they are
pub-lished or not. The documents may come from
teaching and research institutions in France or
abroad, or from public or private research centers.
L’archive ouverte pluridisciplinaire HAL, est
destinée au dépôt et à la diffusion de documents
scientifiques de niveau recherche, publiés ou non,
émanant des établissements d’enseignement et de
recherche français ou étrangers, des laboratoires
publics ou privés.
Alternative methodology for linear polarization
resistance assessment of reinforced concrete structure
Gabriel Samson, Fabrice Deby, Jean-Luc Garciaz, Jean-Louis Perrin
To cite this version:
Gabriel Samson, Fabrice Deby, Jean-Luc Garciaz, Jean-Louis Perrin. Alternative methodology for
linear polarization resistance assessment of reinforced concrete structure. MATEC Web of Conferences,
EDP sciences, 2018, 199, pp.06009. �10.1051/matecconf/201819906009�. �hal-01990087�
Alternative methodology for linear polarization resistance
assessment of reinforced concrete structure
Gabriel Samson1, Fabrice Deby*,1, Jean-Luc Garciaz2, Jean-Louis Perrin2
1 LMDC, INSAT/UPS Génie Civil, 135 Avenue de Rangueil, 31077 Toulouse cedex 04 France. 2 LERM SETEC, 23 Rue de la Madeleine, 13631 Arles cedex France
Abstract. For reinforced concrete structures, several corrosion detection methods exist: concrete
resistivity, half-cell potential or linear polarization resistance (LPR) measurement. The LPR value can be linked to the corrosion rate thanks the Stern-Geary equation if strong hypotheses are made. Existing commercial devices use a guard ring to canalize the current on specific steel rebar area and assume that the steel rebar is uniformly polarized. However, recent works reveal that the top part of the steel rebar, right under the counter electrode, is the most polarized point. The particular point is referred as the point of interest (PI). This works belongs to the DIAMOND project which aims to produce a new corrosion rate measurement device. Comsol® software was used to model the influence of concrete cover, resistivity and injected current on the current density at the PI. Moreover, a significant influence of the steel rebars diameter was also demonstrated. Two types of abacus are built. The first one links to polarization measured on the surface to the polarization on the rebar at the PI. The second links the ratio between the current density at the PI and the density of injected current to concrete cover and steel rebar diameter. The Stern-Geary equation can now be used at the PI without using the approximation of a uniformly polarized rebar. The corrosion state of reinforced concrete structure can be controlled more precisely. The methodology is then applied on two concrete slabs in which three metal bars are embedded at different concrete covers. The first slab is prepared with ordinary concrete while the second contain chloride to artificially activate the corrosion process. The results reveal that the rebars embedded on the first slab are not corroding (icorr ≤ 0.2 µA/cm2) while the second rebar are corroding (icorr > 0.2 µA/cm2).
1 Introduction
The corrosion of steel bars is a major issue in the durability of reinforced concrete structures [1]. To assess the corrosion state of reinforced concrete structure, three physical values can be measured, in theory: half-cell potential, concrete resistivity or linear polarization resistance (LPR). Half-cell potential method evaluates the risk of corrosion by measuring the corrosion potential Ecorr [2]. However, half-cell potential
measurement only provides qualitative assessment regarding corrosion. Resistivity is being increasingly considered as a durability index for assessing the long-term performance of concrete structures [2-4]. Concrete cover resistivity can be measured by the device presented in this article. However, we focus here on corrosion rate measurement. During the last decade, the growing interest of assessing corrosion by more quantified techniques than the half-cell or resistivity methods leads to several publications dealing with corrosion rate [6–10]. Corrosion rate of steel plays an important role in safety evaluation, maintenance decision and residual life prediction of the existing RC structures [8]. Andrade et al. [11] defined four corrosion levels based on corrosion rate. For example, if
icorr < 0.1 µA/cm2, the corrosion level is negligible and if
it is higher than 1 µA/cm2, the corrosion level is high.
Most of the time corrosion rate is measured according to the RILEM TC 154-EMC [12] recommendations. This method is based on empirical relation between corrosion rate and the polarisation resistance RP developed by Stern and Geary [13].
However, this method is based on two strong hypotheses that cannot be completed on-site. First, the rebar is supposed to be uniformly polarized. Several recent studies, usually based on numerical simulation, proved that this is not the case. The point on the rebar, right under the polarizing probe, is the most polarized point [14–17]. This point is referred as the point of interest (PI). Secondly, the polarization area is supposed to be controlled. Commercial devices use a similar confinement technique in order to master the polarized area and determine the polarization resistance. The confinement technique is based on the introduction on a confinement ring that is supposed to confine the current on a well-defined area of the steel rebar [6]. Investigations revealed that different corrosion rates were obtained when these commercially devices are used [18–21]. The main reason for the discrepancies is attributed to confinement problems [22,23]. Thus a new
solution can be proposed in order to produce more reliable results.
This work belongs to the DIAMOND project [24] which aims to create a new electrochemical device to assess corrosion of reinforced concrete structure by measuring simultaneously half-cell corrosion potential, concrete resistivity and corrosion rate with the same device. It consists on a more simple geometry (no guard ring) and is based on corrosion rate measurement on a single point, the PI.
The present study focusses on corrosion rate assessment. The DIAMOND probe will be first presented. Then, the measurement methodology is introduced. The measurement is then numerically modelled using COMSOL® software. The results are presented in abacus were three parameters are taken into account: concrete cover and resistivity, rebar diameter. Experiments on different covers samples are finally performed to validate the method.
2 Materials and experimental setup
2.1 DIAMOND probe
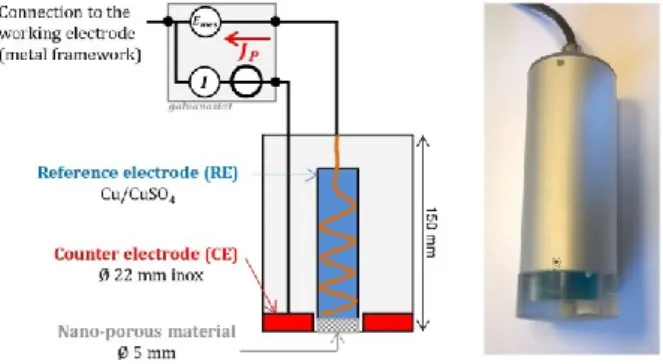
The schematic layout of the DIAMOND probe is presented in Figure 1. The potential at the concrete surface is measured on the centre of the probe, on a small circular surface (5 mm diameter) with a Cu/CuSO4
RE. The counter-electrode (CE) has a ring shape with 8 mm internal diameter and 22 mm external diameter (Figure 1). This device is simpler (no guard ring) compared to the commercials devices (GECOR and GalvaPulse) usually employed to determine rebar corrosion rate. The injected current JP is controlled by a
galvanostat developed in our laboratory. It was calibrated with an Iso-tech multimeter. A photo of the probe is also presented in Figure 1.
Fig. 1. DIAMOND probe: schematic layout and side view
photo.
2.2 Measurement methodology
For one-electrode measurement, an electrical connection is performed to the rebar. The rebar diameter D and cover thickness c can be evaluated by non-destructive technique [25]. The polarization of rebar is a transient phenomenon. The rebar / concrete interface can be modelled by a Randles equivalent circuit [26] which
associated the polarization resistance RP and the
capacitance C. This representation is presented in one dimension. In reality, it should take into account the three-dimensional nature of the problem. The rebar is polarized using a galvanostatic method. The instantaneous ohmic drop is used to determine the concrete cover resistivity. The potential on the surface is then registered once the response is stabilized. The injected current is JP = 10 µA.
2.3 Concrete slab specimens
Two concrete slabs (400 x 400 x 120 mm³) were prepared with CEM I cement and a very high water/cement ratio of 1.05. Each slab contains 3 rebars (D = 8, 10 and 12 mm) respectively positioned 15, 25 and 40 mm under the concrete surface (Fig. 2). The quality of the produced concrete was voluntarily bad in order to promote corrosion and fast moisture balancing. The second slab contains chloride in order to activate corrosion. The samples were prepared and the tests began 8 weeks after their production. The slabs are placed outside in Arles, France.
Fig. 2. Concrete slabs geometry. Concrete covers are 15, 25
and 40 mm.
3 Finite element model
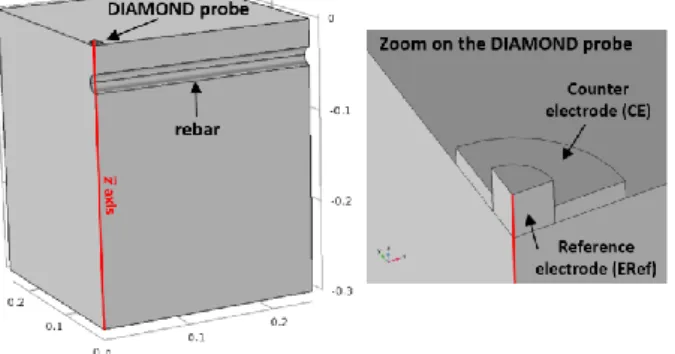
Only a quarter of the system was modelled because of the double symmetry of the problem. The current was injected through the CE. The RE was a cylinder in contact with the surface and the CE was a disc with a hole in it to enable RE contact with surface (Fig. 3). The injected current JP was kept at 10 µA for all numerical
experiments. RE and CE resistivity was 10-5 Ω.m.
Different rebar diameters were modelled (6, 10, 16 and 32 mm). Concrete cover ranged between 10 and 100 mm.
Tetrahedral elements were used for discretization. The maximum element size was fixed at 0.5 mm. The mesh was refined around the probe, the rebar surface and the 𝑧⃗ axis. The 𝑧⃗ axis was the axis passing through the centre of the RE and the top part of the rebar. It is represented by a red line in Fig. 3.
MATEC Web of Conferences 199, 06009 (2018) https://doi.org/10.1051/matecconf/201819906009 ICCRRR 2018
Fig. 3. Modelled geometry for D = 20 mm and c = 30 mm
(left). Zoom on the DIAMOND probe (right).
In the simulation, a constant current density was applied to the CE (JP / surface area of the CE). The
corrosion potential of the rebar was imposed Ecorr =
0.42 V and was intended to model an active rebar [15,27]. However, changing this potential did not change any of the numerical results given below. A very small electric resistance (0.00001 Ω) was implemented on the rebar/concrete interface to model the polarization resistance short-cut at the beginning of the polarization. Butler-Volmer equation was implemented on the rebar interface to model its behavior on steady-state. All other boundaries were electrically isolated.
4 Numerical results
To determine the LPR, both rebar polarization ΔEP and
current density at the PI jPI must be determined. Fig. 4
presents an example (D = 20 mm, c = 30 mm and ρ = 100 Ω.m) of the evolution of the potential along the z⃗ axis at t = 0 (continuous line) and under steady state (dotted line). The instantaneous ohmic drop ΔEΩ can be
measured on the surface and is used to determine the concrete cover resistivity. At this moment, the potential on the rebar interface remains equal to the corrosion potential. On steady-state, the rebar is polarized (ΔEP ≠ 0). Due to the three dimensional nature of the
problem, the rebar polarization is different from potential switch observed on the surface between the beginning and the stabilized state of the polarization (ΔEP ≠ ΔEtot
ΔEΩ). We can see on Figure that the upper part of the
rebar is more polarized than the bottom part.
In order to determine the polarisation on the rebar depending on the polarisation on the surface, Fig. 5 is introduced. This figure is obtained for a 100 Ω.m resistivity. Different evolutions are observed if the resistivity is modified. However, this ratio always remains bigger than one.
The ratio between current density at the PI and the injected current density is presented on Fig. 6 for 100 Ω.m resistivity and four different rebar diameters. This ratio both depends on rebar diameter and concrete
Fig. 4. Influence of the polarization on the electrical potential
along 𝒛⃗⃗ axis for D = 8 mm and c = 30 mm. At t = 0 (continuous line), on steady-state (dotted line).
Fig. 5. Ratio between the polarisation at the PI ΔEP and the polarisation on the surface ΔEP,suf depending on concrete cover for a 100 Ω.m resistivity and 5 different rebar diameters.
Fig. 6. Ratio between the current density at the PI jPI and the injected current density jP depending on concrete cover for a 100 Ω.m resistivity and four different rebar diameters.
cover. It decreased when the concrete cover increased as the current is more distributed along the rebar.
1.0 1.1 1.2 1.3 1.4 1.5 1.6 1.7 1.8 1.9 2.0 10 100 D = 6 mm D = 10 mm D = 16 mm D = 32 mm Cover c [mm] ΔEP,arm/ ΔEP,surf
ρ = 100 Ω.m 0.00 0.01 0.02 0.03 0.04 0.05 0.06 0.07 0.08 10 100 D = 6 mm D = 10 mm D = 16 mm D = 32 mm Cover c [mm] jPI/ jP ρ = 100 Ω.m
The same type of abacus was built for a wide range of concrete resistivity. These two types of abacus can now be used for LPR determination at the PI.
5 Experimental results
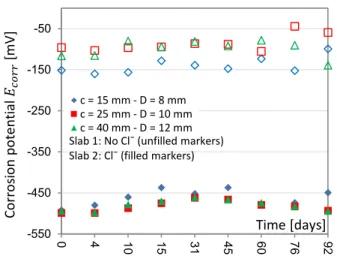
The corrosion potentials of each rebar of the two slabs previously introduced were followed during 92 days. The results are presented on Fig. 7. The chloride presence significantly decreases the corrosion potentials which indicate that the rebars actively corroded.
Fig. 7. Corrosion potentials evolution.
The corrosion rates of the two slabs are presented on Fig. 8 and Fig. 9. The measured corrosion rate on slab 1 are predominantly small (icorr < 0.1 µA/m2). However,
the deeper rebar (c = 40 mm - D = 12 mm) reached 0.2 µA/cm2 which can be associated to moderate
corrosion.
The measured corrosion rates on slab 2 are clearly higher than the values obtained without chloride. All values are higher than 0.1 µA/cm2 and few of them
exceeds 1 µA/cm2. The corrosion rate device developed
and the numerically built abacuses seem effective to determine corrosion rate of reinforced concrete structure.
Fig. 8. Corrosion rate measurement on slab 1 (no Cl‾) for the
three rebars.
Fig. 9. Corrosion rate measurement on slab 2 (Cl‾) for the three
rebars.
6 Conclusions
A new corrosion rate measurement device was presented in order to measure the LPR. The rebar is polarized using a galvanostatic method and the LPR was determined on single point, the PI, right under the probe. The measurement was modelled using Comsol® in order to take into account several influencing parameters: concrete cover and resistivity and rebar diameter. A first set of abacus was built to determine the polarization on the rebar at the PI and a second set to obtain the current density.
The methodology is then applied on two concrete slabs. The first one is prepared with ordinary concrete while the second contain chloride. The results reveal that the rebars embedded on the first slab are not corroding (icorr ≤ 0.2 µA/cm2) while the second rebar are corroding
(icorr > 0.2 µA/cm2) meaning that the developed
procedure seems reliable.
References
1. W. Morris, A. Vico, M. Vazquez, S.R. de Sanchez, Corros. Sci. 44 (2002) 81–99.
2. B. Yu, J. Liu, Z. Chen, Constr. Build. Mater. 138 (2017) 101–113.
3. W.J. McCarter, H.M. Taha, B. Suryanto, G. Starrs, Meas. Sci. Technol. 26 (2015) 085007.
4. M.G. Alexander, Y. Ballim, K. Stanish, Mater. Struct. 41 (2008) 921–936.
5. K. Reichling, M. Raupach, N. Klitzsch, Mater. Corros. 66 (2015) 763–771.
6. P.V. Nygaard, M.R. Geiker, Mater. Corros. 63 (2012) 200–214.
7. P. Ghods, O. b. Isgor, M. Pour-Ghaz, Mater. Corros. 58 (2007) 265–272.
8. B. Yu, L. Yang, M. Wu, B. Li, Constr. Build. Mater. 54 (2014) 385–401..
9. C. Andrade, C. Alonso, J. Sarrı́a, Cem. Concr. Compos. 24 (2002) 55–64 -550 -450 -350 -250 -150 -50 0 4 10 15 31 45 60 76 92 c = 15 mm - D = 8 mm c = 25 mm - D = 10 mm c = 40 mm - D = 12 mm Slab 1: No Cl¯ (unfilled markers) Slab 2: Cl¯ (filled markers)
Time [days] Corro sion p o ten tia l 𝐸 𝑐𝑜𝑟 𝑟 [m V] 0.01 0.1 1 10 0 4 10 15 31 45 60 76 92 c = 15 mm - D = 8 mm c = 25 mm - D = 10 mm c = 40 mm - D = 12 mm
Slab 1: No Cl¯
Time [days] Corro sion ra te 𝑖𝑐𝑜𝑟 𝑟 [µ A/cm ²] 0.01 0.1 1 10 0 4 10 15 31 45 60 76 92 c = 15 mm - D = 8 mm c = 25 mm - D = 10 mm c = 40 mm - D = 12 mmSlab 2: Cl¯
Time [days] Corro sion ra te 𝑖𝑐𝑜𝑟 𝑟 [µ A/cm ²]MATEC Web of Conferences 199, 06009 (2018) https://doi.org/10.1051/matecconf/201819906009 ICCRRR 2018
10. Wiley: Corrosion of Steel in Concrete: Prevention, Diagnosis, Repair, 2nd Edition - Luca Bertolini, Bernhard Elsener, Pietro Pedeferri, et al, (n.d.). 11. C. Andrade, C. Alonso, Constr. Build. Mater. 15
(2001) 141–145. 12. RILEM TC 154, (2004).
13. M. Stern, A.L. Geary, J. Electrochem. Soc. 104 (1957) 56–63.
14. M.E. Mitzithra, PhD Thesis, University of Toulouse III - Paul Sabatier, 2013.
15. M.E. Mitzithra, F. Deby, J.P. Balayssac, J. Salin, P, Nucl. Eng. Des. 288 (2015) 42–55.
16. A. Clément, S. Laurens, G. Arliguie, F. Deby, Eur. J. Environ. Civ. Eng. 16 (2012) 491–504.
17. S. Laurens, A. Clément, G. Arliguie, F. Deby, APPLET - Simulation numérique de la mesure de resistance de polarisation lineaires des armatures du beton, 2010.
18. P.V. Nygaard, M.R. Geiker, B. Elsener, Mater. Struct. 42 (2009) 1059–1076.
19. O.K. Gepraegs, C.M. Hansson, J. ASTM Int. 2 (2005) 1–16.
20. M. Raupach, B. Elsener, R. Polder, J. Mietz, , Woodhead Publishing, 2014.
21. P.V. Nygaard, Technical University of Denmark (DTU), 2009.
22. S. Feliu, J.A. González, J.M. Miranda, V. Feliu, Corros. Sci. 47 (2005) 217–238.
23. J.A. González, J.M. Miranda, S. Feliu , Corros. Sci. 46 (2004) 2467–2485.
24. DIAMOND project, Proj. Diam. - Diagn. Corros. Béton Armé - Sonde Captae. (2017). https://www.projet-diamond.com.
25. G. Klysz, J.-P. Balayssac, S. Laurens, NDT E Int.
37 (2004) 221–227.
26. C.J. Newton, J.M. Sykes, Corros. Sci. 28 (1988) 1051–1074.
27. M.G. Sohail, S. Laurens, F. Deby, J.P. Balayssac, Mater. Struct. 48 (2013) 217–233.


