Publisher’s version / Version de l'éditeur:
Advances in Cement Research, 23, 1, pp. 1-29, 2011-01-01
READ THESE TERMS AND CONDITIONS CAREFULLY BEFORE USING THIS WEBSITE. https://nrc-publications.canada.ca/eng/copyright
Vous avez des questions? Nous pouvons vous aider. Pour communiquer directement avec un auteur, consultez la
première page de la revue dans laquelle son article a été publié afin de trouver ses coordonnées. Si vous n’arrivez pas à les repérer, communiquez avec nous à PublicationsArchive-ArchivesPublications@nrc-cnrc.gc.ca.
Questions? Contact the NRC Publications Archive team at
PublicationsArchive-ArchivesPublications@nrc-cnrc.gc.ca. If you wish to email the authors directly, please see the first page of the publication for their contact information.
NRC Publications Archive
Archives des publications du CNRC
This publication could be one of several versions: author’s original, accepted manuscript or the publisher’s version. / La version de cette publication peut être l’une des suivantes : la version prépublication de l’auteur, la version acceptée du manuscrit ou la version de l’éditeur.
For the publisher’s version, please access the DOI link below./ Pour consulter la version de l’éditeur, utilisez le lien DOI ci-dessous.
https://doi.org/10.1680/adcr.9.00016
Access and use of this website and the material on it are subject to the Terms and Conditions set forth at
Effect of nano-CaCO3 on hydration of cement containing supplementary cementitious materials
Sato, T.; Beaudoin, J. J.
https://publications-cnrc.canada.ca/fra/droits
L’accès à ce site Web et l’utilisation de son contenu sont assujettis aux conditions présentées dans le site LISEZ CES CONDITIONS ATTENTIVEMENT AVANT D’UTILISER CE SITE WEB.
NRC Publications Record / Notice d'Archives des publications de CNRC: https://nrc-publications.canada.ca/eng/view/object/?id=d4fa7e74-6f40-41b2-8178-8e196376ede4 https://publications-cnrc.canada.ca/fra/voir/objet/?id=d4fa7e74-6f40-41b2-8178-8e196376ede4
http://www.nrc-cnrc.gc.ca/irc
Effe c t of na no-Ca Co3 on hydra t ion of c e m e nt c ont a ining supple m e nt a ry c e m e nt it ious m a t e ria ls
N R C C - 5 3 9 2 2
S a t o , T . ; B e a u d o i n , J . J .
O c t o b e r 2 0 1 0
A version of this document is published in / Une version de ce document se trouve dans: Advances in Cement Research, 23, (1), pp. 1-29, October 2010
The material in this document is covered by the provisions of the Copyright Act, by Canadian laws, policies, regulations and international agreements. Such provisions serve to identify the information source and, in specific instances, to prohibit reproduction of materials without written permission. For more information visit http://laws.justice.gc.ca/en/showtdm/cs/C-42
Les renseignements dans ce document sont protégés par la Loi sur le droit d'auteur, par les lois, les politiques et les règlements du Canada et des accords internationaux. Ces dispositions permettent d'identifier la source de l'information et, dans certains cas, d'interdire la copie de documents sans permission écrite. Pour obtenir de plus amples renseignements : http://lois.justice.gc.ca/fr/showtdm/cs/C-42
Title: Effect of Nano-CaCO3 on Hydration of Cement Containing Supplementary
Cementitious Materials
Authors: Taijiro Sato (Lead Author) and James J. Beaudoin
Affiliation: Institute for Research in Construction, National Research Council Canada Email Address: Taijiro.Sato@nrc-cnrc.gc.ca
Telephone: (613) 993-0089 Fax: (613) 954-5984
Postal Address: 1200 Montreal Rd., Building M-20, Ottawa, ON, K1A 0R6, Canada Number of Words: 3444
Number of Figures: 12 Number of Tables: 1
Abstract
The efficacy of the addition of nano-CaCO3 in accelerating the hydration of ordinary
Portland cement (OPC) delayed by the presence of high volumes of supplementary cementitious materials including fly ash and slag was investigated. The conduction calorimetry indicated that the early hydration of OPC was significantly accelerated by the addition of the nano-CaCO3 and the higher the amount of CaCO3 addition, the greater was
the accelerating effect. The thermogravimetric analysis results showed that the amounts of added CaCO3 became slightly lower as the hydration took place; however any new
reaction products were not detected by the X-ray diffractometry analysis. The engineering properties including microhardness and modulus of elasticity, in the early stage of the hydration were remarkably improved by the addition of nano-CaCO3. It was suggested
that the seeding effect of the nano-CaCO3 particles and the nucleation of C-S-H caused the
Introduction
The use of supplementary cementitious materials (SCMs) such as fly ash and slag as partial replacements of ordinary Portland cement (OPC) in concrete is widely known in the cement industry. It reduces not only the amount of industrial by-products going to landfills, but also the natural resources used in the manufacture of OPC and the associated CO2 emissions, which accounts for about 7% of the global CO2 emissions (Worrell et al.,
2001). Some of the SCMs also improve the long-term engineering properties of concrete, through a pozzolanic or hydraulic property of SCMs. One of the major drawbacks of concrete containing high volumes of SCMs, however, is the resulting delayed setting and slower initial strength development (Mehta and Gjørv, 1982). This issue becomes even more critical in cold weather (Bouzoubaâ and Fournier, 2003). The compensation of the delayed setting and slower initial strength development is essential as the use of high volumes of SCMs becomes popular.
The use of ground limestone (CaCO3) as a replacement of OPC in concrete is widely
practiced (Neville, 1995). The behavior of CaCO3 in the hydration of OPC has also been
intensively studied (Barker and Cory, 1991; Ingram and Daugherty, 1991; Kakali et al., 2000; Matschei et al., 2007). The results from a number of studies have indicated the positive effects of the CaCO3 addition on the hydration of cement paste and strength
development of hardened concrete, especially its accelerating effect on the rate of hydration. A study on the accelerating effect of the finely ground CaCO3 addition on the
hydration of C3S was conducted (Ramachandran and Zhang, 1986). It was concluded that
greater was the accelerating effect. The accelerating effect of the addition of the finely ground limestone on the hydration of OPC was also observed (Péra et al., 1999). The results of a study designed to determine the efficacy of the nano-CaCO3 in
accelerating the hydration of OPC delayed by the presence of high volumes of fly ash or slag are presented in this paper. A comparison was made with that of the micro-CaCO3 by
determining the rate of heat development and mechanical properties. The interaction of the nano-CaCO3 with OPC was also examined by the thermogravimetric analysis and X-ray
diffractometry.
Experimental
Materials
Ordinary Portland cement (OPC), Class “F” fly ash and ground granulated blast-furnace slag were supplied by Lafarge, Shaw Resources and the Standard Slag Cement Co., respectively. Reagent grade micro-CaCO3 and nano-CaCO3 were supplied by Anachemia
Canada Inc and READE, respectively. High purity water, supplied by Anachemia Canada Inc., was used as mixing water.
Sample Specifications and Experimental Techniques
The sample specifications for each experimental technique are shown in Table 1. The percentages of the CaCO3 content in Table 1 were based on the binder mass (OPC for
Series 1 and OPC + fly ash or slag for Series 2 and 3). The percentages of the fly ash content for Series 2 and the slag content for Series 3 were also based on the binder mass. A water/binder ratio (w/b) of 0.5 was used. A high-speed mechanical shaker was used for
10 seconds to blend the unhydrated OPC with micro- or nano-CaCO3 before mixing with
water for a better dispersion. The mechanical shaker was also used for the OPC Control, so that all the samples, with or without CaCO3, were subjected to the 10-second shaking to
keep them consistent in terms of a possible effect of the shaking on the samples. This blending process was used for the samples of all experimental techniques except for raw materials.
The scanning electron microscope (SEM) images were obtained using an Hitachi S4800 field emission gun scanning electron microscope with the accelerating voltage and the emission current at 1.2 keV and 7 μA, respectively. The nitrogen BET surface area of both micro- and nano-CaCO3 was determined using a Quantachrome Nova 2200e surface area
analyzer. The conduction calorimetry was performed using the Thermometric TAM Air Isothermal Calorimeter, 3114/3236 to determine the rate of heat development. The rate of heat development was calculated in joules per binder mass per hour. Thermogravimetric analysis (TGA) was conducted, using a TA Instruments, Q600, to calculate the amount of CaCO3 in the samples. The temperature was ramped from room temperature to 1050°C at
10°C/min with a 100 ml/min nitrogen gas flow. The X-ray diffractometry (XRD) measurements were collected, using a Scintag, XDS 2000 with CuKα radiation and a
graphite monochrometer. Continuous scans were performed at every 0.02° per second from 5° to 60° (2θ). The results were analysed using JADE software (Materials Data Inc.). The helium pycnometer, the Quantachrome Corporation, Stereopycnometer, was used to determine the porosity of the samples. A hydrated specimen was sliced into a circular plate, about 31.5 mm in diameter and 1.0 mm in thickness. It was weighed and its
dimensions were determined prior to the testing to calculate the bulk volume of the specimen. For TGA, XRD and helium pycnometry, the samples were immersed in isopropanol for 2 hours to stop hydration at a desired hydration period and dried under vacuum for 18 hours. The microhardness determination was performed using the DURIMET, Small-hardness Tester to study the surface characteristics and mechanical behaviour of the samples. A circular plate specimen was prepared in the same manner as the helium pycnometry. The microhardness was determined by the average of 49
indentations on the surface of the circular plate specimen under a static loading. The modulus of elasticity was determined using an instrument designed and fabricated at National Research Council Institute for Research in Construction. A circular plate specimen prepared in the same manner as the helium pycnometry was supported at 3 points and the deflection at the center point was recorded with various loadings. TGA, XRD, helium pycnometry, microhardness and modulus of elasticity measurements were performed at 1-, 3-, 7-, 14- and 28-day hydration with the addition of 10-hour hydration period for TGA and XRD.
Results and Discussion
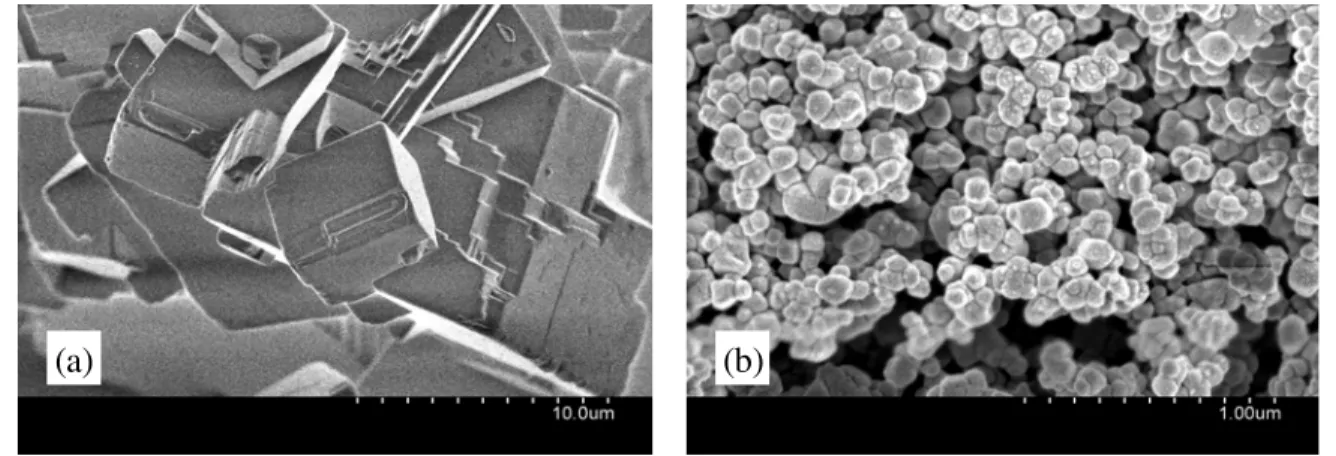
The scanning electron microscope (SEM) images, for each CaCO3 type are shown in Fig.
1 (a) and (b), with magnifications of ×5,000 and ×50,000, respectively. The particle size, observed by the SEM, of the micro-CaCO3 was approximately 5 to 20 μm, whereas that of
nano-CaCO3 was about 50 to 120 nm. The nitrogen BET surface area results for the
section consists of two parts. In the first part, the effect of each micro- and nano- CaCO3
addition on the hydration of OPC will be discussed (Series 1 in Table 1). No SCMs were therefore used. In the second part, the effect of each micro- and nano-CaCO3 addition on
the hydration of OPC – fly ash binder and OPC – slag binder will be discussed (Series 2 and 3 in Table 1).
Effect of the micro- and nano-CaCO3 additions on the hydration of OPC
The conduction calorimetry results for the OPC Control and OPC with the additions of 10% and 20% of micro-CaCO3 and nano-CaCO3 for w/b of 0.50 (Series 1 in Table 1) are
shown in Fig. 2. The rate of heat development of OPC was slightly accelerated by the additions of 10% and 20% micro-CaCO3 compared to the OPC Control. A similar slight
acceleration of hydration of OPC by the addition of micro-CaCO3 was previously
observed (Péra et al., 1999; Lothenbach et al. 2008). It was concluded that the additional surface provided by the addition of micro-CaCO3 for the nucleation and growth of the
hydration products was the reason for the observed slight acceleration. The rate of heat development of the OPC was significantly accelerated by the additions of both 10% and 20% nano-CaCO3 compared to the OPC Control and it was clearly indicated that the
higher the amount of nano-CaCO3 addition, the greater was the accelerating effect. It is
well-known that the conduction calorimetry curve of OPC has a small shoulder right after the main peak of hydration as shown in Fig. 2. It has been suggested that this shoulder is associated with the renewed formation of ettringite (Taylor, 1997). With the addition of the 20% nano-CaCO3, this shoulder was not only significantly accelerated but also
enhanced as shown in the figure. It indicates that the formation of ettringite and/or similar compounds may have been enhanced by the addition of nano-CaCO3.
The TGA was conducted to determine the amount of CaCO3, both the amount of CaCO3
originally in the OPC and the amount of CaCO3 separately added, in the samples hydrated
for 0 hours (unhydrated), 10 hours, 1 day and 3 days. The results are shown in Fig. 3. The 10-hour hydration period was included to investigate the effect of the enhanced heat development shown in Fig. 2 on the amount of CaCO3 in the sample. The percentages of
CaCO3 were normalised to the mass of OPC of the samples prior to the test. It should be
noted that the TGA analysis gave 98.6% of CaCO3 for testing the 99.0% pure control
micro-CaCO3 and 94.8% for the 98.0%-pure control nano-CaCO3. The TGA result of the
control nano-CaCO3 showed a mass loss of about 2.5% before 600°C. A further study is
needed to determine whether this mass loss is because of the decomposition of nano-CaCO3 or possibly because some nano-particles may have been blown away from the
sample cup by the 100 ml/min nitrogen gas flow. However, the determination of the amount of CaCO3 in the OPC samples shown in Fig. 3 depends on the decomposition peak
that occurs after 600°C. As a result, the amount of nano-CaCO3 shown in Fig. 3 was
corrected for the mass loss before 600°C. There was about 2.3% of CaCO3 in the
unhydrated OPC Control. Thus the unhydrated OPC with the additions of micro- and nano-CaCO3 had values about 2.3% higher than the added amount of CaCO3. A decrease
of the amount of CaCO3 in the OPC with the additions of 10% and 20% nano-CaCO3 after
10-hour hydration was relatively higher than that with the additions of 10% and 20% micro-CaCO3 as shown in Fig. 3. It may relate to the presence of the shoulder on the rate
of heat development curve. This was enhanced by the addition of the nano-CaCO3 and
occurred just before the 10-hour hydration, as indicated in Fig. 2. It has been reported that the CaCO3 in OPC may chemically react with tricalcium aluminate, C3A to form calcium
carboaluminate hydrates with or without the presence of gypsum (Ingram et al., 1990; Ramachandran, 1988). The chemical reaction of C3A with CaCO3 produces both high- and
low- carbonate forms of calcium aluminate hydrate, respectively,
3CaO·Al2O3·3CaCO3·32H2O and 3CaO·Al2O3·CaCO3·11H2O. This chemical reaction is
very similar to that of C3A with CaSO4·2H2O (gypsum) that produces both high-
(ettringite) and low- sulphate forms of calcium aluminate hydrate (Carleson and Berman, 1960; Klemm and Adams, 1990). The decrease of the amount of CaCO3 in the first 10
hours may be due to the consumption of CaCO3 by the chemical reaction with C3A. The
decrease of the amount of CaCO3 with the addition of nano-CaCO3 in the first 10 hours
was higher than that with the micro-CaCO3. The amount of CaCO3 continued to decrease
as the hydration took place and it was higher with the nano-CaCO3.
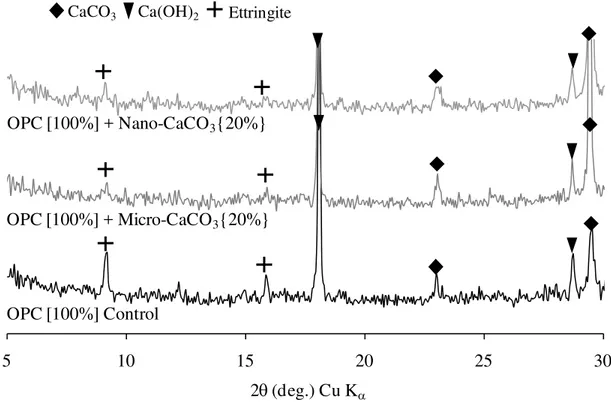
The XRD was also conducted for Series 1 shown in Table 1. Figure 4 shows the XRD results of the OPC Control and OPC with the additions of 20% micro- and nano-CaCO3 at
1-day hydration. The peaks of ettringite were observed in all samples, however, the peak intensities were lower with both the micro- and nano-CaCO3 than those with the OPC
Control, indicating that the amounts of ettringite formed were lower with the micro- and nano-CaCO3. The peaks for calcium carboaluminate hydrates, the other possible hydration
products due to the addition of CaCO3, were very small even with the intensive scan of the
may be needed to investigate possible chemical reactions of nano-CaCO3 during the
hydration of OPC.
Effect of the micro- and nano-CaCO3 additions on the hydration of OPC containing high
volumes of SCMs
The conduction calorimetry results for the samples in Series 2 and Series 3 in Table 1 are shown in Figs. 5 and 6, respectively. In Fig. 5, the hydration of OPC – fly ash binder was significantly delayed compared to that of the OPC Control, owing to the lower cement content in the sample. The rate of heat development of the OPC – fly ash binder was slightly accelerated by the additions of both 10% and 20% micro-CaCO3. The slight
acceleration by the addition of the micro-CaCO3 was also observed with the OPC Control
as shown in Fig. 2. When the nano-CaCO3 was added, the rate of heat development was
significantly accelerated and the higher the CaCO3 addition, the greater was the
accelerating effect. The hydration of OPC – slag binder was not delayed as much as OPC – fly ash binder, as shown in Fig. 6. A slight acceleration was observed with the additions of both 10% and 20% micro-CaCO3. Again, the rate of heat development was significantly
accelerated with the addition of nano-CaCO3, and the higher the CaCO3 addition, the
greater was the accelerating effect.
The microhardness results for the samples in Series 2 in Table 1, hydrated up to 3 days and 28 days are shown in Fig. 7 (a) and (b), respectively. The early strength development of the OPC – fly ash binder shown in Fig. 7 (a) was significantly delayed. The
which was expected from the conduction calorimetry results. The microhardness of OPC – fly ash binder, however, became considerably higher with the addition of the nano-CaCO3.
Those results were consistent with the observation from the conduction calorimetry curves shown in Fig. 5, where the rate of heat development was delayed by the presence of high volumes of fly ash and accelerated by the nano-CaCO3.
The microhardness results for the samples in Series 3 in Table 1, hydrated up to 3 days and 28 days are shown in Fig. 8 (a) and (b), respectively. The microhardness of the OPC – slag binder were significantly increased by the additions of 10% and 20% nano-CaCO3.
The rate of heat development of OPC was not delayed as much as the OPC – fly ash binder as shown in Fig. 6. However the microhardness of OPC – slag binder was as low as OPC – fly ash binder. In the case of slag, enhanced strength development was also
observed with the micro-CaCO3; this was not the case with fly ash. Figures 7 (b) and 8 (b)
both indicate that the strength development enhanced by the addition of nano-CaCO3,
continued up to 28-day hydration. It is generally known that the long-term strength development is likely to be unaffected even if the early hydration is accelerated by the admixture (Transportation Research Board, 1990). This was not the case with the addition of nano-CaCO3. The strength development in the early stages of hydration accelerated by
the addition of CaCO3 continued to improve up to 28-day hydration.
It was previously indicated that a small portion of the added CaCO3 may be interacting in
the hydration process. However, the hydration products directly interacted with CaCO3
the small shoulder of the calorimetry curve, but also the whole main peak of the calorimetry curve was enhanced and accelerated by the addition of nano-CaCO3. This
main peak is primarily attributed to the hydration of C3S. This is critical to strength
development and it is clear that the significant strength development shown in Figure 6 was a result of the accelerated hydration of C3S. The study on the effect of the finely
ground limestone addition on the hydration of C3S noted that the reaction products formed
between the hydrating C3S and the added CaCO3 could not be identified, as they were
present in only small amounts (Ramachandran, 1988). This indicates that there was likely something else responsible for accelerating the hydration and the significant strength development. One possible explanation is the seeding effect of the nano-CaCO3 particles
on the nucleation of C-S-H. The nucleation of C-S-H was accelerated by the presence of the well-crystalline nano-CaCO3 particles on the surface of the OPC grains. The effect of
two calcareous fillers, ground limestone and reagent grade CaCO3 on the compressive
strength of OPC was studied and it was argued that the calcareous fillers acted as
nucleation sites responsible for the acceleration effect on the early strength development (Soroka and Stern, 1976). However, a further study is needed to investigate the seeding effect of the nano-CaCO3 particles for the nucleation of C-S-H. The seeding effect of the
nano-CaCO3 for the nucleation of C-S-H should be distinguished from the effect for the
slight acceleration of OPC by the addition of micro-CaCO3. As mentioned earlier, the
slight acceleration of OPC by the addition of micro-CaCO3 has been explained by the
additional surface provided by the addition of micro-CaCO3 for the nucleation and growth
micro-CaCO3 was provided for OPC to form more C-S-H. In the case of the nano-CaCO3,
each nano-CaCO3 particle may promote formation of C-S-H on the OPC grains.
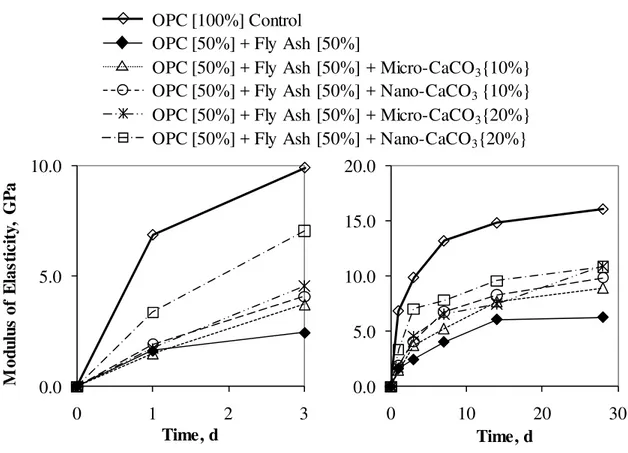
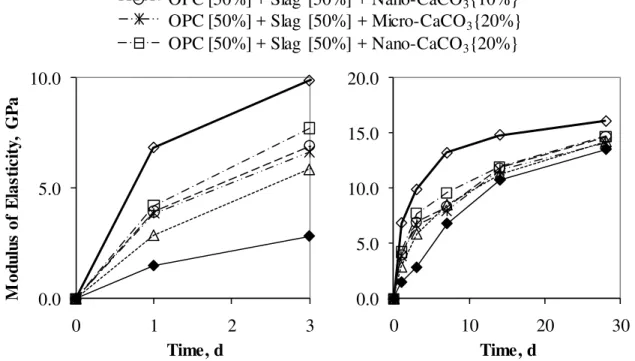
The modulus of elasticity results for the samples in Series 2 in Table 1, hydrated up to 3 days and 28 days are shown in Fig. 9 (a) and (b). The results for the samples in Series 3 in Table 1 hydrated up to 3 days and 28 days are shown in Fig. 10 (a) and (b). The modulus of elasticity results were very similar to those of microhardness. The early development of modulus of elasticity in the presence of fly ash or slag was significantly improved by the addition of nano-CaCO3. In the case of modulus of elasticity, the influence of the
micro-CaCO3 was relatively greater than in the case of the microhardness.
The porosity determinations were performed for the samples in Series 2 and 3 in Table 1 using the helium pycnometer. The results were plotted against microhardness as shown in Figs. 11 and 12, respectively. For each set of the results, the regression analysis was performed. Figure 11 indicates that the OPC Control had the highest values of
microhardness and OPC – fly ash binder the lowest. The microhardness with the additions of CaCO3 were in the following order: OPC – fly ash binder with 20% nano-CaCO3 >
10% nano-CaCO3 > 10% micro-CaCO3 and > 20% micro-CaCO3. Figure 12 also indicates
that the OPC Control was much higher than that for the OPC – slag binder. The
microhardness with the additions of CaCO3 was in the following order: OPC – slag binder
with 20% nano-CaCO3 >10% nano-CaCO3 > 20% micro-CaCO3 and > 10% micro-CaCO3.
It should be noted that the regression curve with the addition of the 20% nano-CaCO3
of the OPC Control was lower than that of OPC – slag binder with the addition of the 20% nano-CaCO3 when the porosity was lower than 41%, and higher when the porosity was
greater than 41%. The microhardness – porosity results provide a valid comparison for the cement systems studied. The validity of the comparison is however limited to the porosity range of the experimental data. The physical meaning of microhardness values outside the porosity range of the experimental data is complex. Dense crystalline products, for
example, can have microhardness values lower or higher than the OPC Control depending on the porosity range. The effect of grain boundaries and defects at low porosities can contribute to the non-linear behaviour in the microhardness – porosity plots.
Conclusions
The efficacy of the addition of nano-CaCO3 in accelerating the hydration of OPC delayed
by the presence of high volumes of SCMs was investigated. The conduction calorimetry indicated that the early hydration of the OPC was significantly accelerated by the addition of the nano-CaCO3 and the higher the amount of CaCO3 addition, the greater was the
accelerating effect. The TGA results showed that the amounts of added CaCO3 became
slightly lower as the hydration took place; however any new reaction products were not detected by the XRD analysis. The engineering properties including microhardness and modulus of elasticity, in the early stage of the hydration were remarkably improved by the addition of the nano-CaCO3. It was suggested that the seeding effect of the nano-CaCO3
particles and the nucleation of C-S-H caused the enhanced strength development. Further study is needed to confirm this.
References
Barker A. and Cory H., The Early Hydration of Limestone-filled Cements. In: N. Swamy, Editor, Blended Cements in Construction, Elsevier, London, 1991, 107–124
Bouzoubaâ N. and Fournier B. Current Situation of SCMs in Canada CANMET Report
MTL 2003-4 (TR), Natural Resources Canada, Ottawa, April 2003.
Carleson E.T. and Berman H.A., Some Observations on the Calcium Aluminate Carbonate Hydrates, Journal of Research of the National Bureau of Standards – A. Physics and
Chemistry, 64A, 4, 1960, 333-341
Ingram K.D. and Daugherty K.E., A Review of Limestone Additions to Portland Cement and Concrete, Cement and Concrete Composites, 1991, 13, 3, 165-170
Ingram K., Poslusny M., Daugherty K. and Rowe W. Carboaluminate Reactions as Influenced by Limestone Additions, In: P. Klieger and R.D. Hooton, Editors, Carbonate
Additions to Cement, STP 1064, ASTM, Philadelphia, 1990, 14–23.
Kakali G., Tsivilis S., Aggeli E. and Bati M., Hydration Products of C3A, C3S and
Portland Cement in the Presence of CaCO3, Cement and Concrete Research, 2000, 30, 7,
Klemm W.A. and Adams L.D., An Investigation of the Formation of Carboaluminates in Carbonate Additions to Cement, In: P. Klieger and R.D. Hooton, Editors, Carbonate
Additions to Cement, STP 1064, ASTM, Philadelphia, 1990, 60-72
Lothenbach B., Le Saout G., Gallucci E. and Scrivener K., Influence of Limestone on the Hydration of Portland Cements, Cement and Concrete Research, 2008, 38(6), 848-860
Matschei T., Lothenbach B. and Glasser F.P., The Role of Calcium Carbonate in Cement Hydration, Cement and Concrete Research, 2007, 37, 4, 551-558
Mehta P.K. and Gjørv O.E. Properties of Portland Cement Concrete Containing Fly Ash and Condensed Silica-fume, Cement and Concrete Research, 1982, 12, 5, 587-595
Neville A.M. Properties of Concrete (4th edition) Prentice Hall, Harlow, UK, 1995.
Péra J., Husson S. and Guilhot B., Influence of Finely Ground Limestone on Cement Hydration, Cement and Concrete Composites, 1999, 21(2), 99-105
Ramachandran V.S. Thermal Analysis of Cement Components Hydrated in the Presence of Calcium Carbonate, Thermochimica Acta, 127, 1988, 385-394
Ramachandran V.S. and Zhang C., Influence of CaCO3 on Hydration and Microstructural
Soroka I. and Stern N., Calcareous Fillers and the Compressive Strength of Portland Cement, Cement and Concrete Research, 1976, 6(7), 367-376
Taylor H.F.W., Cement Chemistry (2nd edition) Thomas Telford, London, 1997.
Transportation Research Board, Admixtures and Ground Slag for Concrete,
Transportation Research Circular no. 365 (December), 1990, Washington: Transportation
Research Board, National Research Council
Worrell E., Price L., Hendricks C., Meida L.O., Carbon Dioxide Emissions from the Global Cement Industry, Annual Review of Energy and Environment, 2001, 26, 303-329
Table 1: Sample specifications for each experimental technique
SEM
BET Surface Area
Conduction Calorimetry TGA X-ray Diffra ction Helium Pyc nometry Microhardn ess Modulus of Elasticity Raw Materials Micro-CaCO3 Nano-CaCO3 - - - -- -Series 1 (w/b 0.50) OPC [100%] Control OPC [100%] + Micro-CaCO3{10%}* OPC [100%] + Nano-CaCO3{10%} OPC [100%] + Micro-CaCO3{20%} OPC [100%] + Nano-CaCO3{20%} -- - - - - -Series 2 (w/b 0.50)
OPC [50%] + Fly Ash [50%]
OPC [50%] + Fly Ash [50%] + Micro-CaCO3{10%}
OPC [50%] + Fly Ash [50%] + Nano-CaCO3{10%}
OPC [50%] + Fly Ash [50%] + Micro-CaCO3{20%}
OPC [50%] + Fly Ash [50%] + Nano-CaCO3{10%}
-- - - - - - - - - - Series 3 (w/b 0.50) OPC [50%] + Slag [50%]
OPC [50%] + Slag [50%] + Micro-CaCO3{10%}
OPC [50%] + Slag [50%] + Nano-CaCO3{10%}
OPC [50%] + Slag [50%] + Micro-CaCO3{20%}
OPC [50%] + Slag [50%] + Nano-CaCO3{20%}
-- - - - - - - - - -
* The CaCO3 contents are expressed as a percentage of the total binder content (i.e. OPC,
(a) (b)
Fig. 1: SEM images of (a) micro-CaCO3 and (b) nano-CaCO3 with magnifications of
×5,000 and ×50,000, respectively 0 5 10 15 20 0 8 16 24 32 40 48 R a te of H eat D evel o p m ent , J/ g/ h Time, h Small Shoulder 10 h OPC [100%] Control OPC [100%] + Micro-CaCO3{10%} OPC [100%] + Nano-CaCO3{20%} OPC [100%] + Micro-CaCO3{20%} OPC [100%] + Nano-CaCO3{10%}
Fig. 2: Conduction calorimetry results for OPC Control and OPC with the additions of micro- and nano-CaCO3 for w/b of 0.50
0 5 10 15 20 25 0 1 2 3 Am o u n t o f Ca CO 3 , % Time, days OPC [100%] Control OPC [100%] + Micro-CaCO3{10%} OPC [100%] + Nano-CaCO3{20%} OPC [100%] + Micro-CaCO3{20%} OPC [100%]+ Nano-CaCO3{10%}
Fig. 3: The amounts of CaCO3, determined by TGA, for the OPC Control and OPC with
the additions of micro- and nano-CaCO3 for w/b 0.50 at 0, 10-hour, 1-day and 3-day
5 10 15 20 25 3 2θ (deg.) Cu Kα OPC [100%] Control OPC [100%] + Micro-CaCO3{20%} OPC [100%] + Nano-CaCO3{20%} CaCO3 0 Ca(OH)2 Ettringite
Fig. 4: The XRD results of the OPC Control and OPC with the 20% additions of micro- and nano-CaCO3 for w/b 0.50 at 1-day hydration
Fig. 5: Conduction calorimetry results for OPC Control, OPC – fly ash binder and OPC – fly ash binder with the additions of micro- and nano-CaCO3 for w/b 0.50
0 5 10 15 20 0 8 16 24 32 40 48 R at e of H e at D e ve lop m e n t, J/ g/ h Time, h OPC [100%] Control
OPC [50%] + Fly Ash [50%] + Micro-CaCO3{10%}
OPC [50%] + Fly Ash [50%] + Nano-CaCO3{20%} OPC [50%] + Fly Ash [50%] + Micro-CaCO3{20%} OPC [50%] + Fly Ash [50%] + Nano-CaCO3{10%} OPC [50%] + Fly Ash [50%]
0 5 10 15 20 0 8 16 24 32 40 48 R a te of H e at D e ve lo p m e n t, J/ g/ h Time, h OPC [100%] Control
OPC [50%] + Slag [50%] + Micro-CaCO3{10%}
OPC [50%] + Slag [50%] + Nano-CaCO3{20%} OPC [50%] + Slag [50%] + Micro-CaCO3{20%} OPC [50%] + Slag [50%] + Nano-CaCO3{10%} OPC [50%] + Slag [50%]
Fig. 6: Conduction calorimetry results for OPC Control, OPC – slag binder and OPC – slag binder with the additions of micro- and nano-CaCO3 for w/b 0.50
0.0 60.0 120.0 180.0 0 10 20 Time, d 30 0.0 20.0 40.0 60.0 80.0 100.0 120.0 0 1 2 3 M ic roh ar d n e ss , M P a Time, d OPC [100%] Control
OPC [50%] + Fly Ash [50%] + Micro-CaCO3{10%}
OPC [50%] + Fly Ash [50%] + Nano-CaCO3{20%} OPC [50%] + Fly Ash [50%] + Micro-CaCO3{20%} OPC [50%] + Fly Ash [50%] + Nano-CaCO3{10%} OPC [50%] + Fly Ash [50%]
Fig. 7: Microhardness results for OPC Control, OPC – fly ash binder and OPC – fly ash binder with the additions of micro- and nano-CaCO3 for w/b 0.50 for (a) 3-day and (b)
0.0 60.0 120.0 180.0 0 10 20 Time, d 30 0.0 20.0 40.0 60.0 80.0 100.0 120.0 0 1 2 3 M ic roh ar d n e ss , M P a Time, d OPC [100%] Control
OPC [50%] + Slag [50%] + Micro-CaCO3{10%}
OPC [50%] + Slag [50%] + Nano-CaCO3{20%}
OPC [50%] + Slag [50%] + Micro-CaCO3{20%}
OPC [50%] + Slag [50%] + Nano-CaCO3{10%}
OPC [50%] + Slag [50%]
Fig. 8: Microhardness results for OPC Control, OPC – slag binder and OPC – slag binder with the additions of micro- and nano-CaCO3 for w/b 0.50 for (a) 3-day and (b) 28-day
0.0 5.0 10.0 15.0 20.0 0 10 20 3 Time, d 0 0.0 5.0 10.0 0 1 2 3 M o d u lu s of E las ti ci ty , G P a Time, d OPC [100%] Control
OPC [50%] + Fly Ash [50%] + Micro-CaCO3{10%}
OPC [50%] + Fly Ash [50%] + Nano-CaCO3{20%}
OPC [50%] + Fly Ash [50%] + Micro-CaCO3{20%}
OPC [50%] + Fly Ash [50%] + Nano-CaCO3{10%}
OPC [50%] + Fly Ash [50%]
Fig. 9: Modulus of elasticity results for OPC Control, OPC – fly ash binder and OPC – fly ash binder with the additions of micro- and nano-CaCO3 for w/b 0.50 for (a) 3-day and (b)
0.0 5.0 10.0 15.0 20.0 0 10 20 3 Time, d 0 0.0 5.0 10.0 0 1 2 3 M o dul us o f E la st ic it y, G P a Time, d OPC [100%] Control
OPC [50%] + Slag [50%] + Micro-CaCO3{10%}
OPC [50%] + Slag [50%] + Nano-CaCO3{20%}
OPC [50%] + Slag [50%] + Micro-CaCO3{20%}
OPC [50%] + Slag [50%] + Nano-CaCO3{10%}
OPC [50%] + Slag [50%]
Fig. 10: Modulus of elasticity results for OPC Control, OPC – slag binder and OPC – slag binder with the additions of micro- and nano-CaCO3 for w/b 0.50 for (a) 3-day and (b)
10 100 1000 25.0 30.0 35.0 40.0 45.0 50.0 55.0 M icr oh ar d n e s s, M P a Porosity, % OPC [100%] Control
OPC [50%] + Fly Ash [50%] + Micro-CaCO3{10%}
OPC [50%] + Fly Ash [50%] + Nano-CaCO3{20%} OPC [50%] + Fly Ash [50%] + Micro-CaCO3{20%} OPC [50%] + Fly Ash [50%] + Nano-CaCO3{10%} OPC [50%] + Fly Ash [50%]
Fig. 11: The logarithms of microhardness values versus porosity for OPC Control, OPC – fly ash binder and OPC – fly ash binder with the additions of micro- and nano-CaCO3
10 100 1000 25.0 30.0 35.0 40.0 45.0 50.0 55.0 M icr oh ar d n e ss , M P a Porosity, % OPC [100%] Control
OPC [50%] + Slag [50%] + Micro-CaCO3{10%}
OPC [50%] + Slag [50%] + Nano-CaCO3{20%}
OPC [50%] + Slag [50%] + Micro-CaCO3{20%}
OPC [50%] + Slag [50%] + Nano-CaCO3{10%}
OPC [50%] + Slag [50%]
Fig. 12: The logarithms of microhardness values versus porosity for OPC Control, OPC – slag binder and OPC – slag binder with the additions of micro- and nano-CaCO3