EUROPEAN ORGANISATION FOR NUCLEAR RESEARCH (CERN)
CERN-PH-EP-2012-317
Submitted to: JHEP
Search for third generation scalar leptoquarks in
pp
collisions
at
√
s
= 7 TeV with the ATLAS detector
The ATLAS Collaboration
Abstract
A search for pair-produced third generation scalar leptoquarks is presented, using proton–proton collisions at√s= 7 TeV at the LHC. The data were recorded with the ATLAS detector and correspond to an integrated luminosity of 4.7 fb−1. Each leptoquark is assumed to decay to a tau lepton and a b-quark with a branching fraction equal to 100%. No statistically significant excess above the Stan-dard Model expectation is observed. Third generation leptoquarks are therefore excluded at 95% confidence level for masses less than 534 GeV.
PREPARED FOR SUBMISSION TOJHEP
Search for third generation scalar leptoquarks in pp
collisions at
√
s
= 7 TeV with the ATLAS detector
The ATLAS Collaboration
ABSTRACT: A search for pair-produced third generation scalar leptoquarks is presented, using proton–proton collisions at √s = 7 TeV at the LHC. The data were recorded with the ATLAS detector and correspond to an integrated luminosity of 4.7 fb−1. Each leptoquark is assumed to decay to a tau lepton and a b-quark with a branching fraction equal to 100%. No statistically significant excess above the Standard Model expectation is observed. Third generation leptoquarks are therefore excluded at 95% confidence level for masses less than 534 GeV.
Contents
1 Introduction 1
2 The ATLAS detector 2
3 Monte Carlo simulations 3
4 Physics object identification 4
5 Event selection 5 6 Background estimation 6 6.1 Electron channel 7 6.2 Muon channel 9 6.3 Background summary 10 7 Systematic uncertainties 11 7.1 Object-level uncertainties 11 7.2 Theoretical uncertainties 12 7.3 Background uncertainties 13
7.4 Summary of systematic uncertainties 14
8 Results 14
9 Conclusions 18
10 Acknowledgements 18
1 Introduction
Leptoquarks (LQ) are colour-triplet bosons that carry both lepton and baryon numbers and have a fractional electric charge. They are predicted by many extensions of the Standard Model (SM) [1– 7] and may provide unification between the quark and lepton sectors. In accordance with experi-mental results on lepton-number violation, flavour-changing neutral currents and proton decay, it is assumed that individual leptoquarks do not couple to particles from different generations [8,9], thus leading to three generations of leptoquarks. The most recent limit on pair-produced third generation scalar leptoquarks (LQ3) decaying to τbτb comes from the CMS experiment, in which scalar leptoquarks with masses below 525 GeV are excluded at the 95% confidence level (CL)[10]. Limits have also been set by the D0 [11] and CDF [12] experiments at the Tevatron, which have excluded third generation scalar leptoquarks with masses up to 210 GeV and 153 GeV respec-tively. First and second generation scalar leptoquarks have been excluded up to 830 GeV and 840
GeV respectively [13–15]. The results presented here are based on a total integrated luminosity of 4.7 fb−1of proton-proton collision data at a centre-of-mass energy of√s= 7 TeV, collected by the ATLAS detector at the LHC during 2011. The final states investigated arise from the decay of both leptoquarks into a tau lepton and a b-quark, leading to a τbτb final state. The branching fraction of LQ3decays to τb is assumed to be equal to 100%.
Tau leptons can decay either leptonically (to an electron or muon plus two neutrinos), or hadronically (typically to one or three charged hadrons, plus one neutrino, and zero to four neu-tral hadrons). Since the final state includes two taus, this leads to three possible sub-categories of events: di-lepton, lepton–hadron and hadron–hadron. Of these, the lepton–hadron category has the largest branching fraction (45.6%), and the presence of one charged light lepton (` = e, µ) in the event is useful for event triggering and provides better rejection of the multi-jets background. Only the lepton–hadron decay mode is considered in this analysis, resulting in either an eτhad-visbb+ 3ν or µτhad-visbb+ 3ν final state, where τhad-vis refers to the visible (non-neutrino) components of the hadronic tau decay.
Selected events are therefore required to have one electron or muon with large transverse momentum (pT), one high-pT hadronically decaying tau, missing transverse energy from the tau decays, and two high-pT jets. Searches are performed independently for the electron and muon channels. The results are subsequently combined and interpreted as lower bounds on the LQ3 mass.
2 The ATLAS detector
The ATLAS detector [16] is a multi-purpose detector with a forward-backward symmetric cylindri-cal geometry and nearly 4π coverage in solid angle. ATLAS uses a right-handed coordinate system with its origin at the nominal interaction point (IP) and the z-axis along the beam pipe. The x-axis points from the IP to the centre of the LHC ring, and the y-axis points upward. Cylindrical coor-dinates (r, φ ) are used in the transverse (x, y) plane, with φ being the azimuthal angle around the beam pipe. The pseudorapidity η is defined in terms of the polar angle θ by η = −ln(tan(θ /2)). The three major sub-components of ATLAS are the tracking detector, the calorimeter and the muon spectrometer.
Charged particle tracks and vertices are reconstructed using silicon pixel and microstrip de-tectors covering the range |η| < 2.5, and by a straw tube tracker that covers |η| < 2.0. Electron identification capability is added by employing Xenon gas to detect transition radiation photons created in a radiator between the straws. The inner tracking system is immersed in a homogeneous 2 T magnetic field provided by a solenoid.
Electron, jet and tau energies are measured in the calorimeter. The ATLAS calorimeter sys-tem covers a pseudorapidity range of |η| < 4.9. Within the region |η| < 3.2, electromagnetic calorimetry is provided by barrel and end-cap high-granularity lead/liquid argon (LAr) electro-magnetic (EM) calorimeters, with an additional thin LAr presampler covering |η| < 1.8, to correct for energy loss in material upstream of the calorimeters. Hadronic calorimetry is provided by a steel/scintillator-tile calorimeter, segmented into three barrel structures within |η| < 1.7, and two copper/LAr hadronic end-cap calorimeters. The forward region (3.1 < |η| < 4.9) is instrumented by a LAr calorimeter with copper (EM) and tungsten (hadronic) absorbers.
Surrounding the calorimeters, a muon spectrometer with air-core toroids, a system of precision tracking chambers providing coverage over |η| < 2.7, and detectors with triggering capabilities over |η| < 2.4 to provide precise muon identification and momentum measurements.
A three-level event-triggering system selects inclusive electron and muon candidates to be recorded for offline analysis.
3 Monte Carlo simulations
Simulated signal events are produced using the PYTHIA 6.425 [17] event generator with underlying-event Tune D6 [18] and CTEQ6L1 [19] parton distribution functions (PDFs). The cou-pling λLQ→lqwhich determines the LQ lifetime and width [20] is set to 0.01×4πα, where α is the fine-structure constant. This value is widely used in leptoquark searches and gives the leptoquark a full width of less than 1 MeV and a decay length of less than 1 mm. The signal process is normalised using next-to-leading-order (NLO) cross-sections for scalar leptoquark pair production [21]. The signal production cross-section for a leptoquark mass of 500 GeV is 46.2 fb.
Background processes considered in this analysis are the production of W +jets, Z/γ∗+jets, t ¯t, single top quarks, boson pairs, and multi-jets. The W - and Z-boson processes are simulated using the ALPGEN 2.13 generator [22] with the technique described in ref. [23] to match the hard process (calculated with a leading-order (LO) matrix element for up to five partons) to the parton shower of HERWIG 6.510 [24], and uses JIMMY 4.31 [25] to model the underlying event. Wherever avail-able, dedicated ALPGEN 2.13 samples with massive charm and bottom partons were used for the W+jets and Z/γ∗+jets processes. All samples listed above are generated using the CTEQ6L1 PDFs. Di-boson processes (WW , W Z, and ZZ) are modelled with HERWIG 6.510 using the MRST [26] LO PDFs. Samples of top-quark pair production and associated production of single top quark (W t) events are produced using the MC@NLO 4.01 [27–30] generator interfaced with HERWIG 6.510 for parton showering, and JIMMY 4.31 to model the underlying event. The CT10 [31] PDFs are used. Single-top s- and t-channel processes are modelled with AcerMC 3.8 [32] using the MRST LO PDFs. The top-quark mass is taken as 172.5 GeV. In all simulated samples TAUOLA [33] and PHOTOS [34] are used to model τ-lepton decays and additional photon radiation from charged leptons, respectively. The W +jets and Z+jets samples are normalised to the inclusive NNLO cross-sections in the proportions predicted by NLO calculations for exclusive n-parton production. The most precise available calculation (nearly NNLO) is used to normalise t ¯t production [35]. All other sources of background are normalised using the cross-sections calculated at NLO.
Signal and background events are processed through a detailed detector simulation [36] based on GEANT4 [37]. The data used in this paper are affected by multiple pp collisions occurring in the same or neighbouring bunch crossings (pile-up) and have an average of ten interactions per bunch crossing. The effects of pile-up are taken into account by overlaying simulated minimum-bias events onto the simulated hard-scattering events. The Monte Carlo (MC) samples are then re-weighted such that the average number of pile-up interactions matches that seen in the data.
4 Physics object identification
Collision events are required to have at least one reconstructed vertex with at least four associated tracks with pT > 0.4 GeV. In events where more than one vertex is found, the primary vertex is defined as the one with the highest ∑ p2T of the associated tracks. For the final state of interest described below, this choice of primary vertex is correct in 98.9% (98.4%) of the cases in the electron (muon) channel for the luminosity range considered here.
Electron candidates are reconstructed from clusters of cells in the electromagnetic calorimeter and from tracks in the inner detector. They are required to pass a set of electron identification cuts, based on information about the transverse shower shape, the longitudinal leakage into the hadronic calorimeter, transition radiation, and the requirement that a good-quality track with a hit in the innermost pixel layer points to the calorimeter cluster [38]. A tight working point corresponding to a selection efficiency of approximately 80% for true electrons in simulation is chosen. Electrons are required to have pT > 20 GeV and |η| < 2.47, excluding the transition region between the barrel and the end-cap calorimeters, i.e. 1.37 < |η| < 1.52. Isolation requirements are placed on the electron candidates by demanding that the calorimeter transverse energy in a cone of radius ∆R = 0.2 around the electron (not including the electron cluster) must be less than 20% of the electron pT, where ∆R =p(∆η)2+ (∆φ )2. In addition, track isolation is imposed by requiring that the pT sum of additional tracks (not including the electron track) in a cone of radius ∆R = 0.2 is less than 20% of the electron track pT.
Muon tracks are reconstructed independently in the inner detector and in the muon spectrom-eter. Tracks are required to have a minimum number of hits in each, and must be compatible in terms of geometrical and momentum matching. The information from both systems is then used in a combined fit to refine the measurement of the momentum of each muon. Muon candidates are required to have pT > 20 GeV and |η| < 2.5. The average muon reconstruction efficiency is approximately 90%, except for small regions in pseudorapidity where it drops to 80% [39]. Iso-lation requirements are imposed by demanding that the transverse energy (ET) deposited in the calorimeter in a cone of radius ∆R = 0.2 around the muon (not including the cells crossed by the muon) is less than 20% of the muon pT. Furthermore, track isolation is imposed by requiring that the pTsum of additional tracks (not including the muon track) in a cone of radius ∆R = 0.2 be less than 20% of the muon pT.
Jets are reconstructed using the anti-kt [40] algorithm with a radius parameter R = 0.4. The jet algorithm is run on calibrated topological clusters of calorimeter cells [41]. Additional pT- and η -dependent corrections are applied to jets to bring them to the final calibrated energy scale [42]. Selected jets must have pT> 25 GeV and |η| < 2.8.
The identification of jets originating from b-quarks is performed using a neural-network-based tagger [43] that uses the output weights of several likelihood-based algorithms as inputs. The track transverse and longitudinal impact parameters with respect to the primary vertex are examples of variables used by these algorithms. A working point corresponding to an identification efficiency of approximately 70% for true b-jets in simulation is chosen. For jets initiated by gluons or light quarks, the rejection factor (1/fraction that pass the b-tagging ID) is of order 100.
The reconstruction of hadronically decaying tau leptons is seeded by jets which are recon-structed within the acceptance of the inner detector. Only clusters in a cone with radius ∆R = 0.2
are used to define the visible tau energy and direction because the products of hadronic tau de-cays are more collimated than those from multi-jet processes. Additional corrections depending on the pT, η and number of tracks are applied to bring the reconstructed tau candidates to the correct energy scale [44]. The energy deposition in the calorimeter is required to be matched to either one or three tracks in the inner detector. Hadronically decaying taus are required to have visible pT> 20 GeV, |η| < 2.5 and unit charge, and are identified using a Boosted Decision Tree (BDT)1[45] which uses both calorimeter and tracking-based variables such as shower width and track multiplicity. A working point with an identification efficiency for true hadronic tau decays in simulation of ∼ 50% is chosen. The rejection factor for jets ranges from 50 to 100 depending on the number of tracks matching the jet candidate.
The missing transverse momentum is a two-dimensional vector defined as the negative vector sum of the transverse momenta of reconstructed electrons, muons, tau leptons and jets, and also of calorimeter energy deposits not associated with reconstructed objects.2 The magnitude of the missing transverse momentum vector is referred to as the missing transverse energy (ETmiss).
5 Event selection
Events are required to be identified by the trigger system as containing at least one electron or one muon. In order to control the data-taking bandwidth, the trigger system imposed a minimum transverse energy threshold on electrons of 20 GeV or 22 GeV (depending on the data-taking pe-riod), and a minimum pTthreshold on muons of 18 GeV. For the highest luminosities towards the end of the data-taking period, the muon trigger is required to be accompanied by a jet that passes the first-level trigger pT threshold of 10 GeV. All data events are required to be recorded during stable LHC running conditions and with all relevant sub-detectors functioning normally. Events are cleaned for instrumental effects, such as sporadic noise bursts [46].
Events are required to have exactly one reconstructed electron (muon) with pT> 25 (20) GeV. This suppresses background processes such as Z/γ∗→ `` and t ¯t which have a higher average lepton multiplicity. Exactly one identified hadronic tau decay candidate with pT> 30 GeV and opposite-sign charge to the lepton is required. The ETmiss is required to be larger than 20 GeV in order to further reject multi-jet and Z/γ∗→ `` processes. In addition, at least two reconstructed jets are required, with the leading jet having pT > 50 GeV and the sub-leading jet having pT> 25 GeV.
The signal-to-background ratio is improved by requiring that either the leading or sub-leading jet passes the b-tagging requirements. After requiring that events must have one of these two jets passing the b-tagging requirements, the dominant background process is t ¯t. Since both the signal and t ¯t processes contain two b-jets in the final state, no further improvement in sensitivity is obtained by requiring that a second jet in the event also pass the b-tagging requirements.
The visible mass (mτhad-vis−jet) of the tau candidate and the closest jet in η − φ space (minimum
∆R) is required to be larger than 90 GeV. Only jets with pT > 40 GeV are considered. This cut
1A BDT is a multivariate analysis technique where the selection is based on a majority vote on the result of several
decision trees, each of which is derived from the same training sample by supplying different event weights during the training.
2Energy deposits in the calorimeters are expressed as four-vectors (E, p), where the direction is determined from the
is chosen to reject semi-leptonic t ¯t events where the tau candidate is faked by jets from W → q ¯q decays.
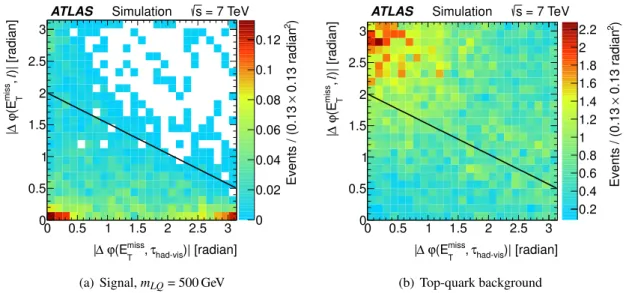
In events containing leptoquark decays, large ETmissarises from neutrinos accompanying the tau decays. Taus originating from leptoquarks typically have high momentum, thus the decay products are predominantly collinear and the ETmiss direction is correlated with the direction of the visible tau decay products. Two variables are defined in order to improve the separation of signal and background: the absolute difference in φ between the charged lepton and ETmiss (|∆φ (ETmiss, `)|), and the absolute difference in φ between the tau candidate and Emiss
T ( |∆φ (ETmiss, τhad-vis)|). The relationship between these two variables for simulated signal (mLQ = 500 GeV) and the dominant top background, after applying all the requirements described above is shown in figure1. Events must satisfy the following requirement:
|∆φ (Emiss T , `)| ≤ − 1.5 π |∆φ (E miss T , τhad-vis)| + 2 (radians), (5.1)
where ` = e, µ. This ETmiss angular requirement selects events below the solid line in figure1. A leptonically decaying tau is accompanied by two neutrinos, whereas a hadronically decaying tau is accompanied by only one. In events with two true taus (as in the signal process), the ETmissis there-fore typically aligned with the leptonic tau decay and these events are preferentially selected by the ETmissangular requirement. The signal efficiency is approximately 85%, independent of leptoquark mass. For t ¯t events containing a real hadronic tau (produced from the W decay), the additional neu-trinos from the tau decay cause the ETmiss to be preferentially aligned with the hadronic tau decay and these are rejected. In the subset of t ¯t events where the tau is faked by a jet from W -decay, events are evenly distributed across the |∆φ (ETmiss, `)|-|∆φ (ETmiss, τhad-vis)| plane and a large proportion of these are also rejected. The overall efficiency for inclusive t ¯t events is 31%.
6 Background estimation
Backgrounds considered in this analysis are the production of W +jets and Z/γ∗+jets (collectively referred to as V +jets), t ¯t, single top quarks, di-boson and multi-jets. Normalisation factors are applied to the MC predictions for V +jets and top backgrounds in background-enriched control regions, to predict as accurately as possible the background in the signal region, as described in more detail below. These control regions are constructed to be mutually exclusive of the signal region and the assumption is made that normalisation factors in the signal region are the same as in the background-enriched control regions. The contribution from multi-jets is estimated using fully data-driven techniques. The contribution from di-boson processes is taken directly from MC. The shapes of the distributions are taken from simulation in the signal region.
Different approaches are used to estimate the backgrounds in the electron and muon channels. Normalisation factors for the electron channel are calculated after applying the electron, tau, ETmiss, charge-product cuts, and jet multiplicity and pT requirements described in section 5above. This approach minimises bias with respect to the signal region, but leads to limited statistics (for MC and data) in the control regions. Normalisation factors for the muon channel are calculated after applying only the muon, tau and charge-product requirements described in section5.
)| [radian] had-vis τ , miss T (E ϕ ∆ | 0 0.5 1 1.5 2 2.5 3 )| [radian]l , miss T (E ϕ ∆| 0 0.5 1 1.5 2 2.5 3 2 ) 0.13 radian × Events / (0.13 0 0.02 0.04 0.06 0.08 0.1 0.12
ATLAS Simulation s = 7 TeV
(a) Signal, mLQ= 500 GeV
)| [radian] had-vis τ , miss T (E ϕ ∆ | 0 0.5 1 1.5 2 2.5 3 )| [radian]l , miss T (E ϕ ∆| 0 0.5 1 1.5 2 2.5 3 2 ) 0.13 radian × Events / (0.13 0.2 0.4 0.6 0.8 1 1.2 1.4 1.6 1.8 2 2.2
ATLAS Simulation s = 7 TeV
(b) Top-quark background
Figure 1. The absolute value of the angle ∆φ between the reconstructed charged light lepton and Emiss
T as
a function of |∆φ | between τhad-visand ETmiss for simulated(a)signal (mLQ= 500 GeV) and(b) top-quark
background, after applying all selection cuts (see text) and normalising to the integrated luminosity of the data. The function corresponding to the solid line is defined in eq.5.1.
6.1 Electron channel
The multi-jets background is estimated by defining a region in data with a tau candidate that fails the tau BDT identification used in the nominal selection but passes a looser identification working point, and has the same-sign charge as the electron. In addition, the events are required not to contain any taus that pass the nominal selection criteria. Contributions from W , Z/γ∗+jets, top-quark, and di-boson background processes estimated from MC simulations are subtracted to get the shape of the multi-jets distribution. The normalisation is determined by performing a two-component maximum likelihood fit to kinematic distributions of the sum of multi-jets and all other sources of background to data, with the multi-jets fraction being the fit parameter. The variable used for fitting is chosen to provide good discrimination between multi-jets and other sources of background. The method is used to calculate the multi-jets contribution in the signal region, where the transverse mass between the charged light lepton and the ETmiss, defined to be:
mT= q
2p`TETmiss(1 − cos(∆φ )), (6.1)
is used as the fit variable. The multi-jets contribution is found to be 12+8−16% of the total data yield in the signal region. The same method is also used in background control regions, fitting to the ETmiss distribution in the W and Z/γ∗→ ττ control regions, and the electron ET in the top control region. The validity of the method used to estimate the multi-jets background contribution is cross-checked by using events with same-sign charge electron–tau pairs as the control region and found to be compatible within statistical errors. Dependence on the choice of variable used is evaluated by fitting to other kinematic variables, and also found to be within statistical errors of the nominal value.
Z/γ∗→ ee+jets Require one extra electron Z/γ∗→ ττ+jets
b-jet veto 40 < meτhad-vis < 80 GeV
mT< 60 GeV
W+jets b-jet veto
Fail ETmissangular cut 60 < mT< 120 GeV
Top-quark
b-jet requirement mτhad-visjet > 90 GeV Fail ETmissangular cut
ST< 350 GeV
Table 1. Control region definitions for the electron channel. The electron, tau, charge-product, Emiss T , and
jet multiplicity and pTrequirements are applied as described in section5.
Separate control regions are defined for the Z/γ∗→ ee, Z/γ∗→ ττ, W , and t ¯t and single top-quark processes. They are defined by applying the electron, tau, charge-product, ETmiss, and jet multiplicity and pTrequirements (as described in section5, collectively referred to as the ‘baseline’ requirements), in addition to the cuts shown in table1.
The control region for Z/γ∗ → ee events is constructed by requiring an additional electron with pT> 20 GeV and opposite-sign charge to the first one. The second electron is required to pass the same identification requirements as the first one.
The Z/γ∗→ ττ control region is defined by additionally requiring that the visible mass of the electron–tau pair is in the range 40 < meτhad-vis < 80 GeV and that the transverse mass between the
electron and the ETmissis less than 60 GeV. A b-jet veto is also applied, using a looser working point (with a selection efficiency of 75%) compared to the working point used for signal selection. In this way contamination from top backgrounds is reduced.
The W +jets control region is constructed by applying in addition a b-jet veto (as described above), demanding that 60 < mT< 120 GeV, and requiring that the event fail the Emiss
T angular requirements cut (eq.5.1).
The control region for top backgrounds is defined by additionally requiring that events pass the b-tagging requirements, have mτhad-visjet> 90 GeV, fail the E
miss
T angular requirements and have ST< 350 GeV, where STis defined as the scalar sum of the pTof the charged light lepton, the tau, the two highest-pTjets and the ETmissin the event,
ST= pe/µT + pτThad-vis+ pjet1T + pjet2T + ETmiss. (6.2) Normalisation factors for V +jets and top backgrounds in the electron channel are calculated according to:
NFBG=
NData− NMC OtherBG
NBGMC , (6.3)
where NDatais the number of data events in the control region, NOther BGMC is the expected number of events from other background processes, and NBGMCis the contribution in the control region from
the background process of interest.
To account for contamination from other background processes in the control regions, nor-malisation factors are found for each region in turn. At each stage the multi-jets contribution is re-estimated and all previously found normalisation factors are applied when estimating the contri-bution from other background processes.
The final background normalisation factors obtained are presented in table 3 and discussed together with the muon channel in section6.3.
6.2 Muon channel
The multi-jets contribution to the control and signal regions are estimated in the muon channel from data using the ABCD method. Events are sorted into four regions using two observables assumed to be independent – the muon isolation and the sign of the charge product of the muon– tau pair. The regions are therefore defined as: isolated muon and opposite-sign muon–tau pair (A), isolated muon and same-sign muon–tau pair (B), as well as two regions with a non-isolated muon and opposite-sign or same-sign charge muon–tau pair (C and D respectively). Non-isolated muons are defined as those which fail at least one of the isolation requirements described in section 5. Contributions from other physics processes in regions B, C, and D are subtracted using the MC simulation. The shape of kinematic distributions for the multi-jets background is taken from region B, while the expected number of events in the signal region (A) is determined by taking the product of the number of events in region B with the ratio of the number of events in regions C and D (i.e. NA= NB×NC
ND). The multi-jets contribution is estimated to be 15±4% of the total data yield in the
signal region. The validity of the method is checked by varying both isolation cuts up and down from the nominal value of 0.2 by 0.05. Deviations in the ratio NC
NA are included as an additional
systematic uncertainty.
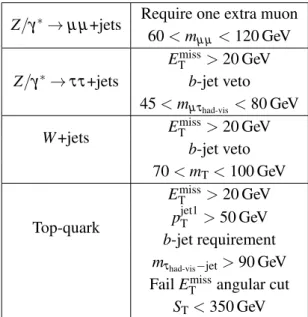
Control regions for V +jets and top-quark background processes are defined by applying the muon and tau requirements (including the charge-product requirement) as described in section5. Additional selection criteria used for each control region are listed in table2. Normalisation fac-tors are calculated for each process by performing a maximum likelihood fit. The variable used for fitting is chosen in each case to provide good discrimination between the background process of interest, and other contributing physics processes in that control region. The contribution from multi-jets in each control region is estimated using the method described above, and this and con-tributions from other background processes are taken into account when performing the fits.
The control region for Z/γ∗ → µ µ events is defined by requiring two oppositely charged muons and one hadronic tau decay. The second muon is required to pass the same requirements as the first. The normalisation factor for Z/γ∗→ µ µ events in the signal region is then determined by fitting to the di-muon invariant mass distribution in the range 60 < mµ µ < 120 GeV.
The normalisation of Z/γ∗ → ττ events is obtained by selecting events with one muon, one hadronic tau decay and ETmiss > 20 GeV. Additionally, events are required to fail the b-jet requirement. The fit is performed using the visible mass of the muon–tau pair in the range 45 < mµ τhad-vis< 80 GeV.
The control region for W +jets events is defined by selecting events with one muon, one hadronic tau decay and ETmiss > 20 GeV, and which fail the b-jet requirement. The
normalisa-Z/γ∗→ µ µ+jets Require one extra muon 60 < mµ µ < 120 GeV Z/γ∗→ ττ+jets ETmiss> 20 GeV b-jet veto 45 < mµ τhad-vis < 80 GeV W+jets E miss T > 20 GeV b-jet veto 70 < mT< 100 GeV Top-quark ETmiss> 20 GeV pjet1T > 50 GeV b-jet requirement mτhad-vis−jet> 90 GeV
Fail ETmissangular cut ST< 350 GeV
Table 2. Control region definitions for the muon channel. The muon, tau and charge-product requirements are also applied as described in section5.
Background Electron channel Muon channel Z/γ∗→ ``+jets 0.54 ± 0.09 0.52 ± 0.02 Z/γ∗→ ττ+jets 0.99 ± 0.08 1.00 ± 0.02
W+jets 0.63 ± 0.07 0.50 ± 0.01
t ¯tand single-top 0.92 ± 0.08 0.93 ± 0.09
Table 3. Summary of background normalisation factors obtained using the control regions specified in tables
1and2. The errors include both the statistical and systematic (discussed in section7.3) uncertainties.
tion is determined by fitting to the transverse mass of the charged light lepton and the ETmissin the range 70 < mT< 100 GeV.
The control region for t ¯t and single-top processes is defined by applying all selection criteria, with the exception of the ETmissangular requirement which is reversed. In addition, the ST of the event is required to be less than 350 GeV. The normalisation factor is obtained by fitting to the STdistribution up to 350 GeV.
6.3 Background summary
The background normalisation factors in the signal region determined from data for both channels are presented in table3.
Uncertainties for normalisation factors are larger in the electron channel than the muon channel due to the tighter requirements placed on the control region definitions, namely the additional requirements on ETmissand jets which are not applied for the muon channel (unless explicitly stated). As a cross-check, the electron channel method (detailed in section 6.1) is applied to the muon channel and the signal region normalisation factors determined in this way are found to be
NFZ/γ→µ µ = 0.59 ± 0.09, NFZ/γ→ττ = 1.03 ± 0.08, NFW = 0.50 ± 0.08 and NFtop= 0.93 ± 0.09. These figures agree within uncertainties with the factors determined using the method described in section6.2and shown in table3.
The largest background contribution comes from t ¯t events, with approximately 55% of these coming from events containing a real hadronic tau decay (from the W decay) after all selection cuts are applied. Approximately 40% come from events where the W boson decays hadronically, and the tau candidate is faked by one of the jets. In the remaining ∼ 5% of events, the reconstructed hadronic tau decay is faked in equal proportions by electrons or b-jets. Normalisation factors for background processes in which the hadronic tau decay is faked by a jet are observed to be significantly smaller than unity. This is a known effect, caused by jets being narrower in simulation than in data and therefore being more likely to fake a hadronic tau decay [47].
In both methods used for background estimation, the control regions for V +jets background processes either make no requirements on b-tagging, or veto events containing one or more b-jets. Simulation tests have validated the assumption that the normalisation factors obtained in regions that require b-jets are the same as those in regions where b-jets are not explicitly required, or are vetoed.
7 Systematic uncertainties
In simulated samples all sources of uncertainty are varied individually within their errors and the impact on the results of the analysis is determined. Background normalisation factors and multi-jets contributions are recalculated for each source of systematic uncertainty. In this way the nominal simulation (comprising the current best estimates for physics object reconstruction corrections) and systematic variations are treated coherently, and the uncertainties are propagated through the analysis. The ST distribution is used to test for the existence of leptoquarks, since this variable provides the best discrimination between signal and background (discussed further in section8). The shape of the STdistribution remains unchanged within the total shape uncertainty (see further discussion in section8) when applying all the uncertainties detailed below and systematic variations are therefore treated as nuisance parameters affecting the overall scale. The relative changes in acceptance for signal and background are quoted for each systematic variation.
7.1 Object-level uncertainties
There are several sources of systematic uncertainty associated with the reconstruction, identifi-cation, and energy scale of physics objects, which can potentially affect the estimated shapes of kinematic distributions and the normalisation of various processes.
Uncertainties associated with the efficiency of single-lepton triggers are typically less than 1% [48,49] and a ±0.5% (±3.3%) variation in the signal acceptance is observed when varying the electron (muon) trigger efficiency by ±1σ . The effect on background processes is negligible.
Varying the electron energy scale by ± 1σ results in a ±0.8% change in background accep-tance compared to the nominal selection and has a negligible impact on the signal yields. The electron reconstruction and identification efficiency uncertainties are combined in quadrature and yield an overall change of less than 1.5% for both signal and background.
Varying the muon momentum scale by 1σ results in a 0.2% change in signal yields compared to the nominal selection. The impact of muon resolution uncertainties on signal and background acceptance is found to be negligible. A ±1σ variation of muon reconstruction efficiency results in a ±0.3% change in signal acceptance.
The uncertainty on the tau energy scale is typically around 3%, depending on the pT and η of the hadronically decaying tau candidate [50]. Varying the energy scale by ±1σ changes the acceptance for background and low-mass signal (mLQ= 200 GeV) by approximately 2%, decreasing to 1.2% for mLQ = 500 GeV. The uncertainty on the tau identification efficiency is 4% for taus with pT < 100 GeV. This increases linearly with pT up to a maximum of 8% for three-prong taus with pT > 350 GeV. Varying the tau identification efficiency by this uncertainty results in an overall acceptance change for signal of approximately 6% (for a leptoquark of mass 500 GeV). The variation of background yields is found to be approximately 1% – significantly smaller than the change in the signal yield, because the effect is largely absorbed in the normalisation factor defined in the control region.
The jet energy resolution uncertainty is approximately 10% and affects the event yields by approximately 2% [42]. The jet energy scale uncertainty depends on pTand η, and varies between 2% and 5%. It is modelled by 14 separate nuisance parameters, each of which is varied by ±1σ independently from the others. The use of control regions does not significantly reduce the varia-tions of the different background yields, and changes in acceptance of signal and background of up to ±2% are observed.
The uncertainty on the b-jet identification efficiency for the algorithm and operating point used in this analysis ranges from 5% to 18% depending on jet kinematics. The b-tagging efficiency and probability that a light jet is identified as a b-jet are anti-correlated and thus varied accordingly. A ±1σ variation results in a ±9% (±15%) change in signal acceptance for leptoquarks with a mass of 200 (500) GeV. The use of control regions reduces the background yield variation to ±3% in both channels.
All energy scale and resolution corrections for electron, muon, tau and jet candidates are prop-agated consistently to the ETmisscalculation. Additional uncertainties related to the energy scale and pile-up dependence of calorimeter clusters not associated with any high-pTobjects (electrons, taus, jets) are also considered in the ETmiss calculation. These sources are varied independently within their uncertainties and the impact on signal and background yields is found to be negligible.
The uncertainty on the integrated luminosity for data taken during 2011 is ±3.7% as deter-mined in ref. [51].
7.2 Theoretical uncertainties
QCD renormalisation and factorisation scales are varied by a factor of two to estimate the impact on the signal production cross-section. The variation is found to be ±12%. A re-weighting technique is used to assess the sensitivity of the signal acceptance to the choice of parton distribution functions and the resulting uncertainty is estimated to be ±12%. Varying the multi-parton interactions within experimental bounds has a negligible effect on the signal process.
The effect of the choice of event generator for the top-quark background is estimated by us-ing PowHeg 1.0 [52, 53] (instead of MC@NLO 4.01) to model the hard process. The parton shower and hadronisation models, and the underlying event model (respectively HERWIG 6.510
and JIMMY 4.31 in the nominal sample) are replaced with those from PYTHIA 6.425. In addition, the CTEQ6L1 PDF set is used instead of CT10 which is used in the nominal t ¯t sample. The total background yield is found to differ by 1.5% with respect to the nominal samples.
The uncertainty on the signal and the top-quark background due to initial-state radiation (ISR) and final-state radiation (FSR) is evaluated using the AcerMC generator interfaced to the PYTHIA 6.425 shower model with the parameters controlling ISR and FSR varied in a range consistent with experimental data [54]. The event yields are found to agree with nominal values within statistical uncertainties.
MC@NLO events with top-quark masses of 170 GeV and 175 GeV are used to assess the top-quark mass dependence, which is added in quadrature to the uncertainty related to the choice of event generator and PDF set. The resulting uncertainty (2.8%) is treated as a nuisance parameter affecting the background yield and is assumed to be fully correlated between the electron and muon channels.
Other background processes taken from simulation (W , Z/γ∗, di-boson) account for less than 20% of the total background. The W and Z/γ∗samples are simulated with the matching parameter (described in ref. [23]) set to 20 GeV. Event yields are found to agree with the nominal values within statistical uncertainties when this parameter is changed to 30 GeV.
The W and Z control regions are defined with either the application of a b-jet veto, or with no b-tagging requirements. The uncertainties on the production cross-sections of W or Z bosons in association with one or two b-jets are estimated using MCFM [55,56]. The QCD renormalisation and factorisation scales are varied independently by a factor of two, and different PDF sets are considered. The total uncertainty is found to be 30% and the uncertainties on the normalisation factors for W and Z background processes are increased by this amount (i.e. to 2%).
7.3 Background uncertainties
For each channel, the systematic uncertainties on the normalisation factors in table3are evaluated by calculating the normalisation factor for a given background when normalisation factors for all other sources of background are varied up or down by their statistical error. The systematic uncertainty on the multi-jets background is evaluated by varying the normalisation factors of other backgrounds by ±1σ . The methods used to estimate the contributions from multi-jets processes are validated by modifying the control regions used, and in the case of the electron channel the variable used for fitting (see sections6.1and6.2). Deviations from the nominal value are included as additional sources of systematic uncertainty.
Conservatively, all background normalisation factors are assumed to be fully correlated and the impact on the total background yield is+16−19% for the electron channel and ±9% for the muon channel. The background estimation method used in the muon channel allows a more accurate determination of the normalisation factors compared to the event-counting method employed in the electron channel, and the normalisation factor uncertainty for the muon channel is correspondingly smaller than in the electron channel. For both channels, the limited number of data events in the top-quark control region is the main source of uncertainty on the top-quark normalisation factor, which in turn has the largest impact on the total yield uncertainty. Due to the tighter requirements on control regions for the electron channel background estimation, this method also suffers from a
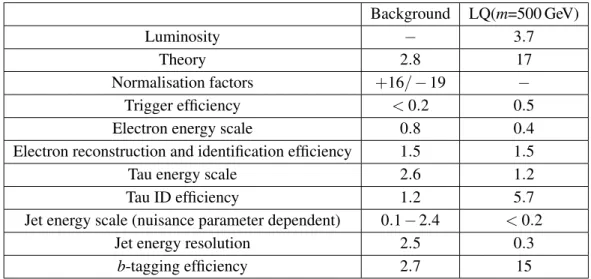
Background LQ(m=500 GeV)
Luminosity − 3.7
Theory 2.8 17
Normalisation factors +16/ − 19 −
Trigger efficiency < 0.2 0.5
Electron energy scale 0.8 0.4
Electron reconstruction and identification efficiency 1.5 1.5
Tau energy scale 2.6 1.2
Tau ID efficiency 1.2 5.7
Jet energy scale (nuisance parameter dependent) 0.1 − 2.4 < 0.2
Jet energy resolution 2.5 0.3
b-tagging efficiency 2.7 15
Table 4. The sources of systematic uncertainty in the electron channel and the relative change (in %) in the background and signal yields. The theory term includes uncertainties related to initial and final state radiation, PDFs, and multi-parton interactions.
limited number of events in data and simulation when estimating normalisation factors for V +jets background processes.
7.4 Summary of systematic uncertainties
The shape of the ST distribution remains unchanged within statistical uncertainties when apply-ing all the uncertainties mentioned above. The uncertainties for the electron and muon channels are summarised in tables4 and5 respectively. Uncertainties related to the background normali-sation factors have the largest impact on the total background yield, while for the signal yield the largest sources of systematic uncertainty are due to theoretical uncertainties (comprising uncertain-ties related to PDFs, multi-parton interactions, and initial- and final-state radiation) and from b-jet identification.
8 Results
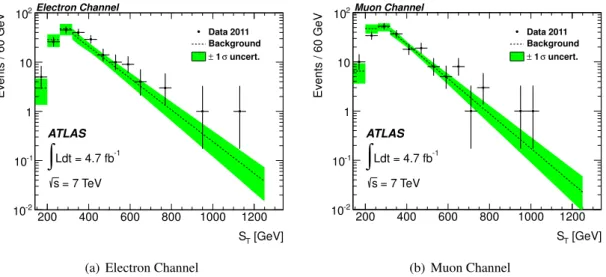
The observed yields in data, as well as expected yields for the background processes and the signal for several leptoquark masses, after all selection cuts are applied, are shown in table6. The ST dis-tribution is used to test for the existence of leptoquarks. Disdis-tributions for both channels are shown in figure2.
At very high ST, the statistical uncertainties on the various background processes become very poor due to the limited number of MC and (in the case of the multi-jets) data events in the signal region. The sum of the background processes is fitted in the region 350 GeV < ST< 2000 GeV to an exponential function using a maximum likelihood fit. In this way the distribution is smoothed and a background expectation is provided throughout this STregion. The fit parameters are varied within their uncertainties to obtain a shape uncertainty. The shape of the STdistribution is checked for all systematic variations and the variation is found to be significantly smaller than the fit uncertainty in almost all cases. The only exception is for the variation in choice of generator used to model the
Background LQ(m=500 GeV)
Luminosity − 3.7
Theory 2.8 17
Normalisation factors 9 −
Trigger efficiency < 0.2 3.3
Muon momentum scale 0.1 0.2
Muon reconstruction efficiency < 0.1 0.3
Tau energy scale 0.6 1.2
Tau ID efficiency 0.8 5.7
Jet energy scale (nuisance parameter dependent) 0.1 − 2.0 < 0.2
Jet energy resolution 1.5 0.5
b-tagging efficiency 2.7 15
Table 5. The sources of systematic uncertainty in the muon channel and the relative change (in %) in the background and signal yields. The theory term includes uncertainties related to initial- and final-state radiation, PDFs, and multi-parton interactions.
[GeV] T S 200 400 600 800 1000 1200 Bkg / N Data N 0 0.5 1 1.5 2 2.5 3 Events / 60 GeV -2 10 -1 10 1 10 2 10 3 10 Data 2011 Top τ τ → * γ Z/ Multi-jets Others LQ(m=500 GeV) ATLAS -1 Ldt = 4.7 fb
∫
= 7 TeV s Electron Channel(a) Electron Channel
[GeV] T S 200 400 600 800 1000 1200 Bkg / N Data N 0 0.5 1 1.5 2 2.5 3 Events / 60 GeV -2 10 -1 10 1 10 2 10 3 10 Data 2011 Top τ τ → * γ Z/ Multi-jets Others LQ(m=500 GeV) ATLAS Muon Channel -1 Ldt = 4.7 fb
∫
= 7 TeV s (b) Muon ChannelFigure 2. Data and MC comparisons of the STvariable after applying all cuts in the (a)electron and(b)
muon channels. The ratio NData/NBackground is also shown, where the red line at unity and hashed band
represent the Standard Model expectation and associated statistical and systematic uncertainties. No events with ST> 1.2 TeV were observed in data.
t ¯tbackground process, where the central value lies outside the nominal range (although covers the nominal value within its own statistical uncertainty). Conservatively, the difference between the nominal shape and the alternative shape is taken as a systematic uncertainty and added to the shape uncertainty determined from the nominal fit. The total shape uncertainty is treated as an additional nuisance parameter. Comparisons of the fitted distributions to data are shown in figure3. Below ST= 350 GeV the background shape is taken from the histogram.
hypothe-Electron channel Muon channel Z/γ∗→ ``+jets 2.1 ± 0.9 1.1 ± 0.5 Z/γ∗→ ττ+jets 21.4 ± 2.2 26.6 ± 2.2 W+jets 5.2 ± 1.2 7.1 ± 1.5 t ¯tand single-top 119 ± 11 130 ± 11 Di-boson 1.1 ± 0.2 1.3 ± 0.2 Multi-jets 20+13−16 29 ± 8 Total background 169+27−32 195 ± 18 Data 187 198 mLQ= 200 GeV 711 ± 22 839 ± 25 mLQ= 300 GeV 131 ± 3 136 ± 3 mLQ= 400 GeV 28.7 ± 0.6 28.6 ± 0.6 mLQ= 500 GeV 7.53 ± 0.15 6.84 ± 0.15 mLQ= 600 GeV 2.1 ± 0.04 1.87 ± 0.04
Table 6. Yields for data, background and several leptoquark masses in both channels after all cuts are applied. The errors include statistical uncertainties and systematic uncertainties on the background normali-sation. hST_back_electron_Clone Entries 3 Mean 263.9 RMS 34 Underflow 0 Overflow 0 [GeV] T S 200 400 600 800 1000 1200 Events / 60 GeV -2 10 -1 10 1 10 2 10 hST_back_electron_Clone Entries 3 Mean 263.9 RMS 34 Underflow 0 Overflow 0 Entries 21 Mean 363.1 RMS 138.5 Data 2011 Background uncert. σ 1 ± ATLAS -1 Ldt = 4.7 fb
∫
= 7 TeV s Electron Channel(a) Electron Channel
hST_back_muon_Clone Entries 3 Mean 255.5 RMS 36.38 Underflow 0 Overflow 0 [GeV] T S 200 400 600 800 1000 1200 Events / 60 GeV -2 10 -1 10 1 10 2 10 hST_back_muon_Clone Entries 3 Mean 255.5 RMS 36.38 Underflow 0 Overflow 0 fIsoSS_hSTForLimit_data Entries 50 Mean 296.2 RMS 97.69 Underflow 0 Overflow 0 Data 2011 Background uncert. σ 1 ± ATLAS -1 Ldt = 4.7 fb
∫
= 7 TeV s Muon Channel (b) Muon ChannelFigure 3. Comparison of the fitted STbackground shape to data in the(a)electron and(b)muon channels.
The ±1σ band represents the uncertainty on the shape of the STdistribution, obtained by varying the fit
parameters within their uncertainties and comparing with the shape of the STdistribution obtained for each
systematic variation. No events with ST> 1.2 TeV were observed in data.
ses. The signal component is calculated separately for each leptoquark mass, thus taking the mass dependence of the STdistribution into account. For each mass hypothesis, a single ‘signal strength’ parameter (µ) multiplies the expected signal in each bin, where µ = 0 corresponds to the absence of a signal and µ = 1 corresponds to the presence of a signal with nominal strength. The model describes the expected number of signal (si) and background (bi) events in each bin using a Pois-son distribution. All systematic uncertainties described in section7are assumed to be distributed
[GeV] LQ m 200 300 400 500 600 700 Cross-section [pb] -3 10 -2 10 -1 10 1 10 Cross-section(pp → LQLQ) σ 1 ± Cross-section Expected Limit σ 1 ± Expected σ 2 ± Expected Observed Limit ATLAS -1 Ldt = 4.7 fb
∫
= 7 TeV s(a) Electron Channel
[GeV] LQ m 200 300 400 500 600 700 Cross-section [pb] -3 10 -2 10 -1 10 1 10 Cross-section(pp → LQLQ) σ 1 ± Cross-section Expected Limit σ 1 ± Expected σ 2 ± Expected Observed Limit ATLAS -1 Ldt = 4.7 fb
∫
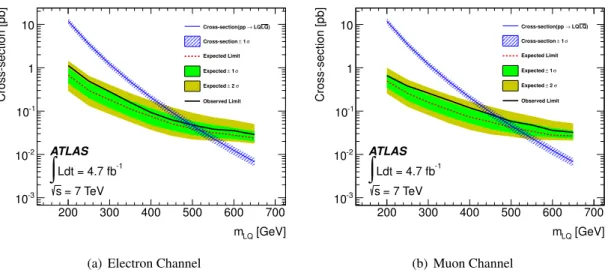
= 7 TeV s (b) Muon ChannelFigure 4. The expected (dashed) and observed (solid) 95% credibility upper limits on the cross-section as a function of leptoquark mass, in the(a)electron and(b)muon channels. The 1(2) σ error bands on the expected limit represent all sources of systematic and statistical uncertainty. The expected NLO production cross-section for third generation scalar leptoquarks and its corresponding theoretical uncertainty (hashed band) are also included.
according to a Gaussian function and implemented as multiplicative constraint terms. The correla-tion of the systematic uncertainties across channels is taken into account. Statistical uncertainties in signal and background histogram bins are also treated as nuisance parameters and assumed to be distributed according to a Poisson function. The statistical analysis of the data employs a binned likelihood functionL (µ,θ). The likelihood in each channel is a product over bins in the ST dis-tributions defined as
L (µ,θ) =
∏
i=bin
Poisson(Ni|µsi+ bi), (8.1)
where siand biare the expected number of signal and background events in bin i respectively, and Ni is the observed number of events. Both si and bi depend on nuisance parameters θ. Pseudo-experiments are generated according to background-only and signal+background models to obtain distributions of the test statistic, log(L (µ,θ)/L (0,θ)). The CLs method [57] is used to calculate the p-values3. The signal strength parameter is varied iteratively to find the 95% confidence level.
The resulting cross-section limits as a function of leptoquark mass are calculated. It is assumed that BR(LQ → τb) = 1.0. The 95% CL upper bounds on the NLO cross-section for scalar leptoquark pair production as a function of mass are shown for individual channels in figures4(a)and 4(b). Error bands for the expected limits include all sources of uncertainty. Third generation scalar leptoquarks are observed (expected) to be excluded at 95% confidence level for masses below 498 (523) GeV and 473 (514) GeV in the electron and muon channels respectively by comparing the limits with theoretical predictions of cross-section versus mLQ. The limit is taken using the nominal theoretical calculation for the leptoquark production cross-section at NLO. The uncertainty
3The p-value is the probability of obtaining a test statistic at least as extreme as the one that was actually observed,
[GeV] LQ m 200 300 400 500 600 700 Cross-section [pb] -3 10 -2 10 -1 10 1 10 Cross-section(pp → LQLQ) σ 1 ± Cross-section Expected Limit σ 1 ± Expected σ 2 ± Expected Observed Limit ATLAS -1 Ldt = 4.7 fb
∫
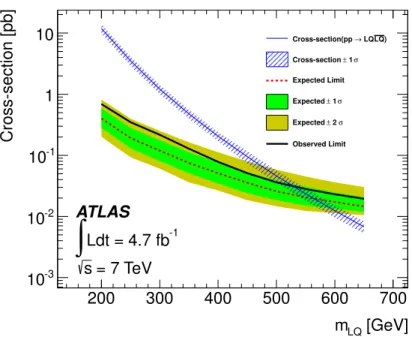
= 7 TeV sFigure 5. The expected (dashed) and observed (solid) 95% credibility upper limits on the cross-section as a function of leptoquark mass, for the combined result. The 1(2) σ error bands on the expected limit represent all sources of systematic and statistical uncertainty. The expected NLO production cross-section for third generation scalar leptoquarks and its corresponding theoretical uncertainty (hashed band) are also included.
on the cross-section is also shown. The result when both channels are combined is shown in figure5. The likelihood for the combined model is defined as the product of likelihood terms for each channel. The data are found to be consistent with the background-only hypothesis and third generation scalar leptoquark production is excluded at 95% confidence level for leptoquark masses up to 534 GeV (the expected limit is 569 GeV).
9 Conclusions
A search for pair production of third generation scalar leptoquarks has been performed with the ATLAS detector at the LHC, using a data sample corresponding to an integrated luminosity of 4.7 fb−1. No significant excess over the SM background expectation is observed in the data. The assumption is made that BR(LQ → τb) = 1.0 and third generation scalar leptoquarks with masses up to mLQ< 534 GeV are excluded at 95% CL. The cross-section for leptoquark pair-production increases with centre-of-mass collision energy. At√s= 8 TeV the production rate for leptoquarks with mLQ = 700 GeV is enhanced by a factor of two, providing scope for setting stronger limits using data from the 2012 LHC run. Meanwhile, this result is the most stringent limit arising from direct searches for third generation scalar leptoquarks to-date.
10 Acknowledgements
We thank CERN for the very successful operation of the LHC, as well as the support staff from our institutions without whom ATLAS could not be operated efficiently.
We acknowledge the support of ANPCyT, Argentina; YerPhI, Armenia; ARC, Australia; BMWF and FWF, Austria; ANAS, Azerbaijan; SSTC, Belarus; CNPq and FAPESP, Brazil; NSERC, NRC and CFI, Canada; CERN; CONICYT, Chile; CAS, MOST and NSFC, China; COL-CIENCIAS, Colombia; MSMT CR, MPO CR and VSC CR, Czech Republic; DNRF, DNSRC and Lundbeck Foundation, Denmark; EPLANET, ERC and NSRF, European Union; IN2P3-CNRS, CEA-DSM/IRFU, France; GNSF, Georgia; BMBF, DFG, HGF, MPG and AvH Foundation, Ger-many; GSRT and NSRF, Greece; ISF, MINERVA, GIF, DIP and Benoziyo Center, Israel; INFN, Italy; MEXT and JSPS, Japan; CNRST, Morocco; FOM and NWO, Netherlands; BRF and RCN, Norway; MNiSW, Poland; GRICES and FCT, Portugal; MERYS (MECTS), Romania; MES of Russia and ROSATOM, Russian Federation; JINR; MSTD, Serbia; MSSR, Slovakia; ARRS and MIZ ˇS, Slovenia; DST/NRF, South Africa; MICINN, Spain; SRC and Wallenberg Foundation, Swe-den; SER, SNSF and Cantons of Bern and Geneva, Switzerland; NSC, Taiwan; TAEK, Turkey; STFC, the Royal Society and Leverhulme Trust, United Kingdom; DOE and NSF, United States of America.
The crucial computing support from all WLCG partners is acknowledged gratefully, in par-ticular from CERN and the ATLAS Tier-1 facilities at TRIUMF (Canada), NDGF (Denmark, Norway, Sweden), CC-IN2P3 (France), KIT/GridKA (Germany), INFN-CNAF (Italy), NL-T1 (Netherlands), PIC (Spain), ASGC (Taiwan), RAL (UK) and BNL (USA) and in the Tier-2 fa-cilities worldwide.
References
[1] S. K. Dimopoulos and L. Susskind. Mass without scalars. Nucl. Phys. B., 155(1):237–252, 1979. [2] S. Dimopoulos. Technicoloured signatures. Nucl. Phys. B., 168:69–92, 1980.
[3] E. J. Eichten and K. Lane. Dynamical breaking of weak interaction symmetries. Phys. Lett. B., 90(1,2):125–130, 1980.
[4] V. D. Angelopoulos, J. R. Ellis, H. Kowalski, et al. Search for new quarks suggested by the superstring. Nucl. Phys. B., 292:59–92, 1986.
[5] W. Buchm¨uller and D. Wyler. Constraints on SU(5)-type leptoquarks. Phys. Lett. B., 177:377–382, 1986.
[6] J. C. Pati and A. Salam. Lepton number as the fourth ‘colour’. Phys. Rev. D., 10:275–289, 1974. Erratum ibid.D11.703, 1975.
[7] H. Georgi and S.L. Glashow. Unity of All Elementary Particle Forces. Phys. Rev. Lett., 32:438–441, 1974.
[8] S. Kovalenko and I. Schmidt. Proton stability in leptoquark models. Phys. Lett. B., 562:104–108, 2003. arXiv:0210187 [hep-ph].
[9] W. Buchm¨uller, R. R¨uckl, and D. Wyler. Leptoquarks in lepton-quark collisions. Phys. Lett. B., 191:442–448, 1986. Erratum ibid. B448:320, 1999.
[10] CMS Collaboration. Search for pair production of third-generation leptoquarks and top squarks in pp collisions at√s= 7 TeV. Phys. Rev. Lett., 110(081801), 2013. arXiv:1210.5629 [hep-ex].
[11] D0 Collaboration. Search for third generation scalar leptoquarks decaying into τb. Phys. Rev. Lett., 101:241802, 2008. arXiv:0806.3527 [hep-ex].
[12] CDF Collaboration. Search for Pair Production of Scalar Top Quarks Decaying to a τ Lepton and a b Quark in p ¯pCollisions at√s= 1.96 TeV. Phys. Rev. Lett., 101:071802, 2008. arXiv:0802.3887 [hep-ex].
[13] CMS Collaboration. Search for pair production of first- and second-generation scalar leptoquarks in pp collisions at√s= 7 TeV. Phys. Rev. D., 86:052013, 2012. arXiv:1207.5406 [hep-ex].
[14] ATLAS Collaboration. Search for first generation scalar leptoquarks in pp collisions at√s=7 TeV with the ATLAS detector. Phys. Lett. B., 709:158–176, 2012. Erratum ibid. 711:442-455, 2012. arXiv:1112.4828 [hep-ex].
[15] ATLAS Collaboration. Search for second generation scalar leptoquarks in pp collisions at√s= 7 TeV with the ATLAS detector. Eur. Phys. J. C., 72:2151, 2012. arXiv:1203.3172 [hep-ex]. [16] ATLAS Collaboration. The ATLAS Experiment at the CERN Large Hadron Collider. J. Instrum.,
3(S08003), 2008.
[17] T. Sj¨ostrand, S. Mrenna, and P. Z. Skands. PYTHIA 6.4 Physics and Manual. J. High Energy Phys., 05:026, 2006. arXiv:0603175 [hep-ph].
[18] R. Field. Physics at the Tevatron. Acta Physica Polonica B., 39:2611–2671, 2008.
[19] J. Pumplin, D.R. Stump, J. Huston, et al. New generation of parton distributions with uncertainties from global QCD analysis. J. High Energy Phys., 0207:012, 2002. arXiv:0201195 [hep-ph]. [20] A Belyaev, C Leroy, R Mehdiyev, et al. Leptoquark Single and Pair production at LHC with
CalcHEP/CompHEP in the complete model. J. High Energy Phys., 09(005), 2005. arXiv:0502067 [hep-ph].
[21] M. Kr¨amer, T. Plehn, M. Spira, et al. Pair production of scalar leptoquarks at the CERN LHC. Phys. Rev. D., 71:057503, 2005. arXiv:0411038 [hep-ph].
[22] M. L. Mangano, M. Moretti, F. Piccinini, et al. ALPGEN, a generator for hard multiparton processes in hadronic collisions. J. High Energy Phys., 07:001, 2003. arXiv:0206293 [hep-ph].
[23] J. Alwall, S. Hoeche, F. Krauss, et al. Comparative study of various algorithms for the merging of parton showers and matrix elements in hadronic collisions. Eur. Phys. J., C53:473–500, 2008. arXiv:0706.2569 [hep-ph].
[24] G. Corcella, I. G. Knowles, G. Marchesini, et al. HERWIG 6: An event generator for hadron emission reactions with interfering gluons (including supersymmetric processes). J. High Energy Phys., 0101:010, 2001. arXiv:0011363 [hep-ph].
[25] J. M. Butterworth, J. R. Forshaw, and M. H. Seymour. Multiparton interactions in photoproduction at HERA. Z. Phys., C72:637–646, 1996. arXiv:9601371 [hep-ex].
[26] A. Sherstnev and R.S. Thorne. Parton Distributions for LO Generators. Eur. Phys. J., C55:553–575, 2008. arXiv:0711.2473 [hep-ph].
[27] S. Frixione, F. Stoeckli, P. Torrielli, et al. The MC@NLO 4.0 Event Generator. 2010. CAVENDISH-HEP-10-12. CERN-PH-TH-2010-216. IPPP-10-62. DCPT-10-124. arXiv:1010.0819[hep-ph].
[28] S. Frixione and B. R. Webber. Matching NLO QCD computations and parton shower simulations. J. High Energy Phys., 06:029, 2002. hep-ph/0204244.
[29] S. Frixione, P. Nason, and B. R. Webber. Matching NLO QCD and parton showers in heavy flavour production. J. High Energy Phys., 08:007, 2003. hep-ph/0305252.
[30] S. Frixione, E. Laenen, P Motylinski, et al. Single-top hadroproduction in association with a W boson. J. High Energy Phys., 07:029, 2008. arXiv:0805.3067.
[31] H. Lai, M. Guzzi, J. Huston, et al. New parton distributions for collider physics. Phys. Rev., D82:074024, 2010. arXiv:1007.2241 [hep-ph].
[32] P. B. Kersevan and E. Richter-Was. The Monte Carlo event generator AcerMC version 2.0 with Interfaces to PYTHIA 6.2 and HERWIG 6.5. 2004. TPJU-2004-6.
[33] S. Jadach, Z. Was, R. Decker, et al. The tau decay library TAUOLA, Version 2.4. Comput. Phys. Commun., 76:361–380, 1993.
[34] E. Barberio and Z. Was. PHOTOS: a universal Monte Carlo for QED radiative corrections. Version 2.0. Comput. Phys. Commun., 79:291–308, 1994.
[35] M Aliev, H Lacker, U Langenfeld, et al. – HATHOR – HAdronic Top and Heavy quarks crOss section calculatoR. Comput. Phys. Commun., 182:1034–1046, 2011. arXiv:1007.1327 [hep-ph]. [36] ATLAS Collaboration. ATLAS Simulation Infrastructure. Eur. Phys. J. C., 70:823–874, 2010.
arXiv:1005.4568 [physics.ins-det].
[37] S. Agostinelli et al. GEANT4: A Simulation Toolkit. Nucl. Instrum. Meth., A506:250–303, 2003. [38] ATLAS Collaboration. Expected electron performance in the ATLAS experiment. April 2011.
ATL-PHYS-PUB-2011-006.https://cdsweb.cern.ch/record/1345327.
[39] ATLAS Collaboration. Muon reconstruction efficiency in reprocessed 2010 lhc proton-proton collision data recorded with the atlas detector. 2011. ATLAS-CONF-2011-063.
http://cdsweb.cern.ch/record/1345743.
[40] M. Cacciari, G. P. Salam, and G. Soyez. The anti-kt jet clustering algorithm. J. High Energy Phys.,
04:063, 2008. arXiv:0802.1189 [hep-ph].
[41] W Lampl, S Laplace, D Lelas, et al. Calorimeter Clustering Algorithms: Description and Performance. Apr 2008. ATL-LARG-PUB-2008-002.http://cdsweb.cern.ch/record/1099735. [42] ATLAS Collaboration. In situ jet pseudorapidity intercalibration of the ATLAS detector using dijet
events in√s=7 TeV proton-proton 2011 data. Aug 2012. ATLAS-CONF-2012-124.
http://cdsweb.cern.ch/record/1474490.
[43] ATLAS Collaboration. Commissioning of the ATLAS high-performance b-tagging algorithms in the 7 TeV collision data. Jul 2011. ATLAS-CONF-2011-102.http://cdsweb.cern.ch/record/1369219. [44] ATLAS Collaboration. Performance of the Reconstruction and Identification of Hadronic Tau Decays
with ATLAS. Nov 2011. ATLAS-CONF-2011-152.http://cdsweb.cern.ch/record/1398195. [45] B. P. Roe, H. Yang, J. Zhu, et al. Boosted decision trees, an alternative to artificial neural networks.
Nucl. Instrum. Meth., A543:577–584, 2005. arXiv:0408124 [physics.data-an].
[46] ATLAS Collaboration. Selection of jets produced in proton-proton collisions with the ATLAS detector using 2011 data. Mar 2012. ATLAS-CONF-2012-020.
https://cdsweb.cern.ch/record/1430034.
[47] ATLAS Collaboration. Measurement of the Mis-identification Probability of τ Leptons from Hadronic Jets and from Electrons. Aug 2011. ATLAS-CONF-2011-113.
http://cdsweb.cern.ch/record/1375550.
[48] ATLAS Collaboration. Performance of the ATLAS Electron and Photon Trigger in p − p Collisions at √
[49] ATLAS Collaboration. Performance of the ATLAS muon trigger in 2011. Jul 2012. ATLAS-CONF-2012-099.https://cdsweb.cern.ch/record/1462601.
[50] ATLAS Collaboration. Determination of the tau energy scale and the associated systematic
uncertainty in proton-proton collisions at√s= 7 TeV with the ATLAS detector at the LHC in 2011. Jun 2012. ATLAS-CONF-2012-054.http://cdsweb.cern.ch/record/1453781.
[51] ATLAS Collaboration. Luminosity Determination in pp Collisions at√s= 7 TeV using the ATLAS Detector in 2011. Aug 2011. ATLAS-CONF-2011-116.https://cdsweb.cern.ch/record/1376384. [52] P. Nason. A New method for combining NLO QCD with shower Monte Carlo algorithms. J. High
Energy Phys., 0411:040, 2004. arXiv:0409146 [hep-ph].
[53] S. Frixione, P. Nason, and C. Oleari. Matching NLO QCD computations with Parton Shower simulations: the POWHEG method. J. High Energy Phys., 0711:070, 2007. arXiv:0709.2092 [hep-ph].
[54] ATLAS Collaboration. Expected Performance of the ATLAS Experiment - Detector, Trigger and Physics. 2009. CERN-OPEN-2008-020. arXiv:0901.0512 [hep-ex].
[55] S. Badger, J. M. Campbell, and R.K. Ellis. QCD corrections to the hadronic production of a heavy quark pair and a W-boson including decay correlations. J. High Energy Phys., 1103:027, 2011. arXiv:1011.6647 [hep-ph].
[56] J. M. Campbell, R. K. Ellis, F. Maltoni, et al. Production of a Z boson and two jets with one heavy-quark tag. Phys. Rev. D., 73:054007, 2006. Erratum ibid. D77:019903, 2008. arXiv:0510362 [hep-ph].
The ATLAS Collaboration
G. Aad48, T. Abajyan21, B. Abbott111, J. Abdallah12, S. Abdel Khalek115, A.A. Abdelalim49, O. Abdinov11, R. Aben105, B. Abi112, M. Abolins88, O.S. AbouZeid158, H. Abramowicz153, H. Abreu136, B.S. Acharya164a,164b,a, L. Adamczyk38, D.L. Adams25, T.N. Addy56, J. Adelman176, S. Adomeit98, P. Adragna75, T. Adye129, S. Aefsky23, J.A. Aguilar-Saavedra124b,b, M. Agustoni17, M. Aharrouche81, S.P. Ahlen22, F. Ahles48, A. Ahmad148, M. Ahsan41, G. Aielli133a,133b,
T.P.A. ˚Akesson79, G. Akimoto155, A.V. Akimov94, M.A. Alam76, J. Albert169, S. Albrand55, M. Aleksa30, I.N. Aleksandrov64, F. Alessandria89a, C. Alexa26a, G. Alexander153,
G. Alexandre49, T. Alexopoulos10, M. Alhroob164a,164c, M. Aliev16, G. Alimonti89a, J. Alison120, B.M.M. Allbrooke18, P.P. Allport73, S.E. Allwood-Spiers53, J. Almond82, A. Aloisio102a,102b, R. Alon172, A. Alonso79, F. Alonso70, A. Altheimer35, B. Alvarez Gonzalez88,
M.G. Alviggi102a,102b, K. Amako65, C. Amelung23, V.V. Ammosov128,∗,
S.P. Amor Dos Santos124a, A. Amorim124a,c, N. Amram153, C. Anastopoulos30, L.S. Ancu17, N. Andari115, T. Andeen35, C.F. Anders58b, G. Anders58a, K.J. Anderson31, A. Andreazza89a,89b, V. Andrei58a, M-L. Andrieux55, X.S. Anduaga70, S. Angelidakis9, P. Anger44, A. Angerami35, F. Anghinolfi30, A. Anisenkov107, N. Anjos124a, A. Annovi47, A. Antonaki9, M. Antonelli47, A. Antonov96, J. Antos144b, F. Anulli132a, M. Aoki101, S. Aoun83, L. Aperio Bella5,
R. Apolle118,d, G. Arabidze88, I. Aracena143, Y. Arai65, A.T.H. Arce45, S. Arfaoui148, J-F. Arguin93, S. Argyropoulos42, E. Arik19a,∗, M. Arik19a, A.J. Armbruster87, O. Arnaez81, V. Arnal80, A. Artamonov95, G. Artoni132a,132b, D. Arutinov21, S. Asai155, S. Ask28,
B. ˚Asman146a,146b, L. Asquith6, K. Assamagan25,e, A. Astbury169, M. Atkinson165, B. Aubert5, E. Auge115, K. Augsten126, M. Aurousseau145a, G. Avolio30, D. Axen168, G. Azuelos93, f, Y. Azuma155, M.A. Baak30, G. Baccaglioni89a, C. Bacci134a,134b, A.M. Bach15, H. Bachacou136, K. Bachas154, M. Backes49, M. Backhaus21, J. Backus Mayes143, E. Badescu26a,
P. Bagnaia132a,132b, S. Bahinipati3, Y. Bai33a, D.C. Bailey158, T. Bain35, J.T. Baines129,
O.K. Baker176, M.D. Baker25, S. Baker77, P. Balek127, E. Banas39, P. Banerjee93, Sw. Banerjee173, D. Banfi30, A. Bangert150, V. Bansal169, H.S. Bansil18, L. Barak172, S.P. Baranov94,
A. Barbaro Galtieri15, T. Barber48, E.L. Barberio86, D. Barberis50a,50b, M. Barbero21, D.Y. Bardin64, T. Barillari99, M. Barisonzi175, T. Barklow143, N. Barlow28, B.M. Barnett129, R.M. Barnett15, A. Baroncelli134a, G. Barone49, A.J. Barr118, F. Barreiro80,
J. Barreiro Guimar˜aes da Costa57, R. Bartoldus143, A.E. Barton71, V. Bartsch149, A. Basye165, R.L. Bates53, L. Batkova144a, J.R. Batley28, A. Battaglia17, M. Battistin30, F. Bauer136, H.S. Bawa143,g, S. Beale98, T. Beau78, P.H. Beauchemin161, R. Beccherle50a, P. Bechtle21, H.P. Beck17, K. Becker175, S. Becker98, M. Beckingham138, K.H. Becks175, A.J. Beddall19c, A. Beddall19c, S. Bedikian176, V.A. Bednyakov64, C.P. Bee83, L.J. Beemster105, M. Begel25, S. Behar Harpaz152, P.K. Behera62, M. Beimforde99, C. Belanger-Champagne85, P.J. Bell49, W.H. Bell49, G. Bella153, L. Bellagamba20a, M. Bellomo30, A. Belloni57, O. Beloborodova107,h, K. Belotskiy96, O. Beltramello30, O. Benary153, D. Benchekroun135a, K. Bendtz146a,146b, N. Benekos165, Y. Benhammou153, E. Benhar Noccioli49, J.A. Benitez Garcia159b,
D.P. Benjamin45, M. Benoit115, J.R. Bensinger23, K. Benslama130, S. Bentvelsen105, D. Berge30, E. Bergeaas Kuutmann42, N. Berger5, F. Berghaus169, E. Berglund105, J. Beringer15, P. Bernat77, R. Bernhard48, C. Bernius25, T. Berry76, C. Bertella83, A. Bertin20a,20b, F. Bertolucci122a,122b,