Publisher’s version / Version de l'éditeur:
Journal of the Association of Asphalt Paving Technologists, 27, pp. 85-122, 2007-12-01
READ THESE TERMS AND CONDITIONS CAREFULLY BEFORE USING THIS WEBSITE.
https://nrc-publications.canada.ca/eng/copyright
Vous avez des questions? Nous pouvons vous aider. Pour communiquer directement avec un auteur, consultez la
première page de la revue dans laquelle son article a été publié afin de trouver ses coordonnées. Si vous n’arrivez pas à les repérer, communiquez avec nous à PublicationsArchive-ArchivesPublications@nrc-cnrc.gc.ca.
Questions? Contact the NRC Publications Archive team at
PublicationsArchive-ArchivesPublications@nrc-cnrc.gc.ca. If you wish to email the authors directly, please see the first page of the publication for their contact information.
This publication could be one of several versions: author’s original, accepted manuscript or the publisher’s version. / La version de cette publication peut être l’une des suivantes : la version prépublication de l’auteur, la version acceptée du manuscrit ou la version de l’éditeur.
Access and use of this website and the material on it are subject to the Terms and Conditions set forth at Development of crack sealant bending beam rheometer (CSBBR) testing to characterize hot-poured bituminous crack sealants at low temperatures
Al-Qadi, I. L.; Yang, S-H.; Dessouky, S.; Masson, J-F.
https://publications-cnrc.canada.ca/fra/droits
L’accès à ce site Web et l’utilisation de son contenu sont assujettis aux conditions présentées dans le site
LISEZ CES CONDITIONS ATTENTIVEMENT AVANT D’UTILISER CE SITE WEB.
NRC Publications Record / Notice d'Archives des publications de CNRC:
https://nrc-publications.canada.ca/eng/view/object/?id=4b2a5b46-099c-48ed-be2e-c423da4bc9f0 https://publications-cnrc.canada.ca/fra/voir/objet/?id=4b2a5b46-099c-48ed-be2e-c423da4bc9f0
D e v e l o p m e n t o f c r a c k s e a l a n t b e n d i n g b e a m
r h e o m e t e r ( C S B B R ) t e s t i n g t o c h a r a c t e r i z e
h o t - p o u r e d b i t u m i n o u s c r a c k s e a l a n t s a t l o w
t e m p e r a t u r e s
N R C C - 4 6 8 9 9
A l - Q a d i , I . L . ; Y a n g , S - H . ; D e s s o u k y , S . ;
M a s s o n , J - F .
A version of this document is published in / Une version de ce document se trouve dans: Journal of the Association of Asphalt Paving Technologists, v. 27, 2007, pp. 85-122
The material in this document is covered by the provisions of the Copyright Act, by Canadian laws, policies, regulations and international agreements. Such provisions serve to identify the information source and, in specific instances, to prohibit reproduction of materials without written permission. For more information visit http://laws.justice.gc.ca/en/showtdm/cs/C-42
Les renseignements dans ce document sont protégés par la Loi sur le droit d'auteur, par les lois, les politiques et les règlements du Canada et des accords internationaux. Ces dispositions permettent d'identifier la source de l'information et, dans certains cas, d'interdire la copie de documents sans permission écrite. Pour obtenir de plus amples renseignements : http://lois.justice.gc.ca/fr/showtdm/cs/C-42
Development of Crack Sealant Bending Beam Rheometer (CSBBR) Testing to Characterize Hot-Poured Bituminous Crack Sealant at Low Temperature
Imad L. Al-Qadi1, Sheh-HseinYang2, Samer Dessouky3, and J-F. Masson4
Abstract
Hot-poured bituminous crack sealants are used to protect pavement systems from the intrusion of water and help delay pavement degradation. Crack sealing is a widely accepted, cost-effective routine maintenance procedure that increases pavement service life. Current American Society for Testing Materials (ASTM) standards do not correlate the selection of crack sealants to their field performance. The development of performance-based guidelines will assist in selecting a sealant based on specific local needs, such as climate conditions.
Several testing methods have been developed as part of the ongoing research to develop performance-based guidelines for hot-poured bituminous crack sealants. In this paper, a modified test using a bending beam rheometer (BBR) has been developed and identified as a reliable method to evaluate the rheological behavior of hot-poured bituminous crack sealants. In this test that uses the crack sealant bending beam rheometer (CSBBR), a double thickness of the standard bending beam was found to overcome excessive deflections during testing. The new beam geometry had a negligible effect on the resulting deflection caused by shear. In addition to changes in specimen geometry and preparation, a newly developed aging procedure, a validated testing period, and a time
1
Founder Professor of Engineering, Department of Civil and Environmental Engineering; Director, Illinois Center for Transportation, University of Illinois at Urbana-Champaign, Urbana, IL 61801
2
Graduate Research Assistant, Department of Civil and Environmental Engineering, University of Illinois at Urbana-Champaign, Urbana, IL 3
Research Scientist, University of Illinois at Urbana-Champaign, Urbana, IL, 4 Senior Research Officer, Institute for Research in Construction, National Research Council of Canada, Ottawa, ON, K1A 0R6, Canada
at which stiffness is determined were introduced. Nine sealants, with a wide range of rheological behaviors, were tested between – 4°C and –40°C. Three performance parameters, the stiffness at 240s, the average creep rate, and the dissipated energy ratio were analyzed and successfully used to distinguish among sealant behaviors.
A viscoelastic model using Prony series expansion to characterize crack sealant mechanical behavior at low temperatures and strain levels was developed. A three-dimensional finite
element was used to determine the time-dependent deflection at the mid-span of the CSBBR specimen. A description of the linearity response of crack sealants at low temperature is also presented. The developed model was found to be capable of simulating deflection both during the loading and the unloading process for tested sealants.
Introduction
Crack sealing and filling is a routine task of a comprehensive pavement preventative and maintenance program. Crack
sealing/filling prevents the entrance of water into the pavement structure, thus preventing pavement weakening and delaying deterioration. Assuming that an appropriate sealant material is correctly installed at the right time in pavement life, several years of service life may be added to the pavement at a relatively low cost. Several studies have demonstrated the cost-effectiveness of crack sealing/filling (1-7). The Province of Ontario reported that crack sealing added about four years of life to flexible pavements (6). Chong (7) also reported that maximum cost effectiveness was attained when the first treatment was performed between the third and fifth years of the pavement’s service life and a second treatment between the eighth and ninth years of the pavement’s service life.
To maintain a cost-effective crack sealing/filling operation, two types of factors must be controlled: (1) factors unrelated to the properties of the sealants (such as quality of installation and sealant configuration), and (2) mechanical and rheological properties of the sealant (viscosity, softness, bond strength, etc.). Both factors must be addressed in order to achieve the expected performance of the
sealing/filling operation. Regardless of sealant quality, improper installation will cause premature failure and lead to a shorter service life.
The installed sealant material should have the appropriate rheological properties to resist crack movements, particularly during the winter season. Cracks in pavements can experience movement in both horizontal and vertical directions. Vertical movement results primarily from traffic loading. Because the crack may divide the pavement into two parts, differential movement between the two parts occurs when the load transfer is inefficient; this is usually referred to as a “working crack”. Horizontal movement of the crack is primarily due to thermal expansion and contraction of the
pavement. Thermally induced movements are reported to occur on a seasonal rather than daily basis (8). Cracks open the most during winter, and tend to close during summer. However, cracks never return to their original width. In fact, they seem to increase in width every year (8). In some cases, cracks were found to move a
considerable amount, while in other cases, they barely moved. Existing standards and specifications in the United States and Canada describe specific test methods to evaluate the performance of crack sealants. Laboratory tests and specifications for crack sealant materials were established by several organizations, including the American Society for Testing and Materials (ASTM), American Association of State Highway and Transportation Officials (AASHTO), and U.S. and Canadian federal, state, provincial, and municipal agencies. Laboratory testing is usually performed to ensure that a material has the necessary properties to perform well in the field and to comply with the manufacturer’s specifications. Chehovits and Manning (9) reported eight specific properties that are important for crack sealants:
1. ability to be easily and properly placed in a crack through application equipment,
2. adequate adhesion to remain bonded to HMA crack faces, 3. adequate resistance to softening and flow at high, in-service
pavement temperatures so that the sealant will not flow from the crack, which will, therefore, prevent tracking, 4. adequate flexibility and extensibility to remain bonded to
crack faces when extended at low, in-service temperatures, 5. sufficient elasticity to restrict the entrance of
6. sufficient pot life at application temperatures,
7. resistance to degradation from weather to ensure long in-service life of the sealant, and
8. compatibility with HMA, and low cure time to permit opening to traffic as soon as possible after application. Although the ASTM and the AASHTO standard tests are used to classify sealing/filling materials, as found in many research efforts, they do not provide a good indication of field performance (10-13). These tests are empirical; their measured values are not based on any rheological properties. Therefore, it is currently
believed that the most promising method to evaluate the performance of sealing materials is through field evaluations. However, even the results from field tests are sometimes controversial because a sealant can perform well in one site and fail in another, simply because of differences in environmental conditions. Masson and Lacasse (14) found no correlation between field performance and the results from the current ASTM specifications for the selection of hot-poured crack sealants.
Several tests exist that are thought to indicate whether a selected crack sealant material possesses the appropriate properties. ASTM Standard D5329 (Standard Test Methods for Sealants and Fillers, Hot-Applied, for Joints and Cracks in Asphaltic and Portland Cement Concrete Pavements) summarizes most of these tests. These include non-immersed cone penetration, fuel-immersed cone
penetration, the flow test, the no-immersed bond test, the water-immersed bond test, the fuel-water-immersed bond test, the resilience test, the oven-aged resilience test, the asphalt compatibility test, the artificial weathering test, the tensile adhesion test, the solubility test, and the flexibility test.
These tests are used by most state highway agencies in selecting their crack sealing materials. However, the specification limits vary from one state to another. These differences create difficulties for crack sealant suppliers because many states with the same environmental conditions specify different types of materials. The inability of these tests to characterize the rheological properties of bituminous crack sealants or to predict sealant performance in the field results in inappropriate selection of sealants for field
applications. This leads to premature failure when sealants are used in unfavorable conditions.
crack sealants is lack of a test that simulates short- and long-term aging of the material. Chehovits and Manning (9) suggested the use of a carbon arc or ultraviolet-type weatherometer in order to study the resistance of crack sealants to weathering. However, these methods do not reproduce the actual short- and long-term aging mechanisms that sealants may actually experience. To test that effect, Masson et al. (10) suggested that the short- and long-term aging rates and mechanisms for various sealant compositions be established so that they can be reproduced and accelerated in the lab.
Objectives and Scope
Because of the aforementioned drawbacks of current crack sealant standards and the large variety of crack sealant materials currently available in the market and new products coming out yearly, it is imperative to establish new performance-based guidelines for the selection of crack sealant materials based on expected field
performance. Therefore, the objective of this work is to develop laboratory tests that measure sealant rheological properties, which will guide in the selection of sealant materials. Ultimately, crack sealant performance in a particular site could be predicted, with the benefit of being able to select more durable sealants. In this study, it was attempted to make use of the well-established equipment
originally developed during the five-year Strategic Highway Research Program (SHRP), which were used for measuring binder rheological behavior as part of the performance grade (PG) system.
This paper describes the characteristics of hot-poured bituminous sealant at low temperatures using the crack sealant bending beam rheometer (CSBBR) device, which is a modified version of the conventional BBR developed by SHRP. This paper also describes a testing program conducted on sealants, widely used in different geographic zones in North America, and the analysis of test results. The aging process and its influence on sealant behavior are also discussed. In addition, linear response verification for crack sealant at low temperature is presented to verify the assumption of using linear viscoelastic principles. Upon linear verification, a
description of the constitutive model is then described, followed by finite element simulation and validation.
Experimental Program
Crack Sealant Types and Identification
In general, sealants are composed of bitumen, styrene-butadiene copolymer, and filler. The styrene-styrene-butadiene (SB) copolymer consists of linked blocks of polystyrene (PS) and polybutadiene (PB). The fillers may include ground tire rubber, mineral fines, calcium carbonate, and fibers. The chemical composition of crack sealants can significantly influence its rheological properties. Therefore, nine sealants used in various climatic zones in North America provided by various suppliers, labeled AB, AE, BB, MM, NN, PP, QQ, YY, and ZZ, were selected for this study to examine the performance-based hypothesis. The tested products have a wide array of rheological behaviors and were expected to perform adequately in cold environments with a low temperature range from –4°C to –40°C. Sealant QQ is the stiffest and sealant BB is the softest. Variations in the rheological properties can be attributed to various factors, including the source and the refining of bitumen, and the type and content of polymer, filler, and additives.
Although nine types of tests are usually required in the ASTM standard, only three standard tests in accordance with ASTM D5329 (15) and D6690 (16) were used. Table 1 summarizes the testing results using non-immersed cone penetration and resilience tests at 25°C, and flow test at 60°C.
The cone penetration test gives an indication of the consistency of the material. In this test, a special cone weighing 150g penetrates the tested sample for 5s and records the penetration in dmm. The deeper the cone penetrates, the softer the material. The test is typically performed at 25°C. The test itself is empirical and does not provide rheological properties for the tested material.
The resilience test is another empirical test that gives an indication of the elastic characteristics of the sealant. The test is typically performed at 25°C and consists of measuring the material recovery after a 75 g special ball is pushed towards it.
The flow test is performed to indicate whether the material has adequate resistance to softening and flow at high, in-service pavement temperatures. The test measures the flow in millimeters of a material placed at 75° angle with the horizontal surface at a
temperature of 60°C. Although this test gives a good indication of the material’s resistance to flow at this temperature, it is again empirical and does not measure rheological properties.
Table 1 ASTM Standard Sealant Specification Results As Reported by Manufacturers Sealant Penetration at 25°C (dmm) Resilience at 25°C (%) Flow at 60°C (mm) BB 148 80 0 NN 75 70 0 PP 130 44 1 MM 120 70 1 AE 90 60 3 AB 40 23 N/A QQ 22 36 0 YY 42 N/A N/A ZZ 42 N/A N/A
Crack Sealant Bending Beam Rheometer (CSBBR)
To measure the low-temperature creep response of a
viscoelastic material such as asphalt binder, a constant load is applied on a mid-span of a simply supported asphalt beam at low
temperature using the Bending Beam Rheometer (BBR) (17-19). The deflection at the center of the beam is then measured using a linear variable differential transducer (LVDT). In addition to
deflection, the load applied on the beam, the time of loading, and the bath temperature are also measured and obtained. A fluid bath reservoir, made of stainless steel and insulated with high-density foam backing, is used to control the testing temperature. A
circulating chiller allows the bath temperature to go as low as –40°C with a stability of ±0.1°C. The beam dimensions are selected to meet the requirements for using elementary bending theory (17). A testing beam span of 102mm, with a width of 12.7mm and a thickness of
6.35mm, is chosen to test the binders. When a 980mN vertical load is applied and the center deflection of the beam throughout the 4-min test procedure is measured, the creep stiffness (S) and creep rate (m) at 60s can be calculated. Utilizing the elastic-viscoelastic
correspondence principle, the elementary beam theory was adopted to calculate the creep stiffness of a prismatic beam in a three-point bending mode (17).
In earlier work, bituminous hot-poured crack sealants were tested using the standard BBR (20). However, because of the greater flexibility of crack sealants and the large deformation experienced under loading, it was concluded that this equipment was not suitable for measuring the stiffness of these materials. Therefore, in order to use the equipment developed by SHRP, modifications were made to allow for testing of hot-poured sealants. Al-Qadi et al. (21)
recommended doubling the beam thickness to increase beam inertia and hence, to decrease ultimate deflection and allow the softest sealant to be tested. The study indicated that the change in the beam cross-section did not violate the assumption of elementary beam theory because 96% of the beam’s deflection is due to the bending effect. In other words, the deflection due to the shear effect is only 4%, which can be considered negligible or included in the calculation.
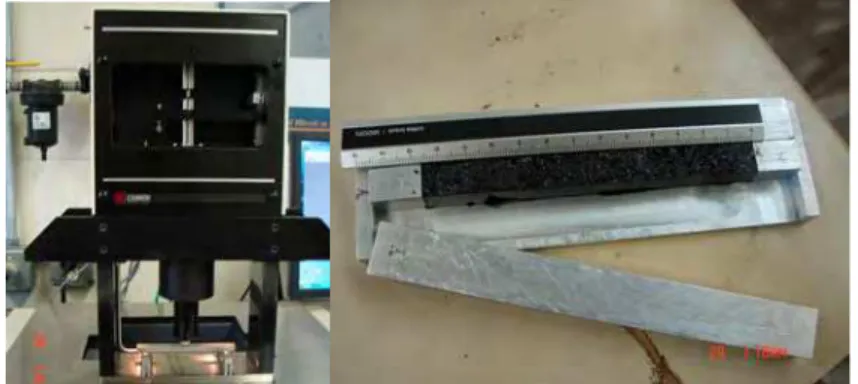
Figure 1 shows the newly designed mold and the prepared crack sealant beam being tested in the CSBBR. Throughout testing, the beam, newly designed supports, and the lower part of the test frame are submerged in a constant-temperature fluid bath, which controlled the test temperature.
Figure 1 The newly designed crack sealant mold (right), with prepared crack sealant beam being tested in the CSBBR.
To ensure repeatability in testing the sealants, homogenized samples were prepared in accordance with ASTM D5167 (Practice for Melting of Hot-Applied Joint and Crack Sealant and Filler for Evaluation[26]). The homogenized sealant was poured and stored into a beam-shaped mold for later use. Unaged CSBBR test samples are first obtained by slicing the homogenized beams into pieces weighing 35±0.5g. The selected sample weight is sufficient to prepare one CSBBR specimen. The sealant is then placed in a vacuum-pressure oven for 16hr at 115°C to age. The detail of this aging procedure and its validity will be the subject of another publication. The aged sealant is poured into small containers. Each container accommodates the volume needed for making one
specimen.
For preparing CSBRR specimens for testing, the small containers are heated for 30min at sealant’s recommended pouring temperature (Tp). After 15mins of heating the sealant, the CSBBR
mold is placed into another preheated oven at Tp-50°C. The sealants
are then poured into the heated new CSBBR stainless steel mold. Four replicates are fabricated for each sealant, and the average results of three specimens that produce the least coefficient of variation (COV) are selected for the analysis (21).
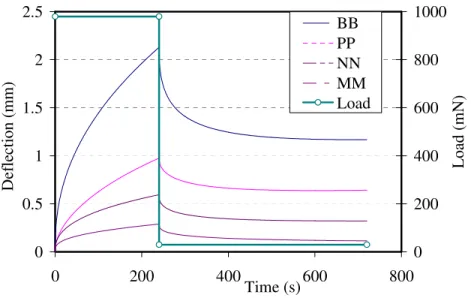
Analogous to the SuperPaveTM binder specifications, sealant specimens are conditioned for 1hr at the test temperature prior to testing in the CSBBR to reach the isothermal condition. A constant load of 980±10mN is applied for 240s at the mid-span of the simply supported sealant beam, followed by a seating load of 35±10mN for 480s. The seating load is used to ensure full contact of the loading nose with the upper surface of the beam in order to record the
recovered deflection. Figure 2 depicts the typical deflection response for sealants BB, NN, MM, and PP at –40°C.
0 0.5 1 1.5 2 2.5 0 200 400 600 800 Time (s) Deflection (mm) 0 200 400 600 800 1000 Load (mN) BB PP NN MM Load
Figure 2 Creep response for soft sealants at –40°C.
Linear Response Verification at Low Temperature
The SuperPaveTM specifications for asphalt binder assume that creep responses are measured in the linear region of its viscoelastic behavior. In order for the time-temperature
superposition principle to be valid, measurements must be taken at relatively small strain amplitude. Therefore, it is essential to ensure that measurements are obtained in the linear region of viscoelastic behavior. Quantifying the linear response of sealant materials has been studied by several researchers (22, 23). The studies utilized two conditions to verify linearity as suggested by Marasteanu and
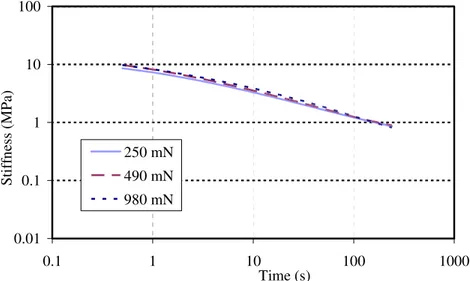
Anderson (24): time response measurements should be independent of the applied stress level, and the linear superposition principle is applicable to a sequence of loading and unloading cycles. Creep loading at 250, 490, and 980mN was conducted on sealant NN. Testing results indicated that stiffness was independent of the applied stress level (Figure 3). This finding was verified by Al-Qadi et al. (22), who concluded that stiffness independent of the load level is applicable for sealants at low temperature.
0.01 0.1 1 10 100 0.1 1 10 100 1000 Time (s) Stiffn es s ( M Pa ) 250 mN 490 mN 980 mN
Figure 3 Creep stiffness measurements for sealant NN at –40°C. The second condition of linearity, however, could not be verified experimentally due to the sealant’s soft behavior, which resulted in material creeping due to the presence of a seating load (35mN). Testing of soft sealant BB at -34°C indicated that as the constant load (980mN) was released, the material recovered and then started creeping after 50s of unloading (Figure 4). Therefore, an analytical approach to investigate the second condition of linearity using a numerical solution such as the finite element (FE) method was conducted. For linear viscoelastic behavior, the deflection at time t and the recovery at time 240+t (in seconds) should be equal or within 5% difference. Elseifi et al. (23) presented a technique to evaluate the superposition of response to various sequences of
loading using FE to extrapolate the deflection curve for 240s after the onset of unloading. Table 2 summarizes the measured deflections for sealants AB, NN, YY, and ZZ at 120 and 240s and the
corresponding FE measurements at 360 and 480s, respectively. It was found that by using two points in the deflection curves, the maximum error was less than 4%. This finding suggests that a viscoelastic principle can be applied to crack sealants, as analytically proven later in the paper.
0 0.5 1 1.5 2 0 100 200 300 400 500 600 Time (s) D eflection (mm) 0 200 400 600 800 1000 Load (mN) Deflection Load
Figure 4 Creep measurements for sealant BB at –34°C. Table 2 Analytical Results for Verifying the Linear Superposition Principle Sealant Experimental deflection at 120s (mm) FE deflection at 360s (mm) Error (%) Experimental deflection at 240s (mm) FE deflection at 480s (mm) Error (%) AB 1.60 1.63 1.55 2.04 2.03 0.66 NN 1.12 1.09 3.47 1.49 1.44 3.84 YY 0.48 0.48 0.14 0.62 0.63 0.92 ZZ 1.75 1.74 0.50 2.32 2.25 2.80 Performance Parameters Stiffness
Under a short period of loading, sealant can be brittle and may crack if the material is unable to dissipate the energy imposed through deformation. However, because the thermal load is typically applied progressively and crack sealants are much more compliant than asphalt binder, the occurrence of this failure mechanism may not be critical. Hence, maintaining sealant flexibility and
extendibility for a long period, 3 to 10hr, at the lowest expected temperature is the key to preventing failure.
Stiffness can be used to measure sealant softness behavior. Consequently, stiffness at 240s was used in an attempt to predict sealant stiffness after 5hr of loading, using the time-temperature superposition principle (25). The 5hr period was identified as the time required to ensure that the internal stresses would dissipate due to stress relaxation when the sealant undergoes tensile strain at constant temperature in static cracks (22). In addition, the 240s loading time provides a sufficient time span to create an overlap between various creep curves to construct a master curve over several orders of magnitude (25).
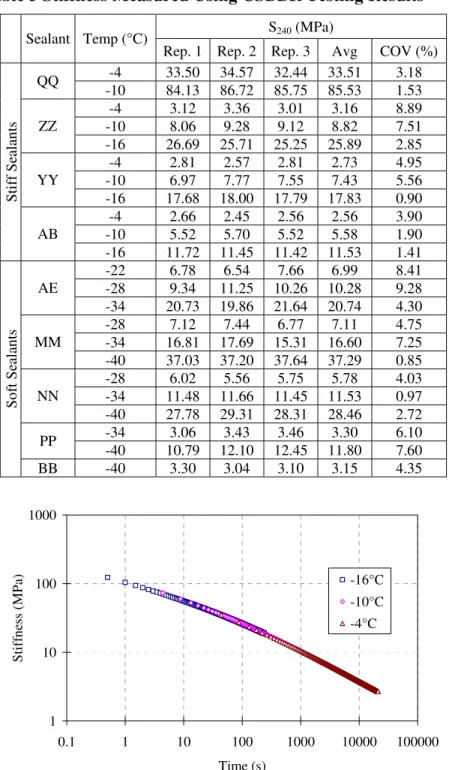
Table 3 presents the stiffness repeatability for three replicates of aged sealants. The stiffness of sealants BB, MM, NN, AE, and PP was measured at –40°C, –34°C, and –28°C, while stiffness for sealants AB, QQ, YY, and ZZ was measured at –16°C, –10°C, and – 4°C. The lowest testing temperatures were recommended by the manufacturer, and a fixed increment of six degrees was selected to imitate the increment used in the binder’s performance grade specification. A comprehensive statistical analysis of variance with pairwise comparisons has shown that stiffness measured by CSBBR could be used to distinguish between sealants (21).
Due to the high flexibility of some sealants (e.g. BB) at specific temperatures and because of equipment limitations, the stiffness measurement was unsuccessful for those sealants. The maximum stiffness measured at 240s was detected for the stiff sealant QQ at –0°C, while BB at –40°C exhibited the lowest stiffness among all the sealants tested. Using the aforementioned rationale in which a low stiffness is desirable in preventing cohesive failure, measurement data implied that sealant BB would perform better and QQ would perform worse among sealants.
Figure 5 presents the constructed master curve for sealant YY at –4°C, –10°C, and –16°C. The master curve makes it possible to determine the stiffness after 5hr of loading at a reference temperature of –16°C. At the same temperature, the reduction in stiffness after 5hr of creep loading is significant and ranges between 70% and 80% of the calculated stiffness at a loading time of 240s (22). If the temperature superposition principle is applied, the stiffness at 240s for a given temperature can be used to predict the stiffness after 5hr of loading at 12°C below testing temperature.
Table 3 Stiffness Measured Using CSBBR Testing Results
S240 (MPa) Sealant Temp (°C)
Rep. 1 Rep. 2 Rep. 3 Avg COV (%) -4 33.50 34.57 32.44 33.51 3.18 QQ -10 84.13 86.72 85.75 85.53 1.53 -4 3.12 3.36 3.01 3.16 8.89 -10 8.06 9.28 9.12 8.82 7.51 ZZ -16 26.69 25.71 25.25 25.89 2.85 -4 2.81 2.57 2.81 2.73 4.95 -10 6.97 7.77 7.55 7.43 5.56 YY -16 17.68 18.00 17.79 17.83 0.90 -4 2.66 2.45 2.56 2.56 3.90 -10 5.52 5.70 5.52 5.58 1.90 Stiff Sealan ts AB -16 11.72 11.45 11.42 11.53 1.41 -22 6.78 6.54 7.66 6.99 8.41 -28 9.34 11.25 10.26 10.28 9.28 AE -34 20.73 19.86 21.64 20.74 4.30 -28 7.12 7.44 6.77 7.11 4.75 -34 16.81 17.69 15.31 16.60 7.25 MM -40 37.03 37.20 37.64 37.29 0.85 -28 6.02 5.56 5.75 5.78 4.03 -34 11.48 11.66 11.45 11.53 0.97 NN -40 27.78 29.31 28.31 28.46 2.72 -34 3.06 3.43 3.46 3.30 6.10 PP -40 10.79 12.10 12.45 11.80 7.60 Soft Sealants BB -40 3.30 3.04 3.10 3.15 4.35 1 10 100 1000 0.1 1 10 100 1000 10000 100000 Time (s) Stif fness (MPa) -16°C -10°C -4°C
Figure 5 Construction of a master curve from the CSBBR test data obtained at three temperatures for sealant YY.
It is note worthy that the rationale for setting a maximum threshold limit for crack sealant stiffness is to ensure that the sealant maintains adequate flexibility at low temperature for at least five hours. Sealant stiffness thresholds will be identified, in another
publication, as part of the comprehensive sealant selection guidelines. The CSBBR stiffness parameter results show poor
correlation with the current ASTM standard results (Figure 6). Although conducted at various temperatures, the resilience test
shows agreement with the stiffness measurements at low temperature. The softer the sealant, the more it deforms, and the less it recovers. However, no such agreement was noticed between penetration and stiffness results. Similarly, no relationship between the flow test and stiffness exists. 0 40 80 120 160 Stiffness@-40°C 3.15 11.80 37.29 28.46 Penetration @ 25°C 148 130 120 75 Resilience @ 25°C 80 44 70 70 BB PP MM NN
(a)
0 40 80 120 Stiffness@-40°C 85.53 7.43 8.82 5.58 Penetration @ 25°C 22 42 40 Resilience @ 25°C 36 23 QQ YY ZZ AB
(b)
Figure 6 Relationship between ASTM sealant test results and CSBBR measured stiffness at -40°C (a) soft sealants and (b) stiff sealants.
Average Creep Rate
The creep rate, a performance parameter, can be used as an indication of ability to deform under loading at low temperature (22). The average creep rate can be determined from the power law model of creep data versus time. Table 4 presents the results of average creep rate for the tested sealants. In general, an agreement exists between the average creep rate and stiffness for all tested sealants. While average creep rate increases with increasing temperature, sealant NN shows minimum temperature effect.
Table 4 Average Creep Rate for Soft and Stiff Sealants
Sealant Temp (°C) Average Creep Rate (mm/s) –4 0.382 QQ –10 0.263 –4 0.460 –10 0.427 ZZ –16 0.372 –4 0.440 –10 0.412 YY –16 0.336 –4 0.375 –10 0.345 Stiff sealan ts AB –16 0.301 –28 0.324 AE –34 0.302 –28 0.365 –34 0.355 MM –40 0.334 –28 0.346 –34 0.343 NN –40 0.344 -34 0.450 PP -40 0.407 Soft sealants BB -40 0.428
Dissipated Energy Ratio
Another indicator considered in this study was the energy dissipating ratio. In order to investigate the sealant’s viscoelastic nature, the two-term Prony series model was used. For calculating the energy associated with a mechanical test, the springs relate to the storage energy while the dashpots relate to dissipation energy. The relationship between strain, ε, and stress, σ, can be expressed by the compliance, D(t)=ε/σ. The Prony series model is related to creep compliance as follows: 1 ( ) ( ) 0 1 2 1 1 1 ( ) (1 t ) (1 ) D t e e E E E τ − = + − + − − t τ2 (1)
where,
D(t) = is the tensile creep compliance at time t; Ei = material constants, and
τI = retardation time.
The parameters of Prony series are not time-dependent variables relative to creep modulus or compliance. Hence, the CSBBR test data was first converted to compliances. Prony series parameters were then calculated for each test. The measured compliance was fitted to the Prony series model using regression analysis. Figure 7 presents a comparison between the experimental-measured and model-predicted creep compliances. Given the clear agreement in Figure 7, the Prony series parameters were used to calculate the dissipated and stored energies for each sealant. Equations 2 and 3 present the stored and dissipated energy calculations, respectively (27). ⎥ ⎦ ⎤ ⎢ ⎣ ⎡ ⎟ ⎠ ⎞ ⎜ ⎝ ⎛ − + + ⎟ ⎠ ⎞ ⎜ ⎝ ⎛ − + + = − − − −2 2 2 1 2 1 1 2 2 1 2 1 2 1 2 1 2 1 0 2 0 τ τ τ τ σ t t e t e t E e e E E Wstore (2) ⎥ ⎦ ⎤ ⎢ ⎣ ⎡ ⎟ ⎠ ⎞ ⎜ ⎝ ⎛ − + ⎟ ⎠ ⎞ ⎜ ⎝ ⎛ − = − −2 2 1 2 1 2 1 1 2 1 2 1 2 0 τ τ σ t e t E e E Wdissipated (3) where,
W= energy per volume;
t = the maximum loading time (240s), and
σ0 = the stress in outer fiber at mid-span and calculated as
follows: 0 2 3 2 PL bh σ = . (4)
The energy dissipation ratio is calculated as Wdissipated/Wstored.
The average values of energy dissipation ratios for tested sealants are presented in Table 5. One of the desired properties of crack sealant material is to relax the imposed loading to prevent stress failure. If the energy dissipation ratio is greater than unity, it implies that the material is able to dissipate the imposed loading more quickly. Hence, energy dissipation ratio can be a good indication for crack sealant selection.
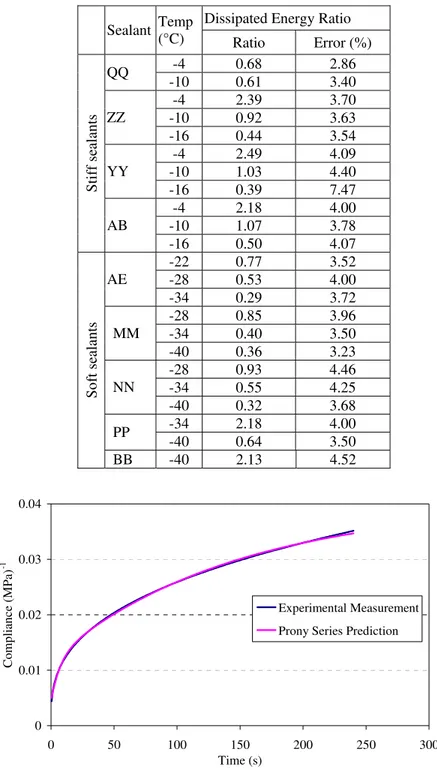
Table 5 Dissipated Energy Ratio for Soft and Stiff Sealants
Dissipated Energy Ratio Sealant Temp (°C) Ratio Error (%) -4 0.68 2.86 QQ -10 0.61 3.40 -4 2.39 3.70 -10 0.92 3.63 ZZ -16 0.44 3.54 -4 2.49 4.09 -10 1.03 4.40 YY -16 0.39 7.47 -4 2.18 4.00 -10 1.07 3.78 Stiff sealan ts AB -16 0.50 4.07 -22 0.77 3.52 -28 0.53 4.00 AE -34 0.29 3.72 -28 0.85 3.96 -34 0.40 3.50 MM -40 0.36 3.23 -28 0.93 4.46 -34 0.55 4.25 NN -40 0.32 3.68 -34 2.18 4.00 PP -40 0.64 3.50 Soft sealants BB -40 2.13 4.52 0 0.01 0.02 0.03 0.04 0 50 100 150 200 250 300 Time (s) Co m p li an ce ( M P a) -1 Experimental Measurement Prony Series Prediction
Figure 7 Experimental data for sealant NN at -40°C fitting with two terms Prony series model.
Effect of Aging on Sealants
When sealant is subjected to weathering, it becomes stiffer. Hence, it is important to simulate the effects of aging on sealants because their mechanical properties can be altered from their original state. Sealant aging is typically divided into two categories: short-term aging, which occurs during the installation process, and long-term aging, which occurs after construction, primarily due to climate exposure and loading.
Currently, there is no effective method to simulate hot-poured bituminous crack sealant aging. For binder, aging effects are usually accounted for by subjecting the binder to simulated aging, then finding its mechanical properties by conducting standard
physical tests (such as viscosity, dynamic shear rheometer, BBR, and the direct tension test). In this study, vacuum-oven aging (VOA) was used to simulate the aging and weathering of crack sealants during installation and service. The aging procedure was developed by Masson at National Research Council Canada (NRC) as part of this project and will be the subject of another publication, and VOA sealants were compared to the sealants weathering in the field for 1, 3, and 9 years. The results showed that the VOA process can properly simulate field conditions.
In the procedure, the homogenized sealant is cut into slices and then placed in a stainless steel pan in a heated oven in order to achieve a film thickness of less than 2mm. The sealant is then removed from the oven and allowed to cool down at room
temperature before enduring accelerated aging in the vacuum oven, which is preheated to 115ºC. The sealant is then transferred into the vacuum oven and heated for 16hr under a vacuum of 760mm of mercury. After 16hr of aging, the steel pan is then placed back in a regular oven at 180°C and heated until the sealant is sufficiently fluid. All the sealant is poured into one container, which ensures the
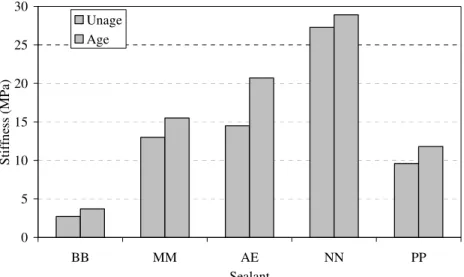
homogeneity of the sealant for future performance testing. Through chemical analysis, this procedure is shown to be suitable for aging bituminous crack sealants. It does not cause significant degradation of polymer constituents. A comparison of sealant aged in the laboratory following the proposed procedure is presented in Figures 8 and 9. In Figure 8, both aged and unaged sealants were tested at -40°C and in Figure 9; sealants were tested at -10°C. Results clearly
show that tested sealants stiffened, and the degree of stiffness variation among sealants depended on the sealant’s chemical composition. 0 5 10 15 20 25 30 BB MM AE NN PP Sealant Stif fne ss (M P a) Unage Age
Figure 8 Effect of aging on stiffness for soft sealants.
0 10 20 30 40 50 60 70 80 90 YY ZZ AB QQ Sealant S tif fness (MPa) Unage Age
Variation Study
Precision and bias are two of the most important factors that must be considered when developing performance-based guidelines. Results for single-operator precision (repeatability), as defined in ASTM C670, have been presented in Table 3. Precision is the measurement of the greatest difference between two or more test results that would be considered acceptable when properly conducted. Table 3 shows that repeatability of the stiffness measurements for all sealants conducted by a single operator was less than 10%. The results indicated that a good level of repeatability can be achieved if the test procedure developed by Al-Qadi et al. (22) is followed.
Two identified operators and two CSBBR devices, by two manufacturers, were utilized for bias evaluation. Unaged Sealants BB, MM, AE, and ZZ were selected. Their selection reflected various chemical compositions and geographic locations in which they are used.
A statistical paired t-test was conducted on six sealants to determine any significant differences among the selected operators and devices. As shown in Figure10, no significant differences were detected at the 95% confidence level for stiffness values at 240s measured by the two operators using the same device. Results also revealed that one device recorded higher stiffness values than the other, as shown in Figure 11. The paired t-test results implied that there is significant difference of the measured stiffness obtained from the two devices. It is worth noting that all tests in this study were conducted using device I.
0 5 10 15 20 25 30 35 40 BB WW MM AE VV ZZ Sealant S ti ffn es s (M P a) Operator I Operator II
Figure 10 Comparison of average stiffness at 240s between two operators. 0 5 10 15 20 25 30 35 40 BB WW MM AE VV ZZ Sealant Stiffness (M Pa) Device I Device II
Figure 11 Comparison of average stiffness at 240s between two devices.
Constitutive Modeling of Crack Sealant Behavior
In this section, a constitutive model for crack sealant behavior is presented. Utilizing the creep test data for low
temperature obtained using the CSBBR, Elseifi et al. (23) developed a constitutive model to study the mechanical behavior of crack sealant at low service temperatures. The study reported that a Prony series expansion was practical when simulating sealant response under creep loading. Based on the linear behavior of crack sealant, verified previously, it is assumed that bituminous crack sealants behave as viscoelastic materials. Therefore, the stiffness E
( )
t of a linearly viscoelastic solid can be expressed in a normalized Prony series expansion form as follows:( )
∑
(
= − − − = K i t i i e E t E 1 0 1 1 ζ τ)
(5) where 0 E = initial modulus, iζ = normalized parameter defined as the ratio between relaxation strength and Eo, and
i
τ = relaxation time.
K is the number of terms which is related to the loading time range. Typically it is the logarithmic value of the time span. The stiffness modulus measurements from the CSBBR testing were utilized to evaluate Prony series parameters ζ and τ in Equation 5. The fitting process was conducted using a nonlinear least square analysis. Figure 12 shows fitting of the Prony series function with the measurement data for soft and stiff sealants at low temperature. These parameters were incorporated into FE model to simulate the deflection response for sealant undergoing creep loading.
1 10 100 0.1 1 10 100 1000 10000 Time (s) Sti ffn es s (MPa) Measured YY@-10 Prony YY@-10 Measured BB@-40 Prony BB@-40 Measured BB@-34 Prony BB@-34 Measured YY@-4 Prony YY@-4
Figure 12 Prony series fitting for sealants BB and YY at various testing temperatures.
Finite Element Model Description
To validate the sealant constitutive model, a
three-dimensional FE model was developed using the commercial package ABAQUS. The sealant beam model was constructed using eight-node hexahedron reduced integration elements C3D8R to generate elements. A beam dimension of 102 X 12.7 X 12.7mm was selected to match the dimensions of the experimental specimen. The
concentrated creep load was applied along the beam width at the upper middle portion, and the boundary conditions were applied at the edges of the lower end to prevent vertical and lateral movement. To validate the model, the deflection at the mid-span was noted and compared to the experimental results. A built-in viscoelastic routine was used, and the Prony series parameters were plugged in using a specific format. A quasi-static analysis was conducted during the loading and unloading testing period. Figure 13 shows the deformed beam and the shear stress distribution at 240s of loading.
Figure 13 Shear stress distribution in a deformed CSBBR specimen after loading for 240s.
As shown in Figure 14, the FE simulation confirms that the Prony series expansion successfully simulates the results of
bituminous crack sealant deformation for 240s of loading and 480s of unloading at low temperature.
0 1 2 3 4 5 6 7 0 100 200 300 400 500 600 700 800 Time (s) D eflection (mm) Measured_YY_-4 FE_YY_-4 Measured_BB_-34 FE_BB_-34 Measured_BB_-40 FE_BB_-40 Measured_YY_-10 FE_YY_-10
Figure 14 Finite element simulation using Prony series for sealants BB and YY.
Conclusion
A modified test using a bending beam rheometer (BBR) was developed and identified as a reliable method to evaluate the
rheological behavior of hot-poured bituminous crack sealants. In this test that uses the crack sealant bending beam rheometer (CSBBR), a double thickness of the standard bending beam was found to
overcome excessive deflections during testing of bituminous crack sealants. The new beam geometry had negligible effects on the resulting deflection due to shear. In addition to changes in specimen geometry and preparation procedure, a new aging procedure, a validated testing period, and a time at which stiffness is determined were introduced.
Nine different sealants, divided into two groups (soft and stiff) were tested at -40°C, -34°C, -28°C and -16°C, -10°C, and -4°C, respectively. Three performance parameters were identified to evaluate the crack sealants’ performance at low temperature: the stiffness at 240s, the average creep rate, and energy dissipation ratio. It was found that stiffness is a good criterion for identifying and distinguishing among sealants. The average creep rate also shows a good agreement with the stiffness values at 240s. The dissipated energy ratio, which is related to the material’s elastic and viscous properties, is a good indication of the sealant’s relaxation ability.
The new test was found to be repeatable and the coefficient of variation between operators is less than 4%. At this point in the research, however, a significant difference was noted between devices produced by different manufacturers.
A linearity check was successfully conducted to verify the bituminous crack sealant linear viscoelastic behavior. The Prony series parameters, determined from the relaxation data, were successfully fitted to the viscoelastic model using a built-in module in FE. Fitting parameters were then incorporated into a three-dimensional FE model of the CSBBR specimen. The resultant calculated creep deflections agreed with the measured values. It is concluded that Prony series expansion is adequate in describing the mechanical behavior of crack sealants at low temperature.
The CSBBR test is part of several testing methods have been developed as part of the ongoing research to establish performance-based guidelines for hot-poured bituminous crack sealants. Field
validation will be conducted upon the completion of the development of laboratory testing methods.
Acknowledgments
This study is based upon work supported by the Federal Highway Administration and the U.S.–Canadian Crack Sealant Consortium under pool fund award # TPF5 (045). The contribution of the participating states, industries, and provinces is greatly appreciated. The contents of this paper reflect the views of the authors, who are responsible for the facts and the accuracy of the data presented herein. The content does not necessarily reflect the official views or policies of the pool fund–participating Departments of Transportation or the Federal Highway Administration. This paper does not constitute a standard, specification, or regulation. The assistance of Amara Loulizi, Mostafa Elseifi, and Kevin McGhee is greatly appreciated.
References
1. P. Joseph (1990). “Field Evaluation of Rout and Seal Crack Treatment in Flexible Pavement,” Report PAV-90-03, Ministry of Transportation of Ontario, Downsview, ON. 2. E. Cuelho, D. R. Johnson, and R. B. Freeman (2002).
“Cost-Effectiveness of Crack Sealing Materials and Techniques for Asphalt Pavements,” Report #FHWA/MT-02-002/8127, Montana Department of Transportation, Helena, MT, 247 pp.
3. E. Cuelho, S. K. Ganeshan, D. R. Johnson, R. B. Freeman, and P. L. Schillings (2003). “Relative Performance of Crack Sealing Materials and Techniques for Asphalt Pavements,” Third International Symposium on Maintenance and Rehabilitation of Pavements and
Technological Control, July 7–10, Guimarães, Portugal, pp. 327-337.
4. C. Fang, K. A. Galal, D. R. Ward, J. E. Haddock, and T. Kuczek (2003). “Cost-Effectiveness of Joint and Crack Sealing,” paper presented at the 82nd Annual Meeting of the Transportation Research Board, National Research Council, January 12–16, Washington, D.C.
5. D. R. Ward (2001). “Evaluation of the Implementation of Hot-Pour Sealants and Equipment for Crack Sealing in Indiana,” Final Report, No. FHWA/IN/JTRP-2000/27, FHWA, Washington, DC, 189 pp.
6. G. J. Chong and W. A. Phang (1987). “Improved Preventive Maintenance: Sealing Cracks in Flexible Pavements in Cold Regions,” Report PAV-87-01. Ontario Ministry of Transportation, Downsview, ON, 31 pp. 7. G. J. Chong (1990). “Rout and Seal Cracks in Flexible
Pavements—A Cost-Effective Preventive Maintenance Procedure,” Transportation Research Record, No. 1268, pp. 8-16.
8. S. Linde (1988). “Investigations on the Cracking Behavior of Joints in Airfields and Roads: Field Investigations and Laboratory Simulation,” Swedish National Testing Institute, SP Report 1988:23, Borås, Sweden.
9. J. Chehovits and M. Manning (1984). “Materials and Methods for Sealing Cracks in Asphalt Concrete Pavements,” Transportation Research Record 990,
Transportation Research Board, Washington, D.C., pp. 21-30.
10. J-F. Masson, P. Collins, and P. P. Légaré (1999).
“Performance of Pavement Crack Sealants in Cold Urban Conditions,” Canadian Journal of Civil Engineering, Vol. 26, No. 4, pp. 395-401.
11. J-F. Masson (2000). “Bituminous Sealants for Pavement Joints and Cracks: Building the Basis for a Performance-Based Specification," In Durability of Building and Construction Sealants, A. Wolf (Ed.), RILEM, Paris, France, pp. 315-328.
12. M. C. Belangie and D. I. Anderson (1985). “Crack Sealing Methods and Materials for Flexible Pavements,” Final Report, No. FHWA-UT-85-1, 74 pp., Utah Department of Transportation, Salt Lake City, UT.
13. K. L. Smith and A. R. Romine (1999). “LTPP Pavement Maintenance Materials: SHRP Crack Treatment
Experiment,” Final Report No. FHWA-RD-99-143, FHWA, Washington, DC, 163 pp.
14. J-F. Masson and M. A. Lacasse (1999). “Considerations for a Performance-Based Specification for Bituminous Crack Sealants,” ASTM Special Technical Publication, No. STP 1348, pp. 168-181.
15. ASTM D 5329 (2004). "Standard Test Methods for Sealants and Fillers, Hot-Applied, for Joints and Cracks in Asphaltic and Portland Cement Concrete Pavements," ASTM International.
16. ASTM D 6690 (2003). "Standard Specification for Joint and Crack Sealants, Hot-Applied, for Concrete and Asphalt Pavements," ASTM International.
17. H. U. Bahia, D. A. Anderson, and D. W. Christensen (1992). “The Bending Beam Rheometer: A Simple Device for Measuring Low-Temperature Rheology of Asphalt Binders,” Journal of the Association of Asphalt Paving Technologists, Proceedings of Technical Sessions, February 24-26, Charleston, SC, Vol. 61, pp. 117-153. 18. D. A. Anderson, D. W. Christensen, H. U. Bahia, R.
Dongre, M. G. Sharma, C. E. Antle, and J. Button (1994). “Binder Characterization and Evaluation. Volume 3: Physical Characterization,” SHRP-A-369, 475 pp. 19. H. U. Bahia and D. A. Anderson (1995). “The
Development of the Bending Beam Rheometer: Basics and Critical Evaluation of the Rheometer,” ASTM Special Publication, STP 1241, pp. 28-50.
20. L. Zanzotto (1996). “Laboratory Testing of Crack Sealing Materials for Flexible Pavements,” Final Report,
Transportation Association of Canada, Ottawa, ON, 171 pp. 21. I. L. Al-Qadi, A. Loulizi, S. Aref, J-F. Masson, and K.
McGhee (2005). “Modification of Bending Beam
Rheometer Specimen for Low-Temperature Evaluation of Bituminous Crack Sealants,” Transportation Research Record 1933, Transportation Research Board, National Research Council, Washington D.C., pp. 97-106.
22. I. L. Al-Qadi, S-H. Yang, M. Elseifi, J-F. Masson, and K. McGhee (2006). “Specifications of Bituminous-Based
Crack Sealants Using Modified Bending Beam Rheometer,” paper No. 06-1882 presented at the 85th Annual Meeting of the Transportation Research Board, National Research Council, Washington, D.C.
23. M. Elseifi, S. Dessouky, I. L. Al-Qadi, and S-H. Yang (2006). “Viscoelastic Model to Describe the Mechanical Response of Bituminous Sealants at Low Temperature,” Journal of the Transportation Research Record 1958, Transportation Research Record, National Research Council, Washington, D.C., pp. 82-89.
24. M. O. Marasteanu and D. A. Anderson (2000).
“Establishing Linear Viscoelastic Conditions for Asphalt Binder,” Transportation Research Record 1728,
Transportation Research Record, National Research Council, Washington, D.C., pp. 1-6.
25. J. D. Ferry (1980). Viscoelastic Properties of Polymers, 3rd Ed., Wiley, New York, NY.
26. ASTM D 5167 (2003). "Standard Practice for Melting of Hot-Applied Joint and Crack Sealant and Filler for Evaluation," ASTM International.
27. L. S. Johansson and U. Isacsson (1998). “Effect of filler on low temperature physical hardening of bitumen,” Journal of Construction and Building Materials, Vol.12 No.8, pp. 463-470.