Publisher’s version / Version de l'éditeur:
Canadian Geotechnical Journal, 20, 1, pp. 69-81, 1983
READ THESE TERMS AND CONDITIONS CAREFULLY BEFORE USING THIS WEBSITE. https://nrc-publications.canada.ca/eng/copyright
Vous avez des questions? Nous pouvons vous aider. Pour communiquer directement avec un auteur, consultez la première page de la revue dans laquelle son article a été publié afin de trouver ses coordonnées. Si vous n’arrivez pas à les repérer, communiquez avec nous à [email protected].
Questions? Contact the NRC Publications Archive team at
[email protected]. If you wish to email the authors directly, please see the first page of the publication for their contact information.
NRC Publications Archive
Archives des publications du CNRC
This publication could be one of several versions: author’s original, accepted manuscript or the publisher’s version. / La version de cette publication peut être l’une des suivantes : la version prépublication de l’auteur, la version acceptée du manuscrit ou la version de l’éditeur.
Access and use of this website and the material on it are subject to the Terms and Conditions set forth at
The prediction of total heave on a slab-on-grade floor on regina clay
Yoshida, R. T.; Fredlund, D. G.; Hamilton, J. J.
https://publications-cnrc.canada.ca/fra/droits
L’accès à ce site Web et l’utilisation de son contenu sont assujettis aux conditions présentées dans le site LISEZ CES CONDITIONS ATTENTIVEMENT AVANT D’UTILISER CE SITE WEB.
NRC Publications Record / Notice d'Archives des publications de CNRC:
https://nrc-publications.canada.ca/eng/view/object/?id=a913e650-2ae7-46b2-b72e-207921fc841a https://publications-cnrc.canada.ca/fra/voir/objet/?id=a913e650-2ae7-46b2-b72e-207921fc841aS e r I
I
N21d
National Research
Conseil national
b
Council Canada
de recherches Canada
r n G
THE PREDICTION OF TOTAL HEAVE OF A SLAB-ON-GRADE FLOOR ON REGINA CLAY
by R.T. Yoshida, D.G. Fredland, and J.J. Hamilton
Reprinted from
Canadian Geotechnical Journal Volume 20, Number 1,1983 p. 69
-
81DBR Paper No. 1107
Division of Building Research
Reprinted from
Canadian
Geotechnical
Journal
The prediction of total heave of a slab-on-grade
floor on Regina clay
Volume 20 Number 1 0 1983
,
Pages 69-81National Research Conseil national
1
*
Council Canada de rechercher CanadaReimpression du
canadienne de
aeotechniaue
The prediction of total heave of a slab-on-grade floor on Regina clay
R. T. YOSHIDA AND D. G. FREDLUNDDepartment of Civil Engineering, University of Saskatchewan, Saskatoon, Sask., Canada S7N OW0
AND J. J. HAMILTON'
Division of Building Research, National Research Council of Canada, Saskatoon, Sask., Canada S7N OW9 Received October 16, 1981
~
Accepted September 2, 1982S veral analytical methods for the prediction of total heave of desiccated, expansive soils have been proposed for various geo raphic regions. The proposed method herein is based on a general theory for unsaturated soil. The in-situ stress conditions, as a sessed from the corrected swelling pressure and the required soil moduli, are deduced from the constant volume oedometer test.
i
Vtrification of the proposed method was accomplished using data accumulated from the m~nitoring of movements of a floor slab n a light industrial building in north-central Regina, Saskatchewan. A leak in a water line buried under the floor slab resulted in a
f ,
aximum heave of about 106 mm. Of the three final pore-water pressure distributions assumed, the one where pressure is consbnt with depth and equal to atmospheric pressure appears to be representative of the field conditions corresponding to the max'mum measured heave. The measured heave represents 89% of the predicted heave for the zero pore-water pressuret
distvbution. It is concluded that the proposed method of analysis, based upon a general theory for unsaturated soils, provides a practical method to accwately assess total heave.Plusieurs mCthodes analytiques de prkdiction du soultvement total des sols expansifs dtssCchCs ont BtC proposkes pow diffkrentes rkgions gkographiques. La mCthode proposte ici est fondCe sur une thkorie gtnCrale des sols non saturCs. Les conditions de constraintes en place, telles que dtduites de la pression de gonflement corrigke, et les modules du sol necessaires sont ddduits d'un essai oedomktrique A volume constant.
La ~Crification de la mCthode proposCe a CtC faite A partir des donnCes accumulCes 101-5 de I'obsemation d'une dalle de plancher
dans un bltiment industriel lCger dans le centre-nord du RCgina, Saskatchewan. Une fuite dans une conduite d'eau enterrCe sous cette dalle a provoquC un soultvement maximum de 106 mm. Des trois distributions finales de pression interstitielle suppodes, la pression interstitielle constante avec la profondeur et Cgale A la pression atmosphCrique semble Ctre representative des con- ditions du terrain correspondant au soultvement maximum. Le soulkement mesurC reprksente 89% du soukvement prCdit pour une distribution nulle des pressions interstitielles. On conclue que la mCthode d'analyse proposCe, fondCe sur une thCorie gCnQale pour les sols non saturCs, constitue une mCthode pratique pour Cvaluer le soukvement total de faqon prCcise.
Can. Geotech. J., 20, 69-81 (1983) [Traduit par la revue]
Introduction
The construction of buildings on unsaturated soils can result in damage from excessive volume changes in the soil. Costs associated with damage to all types of structures built on expansive soils in the United States have been estimated at $7 billion per year (Krohn and Slosson 1980). The magnitude of this problem has necessitated the development of practical engineering
'
solutions. Thus, much research has been undertaken regarding expansive soils throughout the world. The area of research most often addressed has been the prediction of total heave.
Methods for the prediction of total heave have been proposed in many parts of the world, but the empiricism upon which they have been based limits their use to specific. geographic regions. Fredlund et al. (1 980a) 'Present address: Northern Pipeline Agency Canada, Cal- gary, Alta., Canada T2P OJ4.
attempted to provide a general theoretical basis that would allow comparison among the various methods proposed. A predictive method-developed on a more theoretical basis would provide a more favourable analytical procedure.
In western Canada, as in other parts of the world, predictive methods have generally utilized the oedom- eter (i.e., the consolidation apparatus) for the identifica- tion of swelling soils (Hardy 1965; Noble 1966). The tests most commonly performed are referred to as constant volume and free swell oedometer tests. For the prediction of total heave, these methods have been considered to be more qualitative than quantitative.
This paper describes an analytical procedure for the prediction of total heave. The procedure is based on a general theory for unsaturated soils and utilizes the results of the constant volume oedometer test to repre- sent the in-situ state of stress and the relevant soil parameters for analysis. The predictive method is
0008-3674/83/010069-13$01 .00/0
70 CAN. GEOTECH. 1. VOL. 20, 1983
verified by using data collected by the Prairie Regional Station of the Division of Building Research (DBR), National Research Council of Canada, located in Saska- toon, Saskatchewan. In a program to investigate volume change problems associated with expansive soils in western Canada, the performance of the floor slab of a light industrial building in north-central Regina, Sas- katchewan. was monitored. A leak in a water line buried under the floor slab resulted in a maximum heave of about 106 rnrn. Laboratory tests on samples taken from
beneath the floor slab ~rovided data for the calculation of heave using the propbsed method for the prediction of total heave.
History of the study site
As part of a larger study of shallow foundation performance in expansive soils in the Prairies, the DBR initiated measurements of vertical slab and subsoil movements at a typical single-storey commercial build- ing in north-central Regina, Saskatchewan. The build- ing superstructure was placed on a perimeter grade beam supported by cast-in-place concrete piers. About 180 mm of gravel fill was placed to raise the grade to a suitable elevation for the floor slab and a concrete slab with a thickness of 100 mm was then placed. Construction of the building and instrumentation took place during the month of August, 1961. Instrumentation installed at the site included a deep bench-mark (DBM), vertical movement gauges, and a neutron moisture meter (NMM) access tube (Fig. 1). For the installation of the deep bench-mark, a 100-mm diameter auger boring was made which was logged visually, with four 75-mm Shelby tube samples taken at depths of 0.5,1.2,2.4, and 4.3 m from the original ground surface. At a depth of 14.6 m, the boring was halted and a deep bench-mark was lowered into the boring and pushed into the soil to refusal at a depth of 16.8 m (Bozozuk et al. 1962).
Three spiral-foot ground movement gauges (GMG) (Bozozuk 1968) were installed near the bench-mark (Fig. 1) at depths of 0.88, 1.15, and 2.69m below the design elevation of the floor slab. The ground movement gauges and bench-mark were accessed through floor clean-outs cast in the floor. A neutron moisture meter access tube was installed next to the ground movement gauges to a depth of 2.90 m; this tube allowed the use of the meter to monitor soil moisture contents adjacent to the tube without removing soil samples.
Whereas the ground movement gauges were used to measure vertical movements at specific depths, vertical movement of the floor slab surface was measured by taking level shots at a number of predetermined posi- tions on the slab. Initial level readings were made on the ground movement gauges on August 23, 1961, with initial readings on the surface of the floor slab being made on September 22,1961. Between these two dates,
GROUND GROW40 .rGROUND
NEUTRW MOVEMENT MOVEMENT MOVEMENT DEEP MOISTURE GAUGE G U GAUGE BENCH-
DEPTH MFTER 3 2 I WRM 0.88rn- I I5rn- 263rn- 2 90rn- EAST +
FIG. 1. Istrumentation at the site.
the shallow ground movement gauge indicated a heave of 6.4mm. Thus, it is assumed that the floor slab was heaved by an equal amount, and a correction has been applied to the initial floor surface level readings. Later measurements of ground movement and water content of the soil using the gauges and neutron moisture meter were made about twice a year up to 1968, with additional measurements using the vertical ground movement gauges up to 1972. Level surveys of the floor slab were made in August of 1962.
Heaving and cracking of the floor slab was first noticed by the building owner in early August, 1962. The owner also noticed an unexpected increase in water consumption of approximately 35 000 L. The loss of water was traced to a leak, in a hot-water line beneath the floor slab, which was subsequently repaired. The location of the cracking and contours of heave for the floor slab are shown in Fig. 2, with vertical ground movements indicated in Fig. 3. Changes in the water content are shown in Fig. 4 and correspond to changes measured at the location of the neutron moisture meter access tube.
The maximum amount of heave for the floor slab, as shown in Fig. 3, has been approximated because elevation readings made by others between August 22, 1961 and August 15, 1962 were found to be unreliable. The shape of the curve has been made similar to that of a plot of heave over time for another test area in Regina (Hamilton 1969). This latter test area was flooded inten- tionally and showed that heaving took place almost irnme- diately. Thus, it has been assumed that the break in the hot-water line took place in late July or early August, 1962, and that no heave other than the initial 6.4 mm had occurred until that time. It has been assumed that after August, 1962 an additional 9 mm of heave took place, an amount corresponding to vertical movement mea- sured by the shallow vertical movement gauge. Thus, it
YOSHIDA ET AL. 71
APPROXIMATE LOCATION SLAB PERIMETER OF
\OF HOT-WATER L I N E
I
CRACKING BUILDINGFIG. 2. Floor plan of study site (NMM = neutron moisture mark).
r _ _ - - - _ - - - _ _ - - - _ _ - - - MAXIMUM HEAVE OF FLOOR SLAB G M G I AT DEPTH OF O88m = GMG 2 AT DEPTH OF 1.15rn E
.
GMG 3 AT DEPTH OF 2 6 9 m W3
4 0 I 2 0 6 2 6 3 6 4 6 5 6 6 6 7 6 8 6 9 7 0 71 7 2 7 3 DATE ( MONTHS)FIG. 3. Measured ground movements (GMG = ground movement gauge).
has been estimated that the maximum heave of the floor slab was at least 106 rnrn. It appears that unmeasured quantities of products stored around the perimeter of the floor slab, as well as the loads applied by the perimeter wall, restricted the amount of heave in such a way that most of the vertical movement occurred in the lightly loaded central portion of the floor slab.
It is likely that the gravel fill under the slab facilitated the movement of -water from the plumbing trench to a larger area. A loss of 35 000 L of water can be equated to lOOrnm of water over the entire 355 m2 of floor area.
I However, most of the vertical movement took place near
the centreline of the floor in the vicinity of the water line, with the greatest distress to the floor slab indicated by cracking directly over the subfloor plumbing trench. It does not appear that complete saturation had occurred over the entire area of the floor, rather that only the area surrounding the water leak was immediately affected. Water content profiles as indicated in Fig. 41 measured using the neutron moisture meter, show a more gradual -increase over a 7-year period at a point a short distance
from the plumbing trench.
meter; GMG = ground movement gauge; DBM = deep bench-
WATER CONTENT (%) WATER CONTENT AT NMM ACCESS TUBE GRAVlMETRlC AUG. 21 /61 NMM AUG. 3 1 / 6 1 r NMM MARCH 2 6 / 6 3 * NMM JUNE 1 2 / 6 8
FIG. 4. Measured water contents (NMM = neutron moisture meter).
From these observed changes in volume and water content, sufficient information is available to evaluate a method for the prediction of total heave. As is the practice in soil mechanics for saturated soils, the proposed method relates changes in the stress state of the soil to its volume change. In order to accomplish this, the variable describing the state of stress at a point in an unsaturated soil must be known, as must the constitutive relations necessary to relate stress to deformation.
72 CAN. GEOTECH. J. VOL. 20, 1983
Theoretical aspects
The unsaturated and highly expansive soils of the Regina area are typical of lacustrine deposits. The climate is cool and semiarid. Although these soils were deposited in a saturated state, subsequent evaporation and evapotranspiration has left the water table well below the surface. Although the total stress conditions have not changed, pore-water pressures above the water table are generally less than atmospheric (or negative), resulting in desaturation, fissuring, and shrinkage of the deposit to a considerable depth. Influences such as precipitation, evapotranspiration, or freezing alter the pore-water pressure distribution with time.
The analysis of the behavior of unsaturated soils is best visualized by separately considering changes in stress due to mechanical processes and those due to variations in the water content. Although the volume change of unsaturated soils has been described in terms of effective stress, degree of saturation, or water content, these empirical relationships have been found to be difficult to utilize in a general sense. Other investigators (Aitchison 1969; Fredlund 1973; Fredlund and Morgenstern 1976, 1977) have indicated the impor- tance of relating volume change to independent stress variables.
Although various combinations of stress state vari- ables can be used to define the stress state in an unsatu- rated soil, the most satisfactory ones are u - u, and u,
-
u, where u = total stress, ua = pore-air pressure, and u, = pore-water pressure (Fredlund 1973, 1979; Fred- lund and Morgenstern 1976,1977). The use of these two stress state variables allows the separation of changes in total stress from those in pore-water pressure. The u-
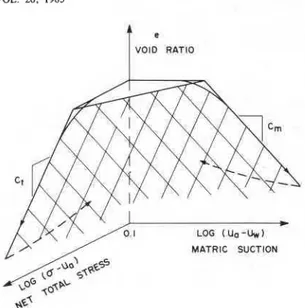
ua term is referred to as the net total stress and the ua -uw term is called the matric suction. The usefulness of these stress state variables has been experimentally verified (Fredlund 1973). Although two constitutive surfaces are necessary to fully describe the volumetric changes in an unsaturated soil, one constitutive surface relating the stress state variables to the void ratio, e, is sufficient to describe the method for the prediction of total heave. A more detailed description of the theoret- ical concepts of unsaturated soil mechanics and of the prediction of total heave can be found elsewhere (Fredlund and Morgenstern 1976; Fredlund er al.
1 9 8 0 ~ ) .
The void ratio constitutive surface (Fig. 5) can be linearized over a relatively wide range of stress if the logarithm of the stress state variables is used. The change in void ratio, Ae, is then expressed:
[l] A e = C , l o g ( u
-
ua)f+
C, log (ua - uw)f ( u-
u.)o (ua - uw)o where C, = compressive index with respect to net totalVOID RATIO
i
'
Ct
\ / ' / ' \
.
MATRIC SUCTION
FIG. 5. Logarithm of stress state variables versus void ratio. stress, C, = compressive index with respect to matric suction, the f subscript indicates final conditions, and the 0 subscript indicates initial conditions.
If the soil profile is divided into n layers of finite thickness, hi, then for the ith layer the heave, Ahi, is:
where eo = initial void ratio.
The total heave, Ah, is then expressed as:
Since the final degree of saturation will approach 100% (Fredlund 1979), the change in water content, Aw, and therefore the final water content can be calcu- lated, where:
[4] Aw = SfAe/G,
+
eoAS/G,and
Sf
= final degree of saturation, AS = change indegree of saturation, and G, = specific gravity of the soil.
For each layer considered in the analysis, the appro- priate moduli must be known, as must the initial and final net total stress and matric suction.
Initial stress boundary conditions
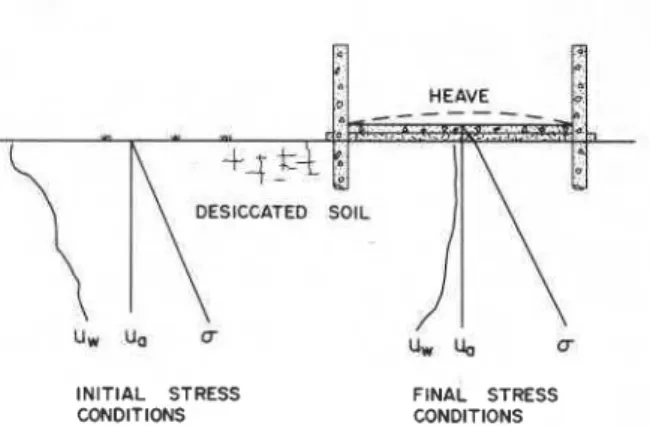
Of particular interest and concern in establishing the initial stress boundary conditions for an unsaturated soil is the matric suction profile. If the pore-air pressure is assumed initially to be in equilibrium and equal to atmospheric pressure, then the distribution of pore- water pressure is equivalent to the matric suction distribution. The initial stress boundary conditions will vary, depending upon the changes in the environment
YOSHIDA ET AL. 73 that have taken place over several decades or centuries.
m
fl
For a cumulative moisture depletion, pore-water pres-sures will be negative relative to atmospheric pressure. Therefore, the matric suction will be high and the propensity for swelling accompanying an influx of moisture will be large.
The distribution of matric suction can be established in a number of ways, including the use of psychrom- eters, axis-translation matric suction methods, and oedometer tests on undisturbed soil samples. The
method of analysis proposed herein makes use of a INITIAL STRESS FINAL STRESS
constant volume oedometer test on undisturbed sam- CONDITIONS CONDITIONS ples. Although this method does not directly evaluate
the in-situ matric suction. an eauivalent matric suction is FIG. 6. Initial and final boundary stress conditions. measured. This is On the net stress plane, but volume oedometer test to evaluate the rebound modulus
can be used for the calculation of total heave since the ,d to infer the in+itu stress state. B~ making use of the measured modulus is On the net total Stress plane as well. oedometer test data, the proposed method of analysis The details of the Constant V O ~ oedometer test are utilizes equipment and techniques readily available in U ~ ~
discussed further in a later section. soil mechanics laboratories.
Final stress boundary conditions
The final stress boundary conditions, like the initial stress boundary conditions, are generally controlled by environmental factors such as geography, climate, and land use. As is the case for the initial stress boundary conditions, air pressure is assumed to be atmospheric or zero gauge and the net total stress can be determined by considering the depth of overburden, the soil density, and the applied loads.
In general, one of the three following assumptions is used regarding the final pore-water pressures (Fredlund 1979).
(i) The water table will rise to some elevation near or at the soil surface. Thus, a hydrostatic pore-water pressure distribution will result. This assumption will give the highest prediction of heave.
(ii) Pore-water pressure is constant and atmospheric or zero gauge with depth. Although this profile is an unsteady state boundary condition, it could result if water has been made available from the soil surface.
(iii) The pore-water pressure profile is slightly nega- tive. Such a distribution would be related to the soil type and climatic conditions imposed by the building placed on the ground surface.
Predictions of heave using any one of these three assumptions generally do not differ appreciably from predictions using any other of the assumptions (Fred- lund et al. 1980a) because most of the heave occurs in the uppermost layers of the soil where the soil modulus is highest and the change in the matric suction is the largest. Figure 6 illustrates both the initial and final boundary conditions.
Proposed method of analysis
The proposed method of analysis utilizes the constant
Heaving of an expansive unsaturated soil is equiva- lent to the rebound that is experienced due to the unloading of a saturated soil. On the three-dimensional void ratio constitutive surface, the rebound surface is unique (Fig. 7). Thus, starting at the initial void ratio, eo, at the in-situ stress state defined by the net total stress, ( a
-
u,)~, and the matric suction, (u,-
u,)~, the field swelling follows the stress path to ef, the final void ratio corresponding to the stress state represented by the net total stress, (o-
u,)f, which equals the initial net total stress, ( a-
u,)~, and the matric suction, (u,-
u,)~, which is equal to zero.
Knowledge of the rebound modulus with respect to a change in the matric suction, u, - u,, in conjunction with the initial in-situ stress state allows the calculation of total heave. However, the evaluation of these
FINAL STRESS ACTUAL STRESS PATH CON0 l T IONS
FINAL STRESS ACTUAL STRESS PATH
/REB~UFID CURVE
I
FIG. 7. Comparison of the actual stress path and the stress path used in the analysis.
74 CAN. GEOTECH. J. VOL. 20. 1983 quantities is not easy. In order to simplify the analysis,
the proposed method uses an alternative stress path. Because the constitutive surface is unique for mono- tonic stress changes, between the initial-and the final stress states there is an infinite number of possible stress paths. The path followed in the proposed method of analysis (Fig. 7) first proceeds along the constitutive surface at a constant volume as the matric suction decreases and the net total stress increases. When the matric suction becomes zero the net total stress plane is reached and there can be no further increase in the net total stress without a decrease in volume. The net total stress at this point is commonly referred to as the swelling pressure.
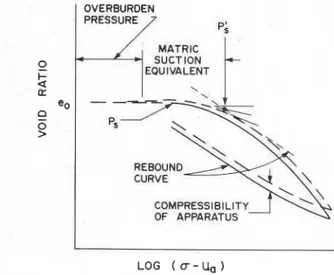
The swelling pressure is not actually a characteristic or a property of the unsaturated soil, but is an indicator of the in-situ stress state. The components of the swelling pressure are the overburden pressure and the matric suction equivalent (Fig. 8). The matric suction equivalent is not equal to the in-situ matric suction but, as the equivalent matric suction is reduced to zero and the soil is allowed to swell, the subsequent rebound to the overburden pressure corresponds to the rebound due to the reduction in the matric suction. Thus, the stress path for the analysis is complete (Fig. 7).
Invariably, there is some disturbance of the soil as a result of sampling (Fig. 9). If no volume change due to sampling is assumed with the overburden pressure removed, the state of stress in the sample is largely unknown. If the sample is loaded to the overburden pressure in the oedometer, flooded with water, and allowed to swell freely as in the free-swell oedometer test, the resulting heave would be less than the actual field swelling, due to sample disturbance (Fredlund et al. 1980~). A suitable correction to the matric suction to compensate for sampling disturbance was proposed by Fredlund et al. (1980~).
In the constant volume oedometer test, the point at which no further swelling takes place may be much less than the actual swelling pressure (Fig. 10). A procedure that is a correction for sample disturbance is used to evaluate the actual or corrected swelling pressure. The procedure is similar to that used to evaluate the preconsolidation pressure of a saturated soil. The correction, shown in Fig. 10, is a modified form of the Casagrande construction (Leonards 1962).
To evaluate the corrected swelling pressure, the point of maximum curvature of the curve of void ratio versus logarithm of total pressure is located. The point can readily be found immediately past the uncorrected swelling pressure. From this point, horizontal and tangential lines are drawn and the angle formed is bisected. The intersection of a line parallel to the rebound portion of the curve and the bisector indicates the corrected swelling pressure. It is noted that no
e
SWELLING PRESSURE
1 ( Ua -Uw )field
FIG. 8. Ideal interpretation of sampling and constant volume oedometer test.
SAMPLING
/
IN-SITU STRESS
FIG. 9. Actual stress path during sampling and constant volume oedometer test (assume no volume change during sampling).
correction is required for the rebound modulus because it is not altered significantly by the stress level or sample disturbance (Schmertmann 1955).
For the soil profile being analyzed, several samples from varying depths are required to properly define the initial void ratio, the initial state of stress represented by the corrected swelling pressure, and the rebound modulus. Next, the final stress conditions must be determined.
The final stress state is determined by calculating the overburden pressure, any surcharges that may be applied, and the final pore-water pressure distribution. In order to simplify the analysis, it is assumed that a surcharge causes a constant increase in total stress with an increase
YOSHIDA ET AL. 75
OVERBURDEN
COMF'RESSI BILCTY OF APPbRATUS
LOG ( r - U a )
FIG. 10. Construction to compensate for sample disturbance.
in depth. Also, any hysteretic effects due to unloading from the removal of overburden and due to loading from a surcharge are neglected. However, these hysteretic effects could be taken into account by using appropriate compressive indices. Final pore-water pressures assumed for the analysis are subtracted from the total stress.
Analysis
The engineering properties of the highly plastic, expansive proglacial lake sediments upon which the city of Regina, Saskatchewan is built have been well- documented (Fredlund and Hasan 1979; Fredlund et al. 1980b). The statistical analysis of data accumulated from numerous boreholes advanced in the Regina area indicates that the sediments are relatively uniform. For
the study site being considered, laboratory analyses were performed on samples from the borehole made in August, 1961 for the installation of the deep bench- mark. The tests evaluated the Atterberg limits, water contents in-situ, grain-size distribution, swelling indices, and in-situ stress state as represented by the corrected swelling pressure. Figure 11 indicates the results of index tests on the samples taken. On the average, the liquid limit was found to be 77%, with a plastic limit of 33% and an average water content of 29%.
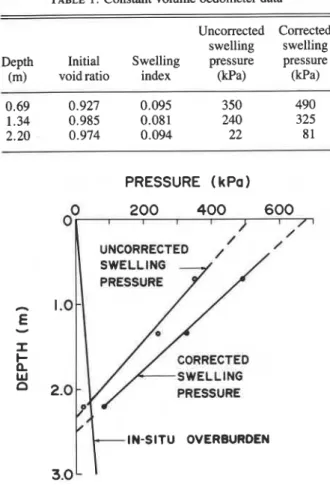
Constant volume oedometer tests on three samples were used to evaluate the initial void ratios, the swelling indices, and the corrected swelling pressures. Although there was some variation in the initial void ratio and the swelling index (Table l ) , average values of 0.962 for the initial void ratio and 0.090 for the swelling index will be used in the analyses. The distribution of the corrected swelling pressure with depth is shown in Fig. 12. A straight line can be used to represent the apparent distribution of the corrected swelling pressure with depth for purposes of analysis.
Other considerations for the analyses are as follows. 1. The thickness of the layers used is 0.3 m; eight layers are considered. The lower boundary is the point where the initial stress state is equal to the final stress state, a point at which there is no apparent tendency for swelling. This lower boundary may also be selected on the basis of the lowest depth to which changes in matric suction may be expected to take place.
2. A change in total stress equal to 5.76kPa is
applied. This surcharge is made up of 180- of fill
with a unit weight of 18.88 kN/m3 and 100 mm of concrete with a unit weight of 23.60kN/m3. The analyses will examine a central portion of the slab
>
ka
DEPTH
SOIL
ATTERBERG LIMITS
(%I
Jw
-
( m )
PROFILE 0
2 0
4 0
60 80ae
8
0 -0.2 m DARK BROWN ' I I CH-WP. FILL I H 0.2-
1.8 m GREY., .
I BROWN. CH+
WP ROOTS *. I3
-::
1.8-
8 . 8 rn BROWN CLAY CH+
W P STIFF#-I
ML t WP SOFT WATER CONTENT-
PLASTIC LIMIT 4 LIQUID LIMITI
FIG. 1 1 . Soil profile at the study site.76 CAN. GEOTECH. J. VOL. 20. 1983
TABLE 1 . Constant volume oedometer data
Uncorrected Corrected swelling swelling Depth Initial Swelling pressure pressure (m) voidratio index &Pa) (kPa)
PRESSURE ( kPa
oo
1 200 1 I 400 r 600 I / r / UNCORRECTED,
/ / PRESSURE.'
-
IN-SITU OVERBURDEN 3.0-
FIG. 12. Distribution of swelling pressure with depth.
known to be essentially unloaded. Although loads were placed at the perimeter of the floor slab, their magni- tudes are not accurately known.
3. The specific gravity for the soil profile is 2.82. 4. The unit weight for the soil profile is 18.88 kN/m3. 5. The final degree of saturation is 100%.
6. The initial and final air pressure is assumed to be 0 kPa gauge.
In general, the final stress state, FST, can be expressed as:
FST = OB
+
Au-
u,where OB = overburden pressure, Au = change in total stress, and u, = final pore-water pressure, all expressed in kPa.
The change in void ratio, Ae, for the ith layer is found using a reformulation of [ l ] that is consistent with the stress path used for the analysis. Since this stress path is in the net total stress plane, the change in void ratio can be written as follows.
FST
[ 5 ] Ae =
-
C , log-
IST
where C, = swelling index and IST = initial stress state represented by the corrected swelling pressure.
The swelling index, C,, is the slope of the rebound curve when the constant volume oedometer test results are plotted on semilogarithmic paper. The change in thickness, Ahi, for the ith layer is computed using [2] and the appropriate initial void ratio, eo. Equation [3] is used to calculate the total heave.
Since the initial water content profile has been established (see Fig. 4), the initial degree of saturation can also be calculated. Assuming a final degree of saturation, the change in water content for each laye* and hence the final water content can be calculated by using the change in void ratio, Ae, the initial void ratio, eo, and [4]. The final water contents can then be compared with those measured using the neutron mois- ture meter.
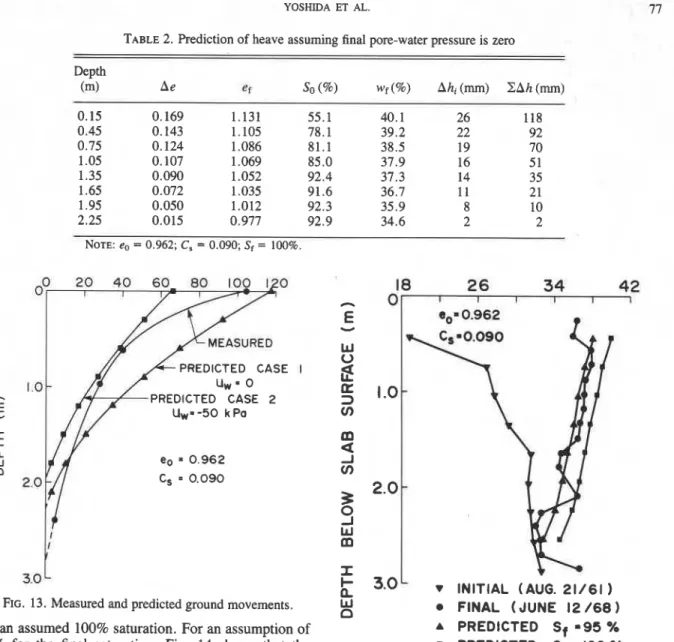
Case 1: $final pore-water pressure equal to zero Assuming that the final pore-water pressure increases from a negative value to zero results in a calculated heave of 118 mm (Table 2). Figure 13 indicates the measured and predicted heave. However, the agreement between the predicted and measured heave at different depths is not completely satisfactory. A variation in the initial void ratio from 0.920 to 1.000 results in a change of less than rt2% in the calculated total heave. Thus it appears that, within the range of initial void ratios measured in the laboratory, relatively insignificant error results. For forther analyses, an initial void ratio of 0.962 will be used.
Values of the swelling index for Regina clay based on a statistical study of the entire lake basin (Fredlund et al. 1980b) are somewhat lower than those found at this study site. The statistical study showed a mean value of 0.062 and the 95% significance limits were about 0.024-0.097 at an average depth of 3.3 m in Regina clay .The standard deviation reported is iz0.015. The relative consistency of the values for the swelling index evaluated for this paper are deemed sufficient to place confidence in their use in the analyses. At the site under consideration, the mean value is 0.090, with a standard deviation of 20.006.
A variation in the swelling index affects the calculated heave in direct proportion to the magnitude of the variation. Therefore, for one standard deviation change from C, equal to 0.090, there will be a change in the predicted heave equal to 27%. This results in a range of total heave from 110 to 125 mm. The predicted heave using the uncorrected swelling pressure to represent the in-situ stress state as shown in Fig. 13 and Table 1 is 100rnrn. This prediction is about 15% lower than that using the corrected swelling pressure.
A comparison between the calculated final water content and the measured values shows good agreement
YOSHIDA ET AL. 77 TABLE 2. bediction of heave assuming final pore-water pressure is zero
Depth (m) A e er So
(%I
wf(%) Ahi (mm) Z A h (mm) 0.15 0.169 1.131 55.1 40.1 26 118 0.45 0.143 1.105 78.1 39.2 22 92 0.75 0.124 1.086 81.1 38.5 19 70 1.05 0.107 1.069 85.0 37.9 16 51 1.35 0.090 1.052 92.4 37.3 14 35 1.65 0.072 1.035 91.6 36.7 11 2 1 1.95 0.050 1.012 92.3 35.9 8 10 2.25 0.015 0.977 92.9 34.6 2 2 NOTE: eo = 0.962; C. = 0.090; Sf = 100%. PREDICTED CASE 2 U w = - 5 0 k Pa eo = 0 . 9 6 2 Cs = 0 . 0 9 0FIG. 13. Measured and predicted ground movements.
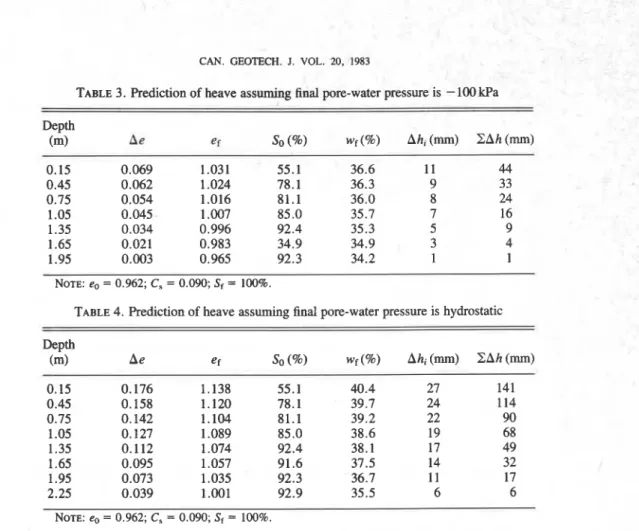
for an assumed 100% saturation. For an assumption of 95% for the final saturation, Fig. 14 shows that the calculated final water content decreases by 2%. The change in the calculated final water content for the variation in the initial void ratio assumed is less than
+
1.5%. For a change in the swelling index of +7%, the resulting variation in the water content is less than+
1 %.Case 2: jnal pore-water pressure is negative
A negative final pore-water pressure represents a possible long-term net loss of moisture from the site. For a final pore-water pressure of
-
100 kPa the predicted total heave is 44mm. When the final pore-water pressure is increased to -50 kPa the predicted heave increases to 66 mm. Results of the calculations for a final pore-water pressure of-
100 kPa are shown in Table 3.h v INITIAL (AUG. 21/61
iz
0 FINAL (JUNE 1 2 / 6 8 )
A PREDICTED St 195 %
8 PREDICTED St 100
FIG. 14. Measured and predicted water contents.
the surface resulting in a hydrostatic pore-water pressure dismbution. In such a case, the heave that takes place can be considered to be composed of a portion where the pore-water pressure increases from a negative value to zero, and a portion that results from a rebound on the net total stress plane due to a decrease in the effective stress. In the analysis, the modulus used to calculate the latter portion is equal to the swelling index, which has been measured on the net total stress plane. For this case the predicted heave amounts to 141 mm. The results of the calculations are shown in Table 4.
Case 3 : j n a l pore-water pressure is hydrostatic Discussion
The upper limit for a prediction of total heave is It appears from the analyses that, of the several represented by the case in which the water table rises to components required for calculations, the evaluation of
78 CAN. GEOTECH. J. VOL. 20, 1983
TABLE 3. bediction of heave assuming final pore-water pressure is - 100 kPa
Depth (m) b e er So
(%I
w ( % Ah, (mm) C A h (m) 0.15 0.069 1.031 55.1 36.6 1 1 44 0.45 0.062 1.024 78.1 36.3 9 33 0.75 0.054 1.016 81.1 36.0 8 24 1.05 0.045 1.007 85 .O 35.7 7 16 1.35 0.034 0.996 92.4 35.3 5 9 1.65 0.021 0.983 34.9 34.9 3 4 1.95 0.003 0.965 92.3 34.2 1 1 NOTE: eo = 0.962; C, = 0.090; Sf = 100%.TABLE 4. Prediction of heave assuming final pore-water pressure is hydrostatic
the swelling index and the in-situ stress state, as represented by the corrected swelling pressure, are the most important for accurate predictions. Reasonable errors could be tolerated in the initial void ratio without affecting the prediction of total heave substantially. However, errors in the evaluation of the swelling index will affect the prediction of total heave in direct proportion to the error. Errors in the evaluation of the corrected swelling pressure can also affect the analysis substantially. Without corrections for the disturbance of the sample and compression of the equipment, predicted quantities of heave will be low.
It is obvious that the assumption used to define the final pore-water pressure conditions will affect the prediction of total heave (Table 5). When dealing with
TABLE 5. Summary of the prediction of heave
Final pore-water Predicted total
pressure heave (mm) -100kPa 44 -50 kPa 66 0 kPa 118 Hydrostatic 141 NOTE: eo = 0.962; C, = 0.090.
volume changes in an unsaturated, expansive soil, it is apparent that the physical environment is a major factor. The definition of the equilibrium state must reflect the temperature, relative humidity, and wind and precipita- tion conditions in the area. The natural environment of the upper soil profile is dynamic with changes in the thermal and moisture conditions occurring diurnally, seasonally, and over several years. Furthermore, this dynamic environment is usually significantly altered by the activities of man. Therefore, an equilibrium pore- water pressure distribution must at best be considered as a range of the expected environmental conditions determined for each individual site.
For the case study presented here, it is concluded that the maximum heave that took place near the centreline of the floor slab (Fig. 2) corresponds to a final pore-water pressure distribution that is constant with depth and approaching zero (Fig. 13). However, Fig. 13 seems to indicate that in the vicinity of the ground movement gauges the final pore-water pressure was slightly negative and approximately equal to -50 kPa. From Fig. 2, the estimated heave in the vicinity of the ground movement gauges is approximately 50-60 mm, agreeing reasonably well with the calculated heave. However, for a final pore-water pressure distribution that is constant with depth and approaching zero, and an assumed increase in total stress equal to approximately
YOSHIDA ET AL. 79
75 kPa, a heave of 60 mm is calculated. Thus, a reduced quantity of heave away from the central area of the floor slab may be due to the effect of perimeter loads on the floor slab.
Conclusions
1. The proposed method of analysis based upon a general theory for unsaturated soils provides a practical method to accurately assess total heave. The maximum measured heave (i.e., 106mm) represents 89% of the 118 mm of heave predicted for an assumed final pore- water pressure that is constant with depth and equal to zero.
2. It is important, in the evaluation of the in-situ stress state represented by the corrected swelling pressure and the swelling indices, that corrections be made to account for sample disturbance and the compressibility of the apparatus. The empirical procedure proposed appears to compensate for this disturbance to give a reliable indication of the initial in-situ stress state.
3. Assumptions regarding the final pore-water pres- sure distribution will depend upon the environmental conditions encountered at the site. For the limited flooding situation encountered, an assumed final pore- water pressure that is constant with depth and equal to zero seems adequate for a prediction of the maximum heave.
4. The general theory for unsaturated soil behavior provides a good framework for the prediction of total heave in expansive soils. This behavior can be related to independent changes due to mechanical processes and changes in matric suction. Further case history studies would be beneficial.
Acknowledgements
I Funding for this paper was made available through a
,
Technology Transfer Contract No. 080-0 18 10-061 2.This was an agreement between the Program for
i
Industry/Laboratory Projects (PILP) of the National, Research Council of Canada, the Canadian Geotech-
nical Society, and the University of Saskatchewan. Laboratory testing and field data collection was performed by the staff and summer assistants of the Prairie Regional Station of the Division of Building Research, National Research Council of Canada, Saska- AITCHISON, G. D. 1969. A statement of the problems the
engineer faces with expansive soils. Proceedings, 2nd International Research and Engineering Conference on Expansive Clay Soils, Texas A & M University, College Station, pp. 33-51.
Bozozu~, M. 1968. The spiral foot settlement gauge. Canadian Geotechnical Journal, 5, pp. 123-125.
Bozozu~, M., JOHNSTON, G. H., and HAMILTON, J. J. 1962. Deep bench marks in clay and permafrost areas. In Field
testing of soils. ASTM Special Technical Publication No. 322, pp. 265-279.
FREDLUND, D. G. 1969. Consolidometer test procedural factors affecting swell properties. Proceedings, 2nd Interna- tional Conference on Expansive Clay Soils, Texas A & M University, College Station, pp. 435-456.
1973. Volume change behavior of unsaturated soils. Ph.D. dissertation, University of Alberta, Edmonton, Alta. 1979. 2nd Canadian Geotechnical Colloquium: Ap- propriate concepts and technology for unsaturated soils. Canadian Geotechnical Journal, 16, pp. 121 - 139.
FREDLUND, D. G., and HASAN, J. U. 1979.One-dimensional consolidation theory: Unsaturated soils. Canadian Geotech- nical Journal, 16, pp. 521-531.
FREDLUND, D. G., and MORGENSTERN, N. R. 1976. Constitu- tive relations for volume change in unsaturated soils. Canadian Geotechnical Journal, 13, pp. 261 -276.
1977. Stress state variables for unsaturated soils. Journal of the Geotechnical Engineering Division, ASCE, 103(GT75), pp. 447-466.
FREDLUND, D. G., HASAN, J. U., and FILSON, H. L. 1 9 8 0 ~ . The prediction of total heave. Proceedings, 4th International Conference on Expansive Soils, Denver, pp. 1- 17.
FREDLUND, D. G., KRAHN, J., and HASAN, J. U. 19806. Variability of an expansive clay deposit. Proceedings, 4th International Conference on Expansive Soils, Denver, pp. 322-338.
HAMILTON, J. J. 1969. Effects of environment on the performance of shallow foundations. Canadian Geotech- nical Journal, 6, pp. 65-80.
HARDY, R. M. 1965. Identification and performance of swelling soil types. Canadian Geotechnical Journal, 11, pp. 141-153.
KROHN, J. P., and SLOSSON, J. E. 1980. Assessment of expansive soils in the United States. Proceedings, 4th International Conference on Expansive Soils, Denver, pp. 596-608.
LEONARDS, G. A. 1962. Foundation engineering. McGraw- Hill Book Co. Inc., New York, NY, pp. 148-155.
NOBLE, C. A. 1966. Swelling measurements and prediction of heave for a lacustrine clay. Canadian Geotechnical Journal, 3, pp. 32-41.
SCHMERTMANN, J. H. 1955. The undisturbed consolidation behavior of clay. Transactions of the American Society of Civil Engineers, 120, pp. 1201- 1227.
Appendix
This appendix describes in detail the procedure for computing total heave.
Field sampling
Field sampling consists of taking suitable undisturbed samples from the upper 4 m or more of the site. The sampling depth will depend upon several factors. These include the depth at which the soil has been desiccated as well as the depth to which moisture flow can be expected.
The depth to which there has been desiccation will determine the depth to which volume change can be a
80 CAN. GEOTECH. J. VOL. 20, 1983 problem. However, if within reasonable environmental
conditions moisture flow is not expected to penetrate past an assumed depth, the determination of the in-situ stresses below this depth is not critical. The final boundary conditions are up to the discretion of the engineer.
Sufficient samples should be obtained to properly characterize the distribution of the swelling index and the in-situ stress state within the expansive clay portion of a profile.
Evaluation of in-situ parameters
Suitable samples are trimmed and placed in the oedometer apparatus. A load equivalent to the in-situ overburden pressure is placed on the sample and an initial dial gauge reading is taken. The sample is then immersed in distilled water. Additional loads are added to counteract the tendency for the sample to swell. When this tendency ceases, loads are applied using conven- tional increments to properly define the swelling pres- sure. The maximum load should be at least two load increments (logarithmic scale) beyond the swelling pressure. The sample is then unloaded in suitable increments to the token load.
Interpretation of the oedometer data
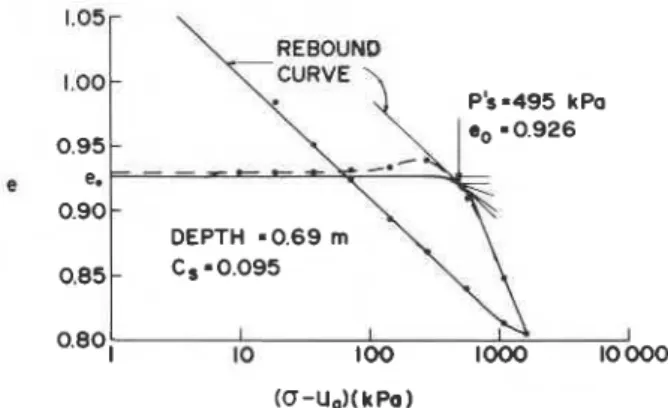
The data accumulated from the oedometer tests are plotted as void ratio versus logarithm of pressure. It is important to apply corrections for the compressibility of the apparatus (Fredlund 1969). By examining the plot of void ratio versus logarithm of pressure shown in Fig. A l , the corrected swelling pressure can be determined as follows.
1. The curve of void ratio versus logarithm of pressure is first corrected for the compressibility of the apparatus. The corrected curve will show a slight upward bulge in the vicinity of the swelling pressure. A corrected void ratio versus pressure curve should be sketched by drawing a line, from the initial void ratio, that is horizontal at first and then curves downward and joins
P's =495 kPa 0.95 -
DEPTH = 0.69 m 0.85
-
Cs -0.095FIG. A l . Example problem to illustrate the determination
of the corrected swelling pressure.
the recompression curve which has been corrected for apparatus compressibility.
2. The point of maximum curvature is located at the point where the void ratio versus pressure curve bends downward onto the recompression curve.
3. At the point of maximum curvature, a horizontal line and a tangent are drawn. The corrected swelling pressure is then found at the intersection of the bisector of the angle formed by these lines and a line tangent to the curve and parallel to the rebound portion of the curve.
Calculation of total heave
For the calculation of total heave, the following equations are used:
FST [All Ae=-C,log-
IST
where Ae = change in void ratio, C, = swelling index, FST = final stress state accounting for overburden pres- ' sure, surcharge, and final pore-water pressure (kPa), and IST = initial stress state represented by the corrected swelling pressure (@a).
where Ahi = change in thickness of the ith layer, hi = thickness of the ith layer, and eo = initial void ratio.
n
[A31 A h = C A h i
i = l
where n = number of layers.
To calculate the final water contents, the change in water content, Aw, is computed as:
[A41 Aw = SfAe/G,
+
eoAS/G,where Sf = final assumed degree of saturation, G, =
specific gravity, and AS = change in degree of satura- tion.
Example problem
The predicted total heave is calculated in detail using data from the study site presented in this paper.
1. The initial void ratio eo = 0.962.
2. The initial water content distribution is shown in Fig. 4.
3. The corrected swelling pressure can be represented by a best-fit line (Fig. 13).
4. The swelling index used is C, = 0.090. 5. The surcharge is 5.76 kPa.
6. The analysis will consider eight layers, each 0.3 rn thick.
7. The specific gravity G, = 2.82.
YOSHIDA ET AL. 81
9. The final pore-water pressure distribution assumed is equal to zero.
10. The overburden is assumed to have a density of 1.92 kg/m3.
11. The pore-air pressure u, = 0.0 kPa (i.e., atmo-
spheric).
The results of the calculations are shown in Table 2. For the first layer, the depth to the centre of the layer from the original ground surface is 0.15 m.
Therefore,
FST = OB
+
Au-
u,= (0.15)(1.92)(9.81)
+
5.76 - 0.0= 8.59 kPa
From Fig. 12, at a depth of 0.15 m the initial stress state represented by the corrected swelling pressure is 640.8 kPa. Therefore, using [All,
and using [A2],
To calculate the final water content, the initial water content must be known. In Fig. 4, a depth of 0.15
m
below the original ground surface corresponds to a depth of 0.43 m, which accounts for the thickness of slab and fill. The initial water content, wo, is 18.8%. The initial degree of saturation, So, is:
Using [A41,
Aw = (1.0)(0.1685)/2.82