HAL Id: halshs-01524462
https://halshs.archives-ouvertes.fr/halshs-01524462
Submitted on 18 May 2017
HAL is a multi-disciplinary open access archive for the deposit and dissemination of sci-entific research documents, whether they are pub-lished or not. The documents may come from teaching and research institutions in France or abroad, or from public or private research centers.
L’archive ouverte pluridisciplinaire HAL, est destinée au dépôt et à la diffusion de documents scientifiques de niveau recherche, publiés ou non, émanant des établissements d’enseignement et de recherche français ou étrangers, des laboratoires publics ou privés.
Revisiting Finance and Growth in Transition Economies
- A Panel Causality Approach
Michael Stemmer
To cite this version:
Michael Stemmer. Revisiting Finance and Growth in Transition Economies - A Panel Causality Approach. 2017. �halshs-01524462�
Documents de Travail du
Centre d’Economie de la Sorbonne
Revisiting Finance and Growth in Transition Economies -
A Panel Causality Approach
Michael A. S
TEMMERRevisiting Finance and Growth in Transition Economies
-A Panel Causality -Approach
∗Michael A. Stemmer† May 9, 2017
Abstract
This article provides new evidence on the relationship between financial develop-ment and economic growth in 15 Eastern European countries between 1994 and 2014. The analysis employs a panel Granger causality framework that is based on seemingly unrelated regression systems and Wald tests with country-specific bootstrap critical values. By relying on several financial development indicators, we find that finance primarily follows GDP per capita in transition economies, supporting a demand-driven hypothesis. In contrast, financial development in the form of financial monetization and credit extension exerts in the majority of countries a negative impact on economic growth. Moreover, a strong foreign bank presence seems to positively impact growth, presumably driven by more efficiency and prudential lending behavior.
Keywords: Economic growth, financial development, transition countries, granger causal-ity, bootstrap
JEL Classification: F43, O10, O11
∗
I am grateful to Jean-Claude Berthélemy, Robert C. M. Beyer, Max Breitenlechner, and Mathilde Maurel for their highly valuable comments.
1
Introduction
Since the seminal work of King and Levine (1993a) and Levine (1997), the relationship between financial development and economic growth has been a hotly debated topic. Arguments have either been turning around a chicken and egg question of which side is precipitating the other, whether financial development is beneficial for economic growth at all and if so, to what extent.
Assessments of the relation between finance and growth often come in the form of panel data analysis covering either very large panels of both advanced and emerging countries (see e.g. Beck et al. (2014), or focus on particular regions (Yu et al. (2012); Hassan et al. (2011)). Generally, in cross-country studies the “finance-led growth” hypothesis, where
financial development exerts mainly a positive causal impact on real output, has more profoundly resonated in research, especially with regard to banking sector development (Beck et al. (2000b); Calderon and Liu (2003); Christopoulos and Tsionas (2004); Loayza
and Rancière (2006); Bangake and Eggoh (2011)).1
However, these mainstream results have been challanged and the beneficial impact of financial development has been found to be subject to several limitations with respect to country characteristics. Rioja and Valev (2004), for example, report positive effects for countries with more developed financial systems and uncertain effects for countries with low-level financial development. In a different study Masten et al. (2008) claim positive growth effects for less financially developed countries that vanish beyond a certain threshold. In an ealier study on Latin America, de Gregorio and Guidotti (1995) identify weak regulatory systems that prevent the region from reaping positive growth effects of financial sector development.
Against this backdrop, the Eastern European economies deserve renewed attention and are for several reasons particularly appealing for a study on finance and growth. They entered the transition from centrally planned to market-based economies with very low levels of financial development, have since then shown diverging pace in the development process and built up a strong dominance of foreign banks in the market. At the same time complementary capital markets are to a large extent underdeveloped and regulatory systems widely considered to still remain in poor shape. Besides, given the countries’ emergence from central planning not so long ago, the amount of literature covering the finance-growth relationship for this region is rather sparse with often contradictory or
1Patrick (1966), being among the first examining these issues, coined the terms “supply-leading” and
“demand-following” of financial development with respect to income per capita. His directional terms are based on the hypotheses that either financial development precedes economic growth or that growth creates demand for financial intermediation, thus exerting a potential two-way causality.
inconsistent results.2
This study provides a new attempt to disentangle the finance and growth nexus for a total of 15 Eastern European transition countries over a sample period spanning a time frame from 1994 to 2014. For this purpose we rely on a recently developed causality approach by conducting panel Granger causality tests following Konya (2006). This approach is based on Seemingly Unrelated Regressions (SUR) and Wald tests with country specific bootstrap critical values. The use of this methodology for the transition country sample bares a couple of advantages. Since it is a system approach, it can account for parameter slope heterogeneity and cross-sectional dependence. Therefore, it allows testing for Granger causality for each country individually and exploits at the same time the advantages that come from richer panel datasets. By exploiting the spatial information from the panel data setting, this econometric approach allows for detecting for how many and for which transition countries there exists in the Granger sense a one-way causality, two-way causality or no causality at all.
This paper adds to the finance and growth literature in several ways. To our knowledge it is the first study that employs a panel Granger causality method accounting for differences across countries and cross-country correlations on the transition economies. Compared to other pooled panel data methods, the employed method enables us to attach results to each individual country in the sample instead of country groups or regions. With the exception of Cojocaru et al. (2015), it also analyses a broader transition country set than in many previous studies. Moreover, apart from assessing financial development across several dimensions, we also include variables to proxy for the large cross-border exposure of the banking sectors. Given the length of the data series used, we are also able to indirectly account for a potential impact of the recent Global Financial Crisis and the European debt crisis on the finance-growth relationship. Additionally, we link our study to recent results on a non-monotonic relationship between financial development and economic growth. The rest of the paper is structured as follows. Section 2 briefly reviews the theory of financial development and growth and links it to key literature in general and for transition countries in particular. Section 3 explains the methodology and Section 4 the data used in more detail. Results are presented in Section 5 while Section 6 concludes.
2In very recent studies, Caporale et al. (2015) find an insignificant impact of financial development,
proxied by credit to GDP ratios and liquid liabilities, on economic growth for transition countires; in contrast, Cojocaru et al. (2015) provide evidence for a positive stimulus of finance on growth.
2
A Brief Account of Literature on Financial Development and
Growth
According to conventional economic theory, financial development is considered to posi-tively influence economic growth (Pagano (1993)). Financial systems, often in the form of financial intermediaries such as banks or stock markets, help to overcome market frictions in the form of informational asymmetries and transaction costs ultimately spurring growth. Levine (1997) identifies five key functions through which this is achieved: (i) the efficient allocation of resources, which increases the social marginal productivity of capital, (ii) the diversification and hedging of risk, (iii) the mobilization of savings, (iv) exertion of corporate control, and a general (v) facilitation of the exchange of goods and services. Although all functions may be considered seperately, they cumulatively contribute to eco-nomic growth. Usually, profitable projects, market conditions and the capacity of managers are costly and difficult to assess for the individual saver. Due to this information asymmetry, savers will be reluctant to invest and capital may thus not reach its most valuable destina-tion. Through the mobilization and bundling of savings, financial intermediaries are able to economize on the acquisition of information about investments and funnel capital into the most profitable projects. Occuring investment risks are thereby hedged for the individual saver by allocating capital to different projects and thus mitigating potential “idiosyncratic shocks such as unobservable taste or liquidity shocks, and diversifiable risks from the volatility of asset returns” (Pagano, 1993, p. 616). Apart from financing investment worthy projects and technology, financial intermediaries further exert through their provision of funding control over managers and monitor the ongoing process of project development. Already early theoretical literature, although not explicitely developed, constructs its argu-mentation around the aforementioned functions and draws conclusions about causalities between financial development and economic growth. Schumpeter (1912), for exam-ple, considers credit markets as an important driver of economic growth, arguing that entrepreneurs require credit to finance innovation and the adoption of new production techniques. Also other economists, such as McKinnon (1973) and Shaw (1973), argue that a well-developed financial system exerts positive effects on economic growth. This view, however, does not find universal acclaim. It is contested, for example, by Robinson (1952) who advocates a rather passive reaction of financial development to economic growth. According to his argumentation, the financial sector grows through a higher demand for financial services driven by economic growth. Both directional hypotheses and potential staggered interactions like feedback loops have later been further developed by, among others, Greenwood and Jovanovic (1990), Berthélemy and Varoudakis (1996), and Blackburn and Hung (1998).
King and Levine (1993a,b) are among the very first to test this relationship empirically. They show that bank development measured as liquid liabilities (M3) divided by GDP helps to explain economic growth in a sample of more than 80 countries3. Beck et al. (2000a,b) improve on the previous studies on the variable side by including only credit to
private firms, thus exclude credit to the public sector, and technically by controlling for reverse causality through instrumental variable methods. Beck et al. (2000a) note that financial development might influence growth either through improvements of savings allocation (the technology channel) or through an increase in domestic savings rates and the attraction of foreign capital (the capital accumulation channel). Levine and Zervos (1998) and Beck and Levine (2004) expand the analysis and assess the relationship between economic growth and stock markets as well as banks. Both studies provide a positive joint significance as well as an independent impact of stock market development and bank development on growth. Despite of the latter controlling for simultaneity bias and omitted variable bias, they reach the similar conclusion that stock markets provide different financial services from banks4.
Conversely, Rousseau and Wachtel (2011) by analyzing a later time span than previous studies discover that the link between financial development and economic growth has been weakened over time and even becomes negative during periods of financial crises. They thus confirm results from Loayza and Rancière (2006) that over the long run financial development supports economic growth; yet in the short run, financial fragility in the form of crises may hamper a positive relationship in maturing markets. Focusing entirely on the long term and analyzing both banking and stock markets through composite indicators, Seven and Yetkiner (2016) find a significant and positive impact of both measures on economic growth in low- and middle-income countries. However, the relationship turns negative in high-income countries.
Research on such nonlinearity in the relationship has very recently been further deepened by Arcand et al. (2015); Beck et al. (2014); Breitenlechner et al. (2015) and Pagano (2013). By using industry-level data, Pagano (2013) finds that financial development benefits in particular countries with relatively under-developed financial sectors (non-OECD countries) or industries, which profit the most from an easing of financial constraints. Moving one step forward, Arcand et al. (2015) identify thresholds beyond which finance exerts a negative effect on growth. Through country- and industry-level data the authors provide evidence that a credit to the private sector level of beyond a range of 80 to 120% of GDP, depending 3In the same vein but on a more microeconomic perspective, Rajan and Zingales (1998) show that in
countries with well-developed financial systems, industries that are heavy users of external finance grow relatively faster than other industries.
4For a recent and thorough overview on the subject matter we refer readers to the excellent studies by
on estimation method and time period, produces harmful effects to output growth. Results in Breitenlechner et al. (2015) show similar thresholds for financial development proxied by private credit and liquid liabilities (80 to 130% respectively). Beck et al. (2014) find analog results for a set of mature economies, where accounting for the frequency of financial cycles as well as non-intermediary activities in banks’ business models pushes the “negative finance” boundary outward. Explanations for non-monotonic behavior are, for instance, an increasing importance of market-based intermediation (Demirgüc-Kunt et al. (2013)) or the “brain-drain” of skilled workers from the manufacturing to the financial
sector due to an attractive extraction of rents from investors (Philippon and Reshef (2013)). Beck et al. (2012) argue that in mature financial sectors an increasing allocation of credit to households instead of firms may hamper growth, as financing is used for consumption rather than investment.5
2.1 Financial Sector Development and Growth in Transition Economies
Transition countries exhibit a particular trajectory of financial development that needs to be taken into account when analysing them. The opening up in the early stages of the transitioning process from a socialist to a market-oriented economy was accompanied by the creation of market-oriented financial institutions. Due to a hitherto largely mono-banking system with the central bank combining the functions of a monetary authority and of commercial banks, laws had to be created that allowed private banks to be founded and foreign banks to enter.6 Particularly through access to markets via foreign banks policy makers were hoping to obtain both regulatory and technological know-how from abroad to improve lending practice and allocation of funds in the new created banking sectors. As a result, foreign banks bought former state banks, which so far existed only along functional lines, and opened up new branches and subsidiaries. Most transition economies thus encountered a rapid expansion of their banking sectors due to the entry of new or foreign banks accompanied by decline in government ownership. Since then, foreign banks have played a crucial role in the establishment and development of a financial system in the transition economies.
During the 1990s, however, many countries went through financial crises in the transition process, because such profound disruptions of the economic process created macroeco-nomic turbulences7. Inefficient regulation and a lack of adequate collateral guidelines often resulted in soft budget constraints with a continuation of bad lending practices and 5Another reason may be excessive leverage on the financial intermediaries’ side and balance sheet
recessions, which protract recoveries after crises (Rajan (2006)).
6A more detail description on the transformation process of Eastern European financial systems can be
found, for example, in Cottarelli et al. (2005) and Bonin et al. (2014).
a gradual recognition of the existing low loan quality within state-owned banks (‘flow problem’ and ‘stock issue’, (Bonin and Wachtel, 2003, p. 8)). This drove many firms and ultimately banks into insolvency while poor bankruptcy laws contributed to an aggravation of the financial disorder.
As it has been shown above, a substantial body of empirical research has investigated the relationship between financial development and economic growth with the primary result of a positive impact, particularly for economies with low and intermediate levels of financial development. Under circumstances specific to transition countries, however, our knowledge is still rather limited. Only very few papers have tackled this issue across a larger cross-section of Eastern European economies.8 Koivu (2002) and Dawson (2003) have been among the very early studies to look into this matter, although both time spans of analysis cover only the first few years after the transition. The first study finds that the margin between lending and deposit interest rates negatively and significantly affected growth, yet the depth of the financial sector in terms of credit provision has no effect. The same holds for Dawson (2003) using liquid liabilities (M3) as the variable for financial development9. Fink et al. (2009), using a short dataset from 1995 to 2000, find a positive impact of financial intermediation on growth; whereas domestic credit is helpful in pro-moting growth, private credit and stock market capitalization do not exert any significant effect. Two very recent articles expand the time frame up to the beginning of the recent crisis. Caporale et al. (2015) generally find a positive yet insignificant relationship between financial development in the form of domestic credit to the private sector and growth in Eastern Europe. Conversely, monetization and increased efficiency in the financial sector strengthen economic development. Moreover, despite of providing some evidence on the importance of private credit from the banking sector for growth, Cojocaru et al. (2015) emphasize particularly the importance of financial system efficiency and competitiveness. Moreover, turning again to nonlinearities in the finance-growth nexus, Masten et al. (2008) find considerable threshold effects for Euro area accession countries between 1996 and 2004 relative to their level of financial development. During 1993-2003, Mehl et al. (2006) show that foreign bank penetration sometimes had a positive and significant influence on growth in South-Eastern Europe. Financial deepening in form of financial monetization and intermediation, however, had a significant negative effect.
8Apart from sparse research on a cross-sectional basis, studies were also conducted for specific countries. A
recent example by Kenourgios and Samitas (2007) covers Poland where credit availability has been identified as important for long-run economic growth; stock market liquidity does not seem to play a pivotal role.
9By replicating the Dawson (2003) model for an extended time period, Gillman and Harris (2004) confirm
Table 1: Main Indicators of Financial Sector Development
Number of Banks Bank Foreign Banks in % Foreign Bank Assets in Concentration % of Total Assets Country 1995 2013 1995 2013 1995 2013 1995 2013 Albania 6 16 - 57 50 85 - 89 Bosnia-Herzegovina - 27 - 44 - 64 - 87 Bulgaria 41 30 95* 44 7 65 29* 62 Croatia 54 30 34* 59 2 52 0 90 Czech Republic 55 44 71* 62 42 62 17 85 Estonia 19 16 79* 62 26 75 2 97 Hungary 43 35 53* 75 49 80 19 56 Latvia 42 26 79* 51 26 55 36 58 Lithuania 15 15 83* 82 0 75 0 91 Macedonia 6 15 - 68 50 67 - 68 Poland 81 69 50* 41 22 76 4 76 Romania 24 39 - 58 33 82 11* 79 Serbia 112 31 99* 43 2.7 66 - 75 Slovakia 33 28 69* 77 55 67 19 75 Slovenia 39 23 43* 51 15 35 4 25
Sources: EBRD Structural and Institutional Change Indicators; Claessens and van Horen (2015); Raiffeisen
Research, CEE Banking Sector Report, various issues; Cihak et al. (2012); * for 1996 figures
2.1.1 A Quick Look at Some Indicators
Even though the number of studies is still rather limited, these countries generally provide an excellent test environment on the finance and growth nexus on the grounds that they exhibit bank-based financial systems, which are still relatively new and the degree of development varies considerably across economies.
These developments in the financial sector are also reflected in the figures of Table 1. It provides a snapshot of several indicators of the banking sectors for our transition country sample and confirms the developments over time outlined at the beginning of section 2.1. Between 1995 and 2013, the number of banks in transition countries has decreased overall, though to varying degree, reflecting the outlined process of market consolidation during that period. The exceptions were Albania and Macedonia where banks in the market actu-ally increased by almost the same number, from 6 to 16 and from 6 to 15 respectively. With it also bank concentration declined in the majority of countries and values currently vary tremendously, ranging from 41% in Poland to 82% in Lithuania.10 However, at the same time both the percentage share among all banks and of assets claimed by foreign banks with respect to total assets were rising. Some countries, such as Lithuania and Estonia, experienced drastic shifts in their market structure with foreign bank assets accounting for almost 100 % of total bank assets in 2013.
In the following, we provide a brief account of the methodology used to analyze the finance-growth nexus in transition countries and present the data.
10Bank concentration is measured as assets of the three largest banks as a share of total commercial bank
3
Methodology
Examining the literature, causality tests based on panel data have been employed by relying on different estimation techniques. Among the most popular ones stand the Gener-alized Method-of-Moments (GMM) and IV techniques, which allow only for the intercept to differ across countries but not to control for contemporaneous correlation among the error terms and slope heterogeneity (see e.g. Levine and Zervos (1998); Beck et al. (2000b); Beck and Levine (2004); Shen and Lee (2006); Caporale et al. (2015); Cojocaru et al. (2015)).11 A second bivariate approach introduced by Dumitrescu and Hurlin (2012) controls for slope heterogeneity and takes into account cross-sectional dependence among panel units. Andriansyah and Messinis (2015) recently expand the former to a trivariate model following the approach by Toda and Yamamoto (1995). A major shortcoming of both approaches, however, is that the rejection of the null of non-causality does not provide any guidance on the number or the identification of particular panel units for which the non-causality is rejected.
A third approach on which we rely for our analysis has been proposed by Konya (2006). Also Konya (2006) allows dealing with cross-sectional dependence and slope heterogeneity. Besides, being based on Seemingly Unrelated Regressions (SUR) systems and bootstrapped critical values for country specific Wald tests, Granger causality can be tested on each individual country separately and thereby account for potential cross-section dependence across countries12. This question is crucial and responds to the complex nature of the interactions and dependencies that generally exist over time and across the individual units in the panel. For instance, observations of firms, industries, regions and countries tend to be cross-correlated as well as serially dependent. As pointed out by Breitung (2005), the cross-section dependence can arise for a variety of reasons, including spatial regional spill-over effects, common unobserved shocks such as the recent financial crisis, social interactions, or a combination of these factors. Thus shocks affecting one country may also affect other countries because of a high degree of cultural similarities as well as trade and financial integration. This point may well be justified in our case due to the common Soviet heritage and, for instance, the strong economic integration with Western European countries as well as a deep penetration of domestic markets by European banks13. Econometrically, ignoring the impact of cross-section correlation yields seriously biased estimates (Philipps and Sul (2003); Andrews (2005)). Thus, in presence of cross-section 11As shown by Pesaran et al. (1999), unless slope coefficients are identical GMM estimators may lead to
inconsistent and thus misleading parameter estimations.
12The country-by-country analysis thereby allows to account for varying effects in the finance-growth nexus
due to e.g. different stages of financial development (see e.g. Masten et al. (2008); Rioja and Valev (2004)) which may not become apparent when merely pooling data.
13The importance of common and country-specific shocks to banking integration and (bank) capital flows
among, for instance, OECD countries has very recently been confirmed in a study by Cesa-Bianchi et al. (2016).
dependence, a system of Seemingly Unrelated Regressions (SUR) is more efficient than that of an equation-by-equation application of least-squares (OLS) ((Zellner, 1962, p. 363)).
In addition, due to the bootstrap critical values for the Wald tests the approach we use in this paper requires no pre-testing for unit roots and cointegration14. This is an important advantage since unit root and cointegration tests often suffer from low power and lead to contradictory results. The bootstrapping approach can also deal with small T samples what is very useful given the data employed in this study15.
Moreover, another issue to be considered is the heterogeneity in estimated parameters for each individual of the panel in order to impose a restriction for the causal relationship. As Granger (2003) points out, the causality from one variable to another variable by imposing the joint restriction for the whole panel is a strong null hypothesis. Assuming homogeneity for parameters in a panel data setting does not enable to capture heterogeneity due to country specific characteristics (Breitung (2005)). Whereas in many economic relation-ships such as the financial development and economic growth nexus it is highly possible that a significant relationship may exist in some countries, the opposite may also be true in other countries. In particular, the homogeneity assumption for the CESEE countries in analyzing causal relationships between financial development and economic growth may result in misleading findings. Even though the common economic heritage of these countries has created many similarities, a certain degree of heterogeneity in terms of financial development and economic structure exist. Coricelli (2001), for instance, points at some independence in the decisions of firms in Hungary, Poland and former Yugoslavia, where also monetary holdings and trade credit were allowed. The situation was different in Bulgaria, Romania, and the Soviet Union. Thus, slope heterogeneity in parameters can easily be assumed for our analysis.
Using the framework of Konya (2006), the causality between financial development and economic growth is investigated through the following trivariate system:
gdpi,t= α1,i+Plgdps=1iβ1,i,sgdpi,t−s+
Plf di
s=1γ1,i,sf di,t−s+
Pltoi
s=1δ1,i,stoi,t−s+ ε1,i,t
f di,t= α2,i+Plf ds=1iβ2,i,sgdpi,t−s+
Plgdpi
s=1 γ2,i,sf di,t−s+
Pltoi
s=1δ2,i,stoi,t−s+ ε2,i,t
(1)
14This is a generalization of the methodology developed by Philipps (1995) and Toda and Yamamoto
(1995). The authors provide evidence that statistical inference in the context of a VAR in levels can be conducted by means of standard asymptotic theory (normal and mixed limit theories), i.e. no unit root limit theory is required. Thus, without prior knowledge on the stationary properties of the series in the system, Wald tests with country-specific bootstrap critical values can be used to test for Granger causality.
15A similar bootstrap method has been developed by Emirmahmutoglu and Kose (2011), which is based
on lag-augmented VARs. However, this approach can become very costly for short time series and exhibits serious size distortions under small T.
where i (i = 1,. . . ,N) is the index of the country, t (t = 1,. . . ,T) the index of the period, and lgdpi, lf di and ltoi denote the lag lengths. The error terms, ε1,i,t and ε2,i,tare assumed to follow white-noise processes (which exhibit zero means and constant variances that are individually, serially uncorrelated). gdp denotes the natural logarithm of real GDP per capita, fd the natural logarithm of the respective measures for financial development (which are described in more detail in Section 4) and to, the natural logarithm of the trade
openness variable.
In the trivariate system above the main interest concentrates on the bivariate, one-period ahead relationship between economic growth (gdp) and financial development (fd). Trade openness enters as an auxiliary variable and does not directly influence the Granger causal-ity tests. The reason for this inclusion lies in the potential two-sided impact trade openness has on both GDP development and financial market depth and ensures better testing of the Granger causality. Bangake and Eggoh (2011), for instance, use trade openness as an exogenous control variable for testing causality between economic growth and several financial indicators. Almarzoqi et al. (2015) find a positive influence of increasing trade openness on financial depth. Financial development in developing countries has also been found to be growth enhancing through positive effects on trade in the long run by Kim et al. (2010). In the short-run, however, positive trade effects may be subject to financial fragility.16 Moreover, a linear time trend is included in all models to mitigate a potential omitted variable bias.
Note that in the two equations above, every country has the same predetermined, i.e. lagged exogenous and endogenous variables. Konya (2006), however, splits these equa-tions into two groups, one group consisting of equaequa-tions on gdp, the other of equaequa-tions on
fd: gdp1,t= α1,1+Plgdps=11β1,1,sgdp1,t−s+Ps=1lf d1γ1,1,sf d1,t−s+Pltos=11δ1,1,sto1,t−s+ ε1,1,t .. . gdpN,t= α1,N+P lgdp1 s=1 β1,N,sgdpN,t−s+P lf d1 s=1γ1,N,sf dN,t−s+Pltos=11δ1,N,stoN,t−s+ ε1,N,t (2) and f d1,t= α2,1+P lf d2 s=1β2,1,sgdp1,t−s+P lgdp2 s=1 γ2,1,sf d1,t−s+Pltos=12δ2,1,sto1,t−s+ ε2,1,t .. . f dN,t= α2,N+P lf d2 s=1β2,N,sgdpN,t−s+P lgdp2 s=1 γ2,N,sf dN,t−s+Pltos=12δ2,N,stoN,t−s+ ε2,N,t (3)
16Almarzoqi et al. (2015) criticize the use of (imports + exports)/GDP as a variable for trade openness
under the rationale that some countries are forced to export and values may therefore be misleading. Instead, imports/GDP are recommended. As a robustness check we also use this measure. However, given that trade openness is not directly involved in the Granger causality tests a major difference in the results is not discernible. Results have also been tested through a bivariate model without the inclusion of trade openness. Additional results are available from the author upon request.
Contrary to system (1), each equation in system (2) and (3) belongs to a different country and is estimated with a different sample. Thus each equation has different predetermined variables and the only possible link among individual regressions is the cross-sectional de-pendence (contemporaneous correlation among the error terms). Hence, these equations are not VAR but SUR systems. After obtaining SUR estimations, country-specific bootstrap critical values of the Wald test (generated by 10,000 replications) are used to implement the Granger causality test procedure.17 Please refer to the Appendix A.1 for a detailed description of the bootstrap procedure.
According to above systems, there is one-way Granger causality from fd to gdp in country
i if in equation (2) not all γ1,i’s are zero but in (3) all β2,i’s are zero; there is one-way Granger causality from gdp to fd if in the first equation all γ1,i’s are zero but in the second not all β2,i’s are zero; a two-way Granger causality exists if neither all β2,i’s nor all γ1,i’s are zero and no causality exists if both γ1,i’s and β2,i’s are zero.
4
Data
Our sample contains in total 15 Eastern European countries (Albania, Bosnia-Herzegovina, Bulgaria, Croatia, Czech Republic, Estonia, Hungary, Latvia, Lithuania, Macedonia, Poland, Romania, Serbia, Slovakia, Slovenia) and annual data series cover the maximum period of 1993-2014, thus including the 2008 financial crisis and the recent European debt crisis. This gives us the opportunity to inspect the finance growth relationship in more detail. We restrict our data to start in the mid 1990s, thus excluding potential macroeconomic turbulences from early transition years and for which data are not available.
Data are collected from World Bank databases (World Development Indicators and Global Financial Development Indicators18) and set into natural logarithm. Following previous literature (Levine and Zervos (1998); Beck and Levine (2004); Peia and Roszbach (2015)), economic development is measured as real GDP per capita (GDPPC) in constant 2005 US dollars19. To proxy for financial development, two initial indicators are considered: broad money measured by the ratio of money and quasi money (M2) to GDP and domestic credit to the private sector (DCPS) as share of GDP. These are standard indicators of financial development often used in the literature, which measure two slightly different financial sector aspects (Levine and Zervos (1998); Beck et al. (2000b); Berthélemy and Varoudakis 17The panel Granger causality tests were performed with a TSP 5.1 routine. I thank Baris Tekin for useful
codes.
18Original data come from Cihak et al. (2012).
19Real GDP per capita figure is superior to total real GDP figures, because some of the errors inherent in
the estimation of the level of GDP and of population tend to be offsetting (Heston (1994)). Note that during our sample period population in many transition countries fell. For Cojocaru et al. (2015) growth in output per capita mirrors to some degree this decline.
(1996)). The measure M2 to GDP comprises currency plus demand and interest bearing liabilities of banks and non-financial intermediaries divided by GDP. This proxy is the broadest measure of financial intermediation and considers three types of financial institu-tions: central banks, deposit money banks, and other financial institutions. Domestic credit to the private sector refers to financial resources provided to the private sector, such as loans, purchases of non-equity securities, trade credits and other account receivables that establish a claim for repayment. Credit to the central government or public enterprises is excluded. Higher levels of this variable could therefore stand for greater financial interme-diary development through an increased provision of credit, potentially triggered by lower transaction costs and more advanced financial services. However, de Gregorio and Guidotti (1995) also emphasize a potential misleading interpretation in financially underdeveloped economies, where such high levels, instead of being linked to better financial development, impede economic growth through careless lending or over-lending, often encouraged by government interventions leading to moral hazard. Similar caution is warranted when examining the meaning of the broad money (M2) variable as low levels can either mean under-development of the banking sector or a highly sophisticated banking sector that allows for a reduction of money balances and instead promotes investment into other products.20 Broad money (M2) thus reflects the deposit gathering activity of the financial system, while domestic credit is an indicator that captures the ability of the financial sector to support the economy. Domestic credit to the private sector by banks (DCPSB) to GDP has also been employed in recent studies on financial development for regions with a strong banking sector (e.g. de Gregorio and Guidotti (1995); Menyah et al. (2014)), but data for CESEE economies are of insufficient quality and highly correlated with DCPS (0.98).
Moreover, the ratio of commercial bank assets to all (commercial plus central) bank assets (BA) is used to measure the degree to which commercial banks versus the central bank allocate society’s savings (e.g. Rioja and Valev (2004); Andrés et al. (2004); Saci et al. (2009)). The underlying intuition is that commercial banks are more likely to identify
profitable investments, monitor managers’ decisions, facilitate risk management and mobi-lize savings than central banks. Commercial banks are thought to be more effective than central banks in allocating savings to productive investment projects. An increase in this ratio may indicate a better and more sizeable allocation of savings and therefore benefit economic growth.
Previous studies, such as Levine (1996) and Rousseau and Wachtel (2000) have added indicators of the size and liquidity of stock markets, but they are mostly underdeveloped 20High levels, in contrast, may indicated that money is used as a store of value in absence of more attractive
options (Khan and Senhadji (2000)). Although being well aware of its deficiencies, due to a lack of alternative data and its still popular usage in the literature we employ this variable as well.
in transition countries and series not available over longer time periods.
4.1 Foreign Bank Presence
Moreover, the banking system in the transition economies has become more and more dependent on the activities of foreign banks as shown above. In fact, in most transition countries the financial architecture has converged towards a bank-based system with substantial foreign ownership. These, mainly from Western European countries, control the majority of assets and capital flows in the financial markets. Research has shown that their entry has boosted economic growth through extending credit to the private sector (Cottarelli et al. (2005)), enhanced competition and contributed to attract foreign direct investment (see e.g. Bonin et al. (2005); Havrylchyk and Jurzyk (2011)). However, the lack of effective regulation, anti-trust legislation and mergers and acquisitions can lead to excessive concentration, while anti-competitive practices and abuse of dominant position may also occur.
Therefore, additionally to the aforementioned variables on financial depth, we follow Cetorelli and Goldberg (2011) and Avdjiev et al. (2012) and employ the ratio of con-solidated foreign claims (CFC) to GDP of banks reporting to the Bank for International Settlements (BIS) to account for the high reliance on cross-border loans and thus for the large domination of foreign banks in the different markets21.
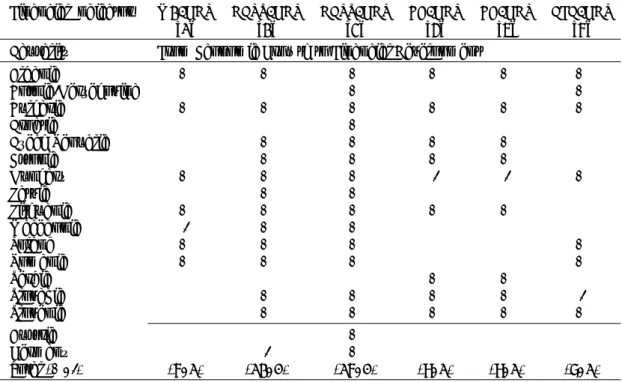
Caution, however, is advised when interpreting the data. Whereas CFC may indeed indicate the presence of foreign banks and a reliance on cross-border loans, the variable may also simply represent the size of the financial market at hand. In order to give more credibility to our results, in a later section CFC have been cross-checked where possible with other institutional indicators on foreign bank presence such as foreign bank assets to total assets as well as our efficiency indicator BA. Hence, we are at least partly able to provide more specific evidence of foreign bank penetration in contrast to mere domestic bank lending. Table 2 below provides a brief account of key variables used in this study and their development over the sample period.
Across the whole country sample, all financial indicators have experienced a tremendous increase during the period from early transition to 2013. On average, the M2 over GDP ratio increased about two times and domestic credit by 3.5 times. Macedonia experiences the largest increase of all transition countries in monetization, and credit provision grew 21Because we generate bootstrap critical values, countries are selected to obtain a balanced panel, which
is contingent on data availability. Hence, different financial variables embrace varying countries and time periods: M2/GDP for 1994-2014 (without Croatia, Bosnia-Herzegovina, and Serbia), Domestic Credit/GDP for 1996-2014 (without Bosnia-Herzegovina and Serbia), Commercial BA/(Commercial and Central Bank Assets) for 1997-2013 (without Bosnia-Herzegovina, Latvia, and Romania), Foreign Claims/GDP for 1995-2013 (without Serbia).
Table 2: Development of Key Variables Over Time M2 DCPS CFC BA GDPPC Country 1995 2013 1995 2013 1995 2013 1995 2013 1995 2013 Albania 47.81 84.18 3.76 37.58 6.25 58.58 64.34 92.51 1412.75 3465.41 Bosnia-Herzegovina - 61.20 - 62.01 5.95 58.17 - 99.99 881.81 3376.87 Bulgaria 67.03 83.75 40.02 69.64 22.86 68.64 88.27 99.88 2917.44 4835.66 Croatia 20.96 69.62 26.19 76.72 3.12 131.14 99.33 99.99 6574.14 10471.93 Czech Republic 68.71 78.07 65.70 55.36 17.94 103.25 97.46 99.99 9932.46 14390.32 Estonia 16.25 54.78 16.18 73.70 2.30 89.28 99.66 99.96 5148.73 12343.31 Hungary 46.78 68.59 21.83 50.76 21.58 75.98 40.76 99.22 7583.87 11363.61 Latvia 18.94 54.93 8.11 60.70 1.02 70.01 95.15 - 3596.90 9457.68 Lithuania 20.87 45.29 14.69 46.22 1.87 55.10 99.58 99.61 3985.27 10450.05 Macedonia 11.77 56.54 23.11 49.20 1.70 39.19 97.15 93.11 2510.67 3840.42 Poland 31.61 58.88 16.85 53.93 5.45 62.43 83.62 100.00 5251.04 10870.31 Romania 30.58 37.88 - 41.42 6.05 57.16 84.10 - 3324.16 5583.87 Serbia - 44.29 - 43.57 - 69.10 - 99.84 1780.04 3799.29 Slovakia 59.53 60.75 35.75 48.37 7.11 88.44 87.99 99.68 6001.10 11765.55 Slovenia 31.07 64.08 24.69 70.79 5.31 64.46 98.11 99.31 12410.30 18530.73 Sources: World Bank Development Indicators, Global Financial Development Indicators (2015); all variables in % of GDP except GDP per Capita (in 2005 $US)
the most in Albania. Consolidated foreign claims faced the largest surge overall, in many cases a more than ten-fold augmentation peaking in Latvia with the highest percentage increase. However, comparing mean values for the sample period of our transition coun-tries with other regions in the world, Eastern Europe still exhibits an intermediate level of financial development. The cross-sectional average of the transition countries stands for the DCPS ratio at 40.49%, for more developed Western European countries such as Austria, Germany or the UK at levels exceeding 90%. At the other end of the scale with less than 10% lie developing countries such as Cambodia or Yemen. This difference is even more pronounced when considering the money supply ratio M2. Transition countries overall reveal an average of 46.87%, while highly developed economies such as Luxembourg show ratios of beyond 400% of GDP.
Despite of showing some heterogeneity across countries and an increase in the ratio over the years, commercial bank assets over total (commerical and central bank) assets has an average of 94.03 % over time. This is comparable to other Western European countries, which are close to 100%.
However, not only the financial variables but also GDP per capita has risen significantly during the last 15 years. On average, residents of each country had twice the income per capita in 2013 than in 1995. Yet, the average disguises quite some heterogeneity in economic development with respect to per capita income levels. Slovenia, for instance, kept its principal position among all transition countries considered with the highest per capita GDP level of 18530.73$US in 2013, and Bosnia-Herzegovina still remained at the lower end with 3376.87$US. Additional country-by-country and whole-sample summary statistics can be found in Table 7 in Appendix B.
5
Empirical Results
Before estimating the Granger causalities for our variables, we need to specify the optimal lag length and test for cross-sectional dependence among the panel units in order to select the appropriate estimator. The choice of the lag length is essential because the causality test may be sensitive to the lag structure. Following Konya (2006), the maximal lags are allowed to vary across variables but remain the same across equations. For relatively large panels with varying lags across countries, variables and equations, the computational burden would otherwise increase tremendously. In order to select the optimal lag length via minimizing both the Aikaike Information Criterion (AIC) and the Schwarz Bayesian Information Criterion (SBIC), the equation systems are estimated for each pair of lfd1,
lgdp1, lto1, and lfd2, lgdp2, and lto2 respectively by assuming a lag range from 1 to 3. Both information criteria clearly select one lag for each variable combination. Consequently, we only report results for which the information criteria have been minimized. Results of the optimal lag determination can be found in Table 6 of Appendix A.2.
As mentioned above, for testing cross-sectional dependence among regressors we conduct the Lagrange multiplier test (CDBP) by Breusch and Pagan (1980) and, due to its good small sample properties (for both T and N small), the test (CD) developed by Pesaran (2004) which is based on pair-wise correlation coefficients22.
Table 3: Tests for Cross-Sectional Dependence
M2 DCPS BA CFC
CDBP 353.078*** 253.158*** 258.830*** 343.203***
CD 5.373*** 5.615*** 8.795*** 1.970**
Remarks: Under the null hypothesis of no cross-sectional
depen-dence, the Breusch and Pagan (1980) statistic test (CDBP) follows
a Chi-square distribution with N(N-1)/2 degrees of freedom. The Pesaran (2004) test (CD) is distributed as a standard normal. For test implementation, log GDP per capita is used for each test as the dependent variable. ***, ** indicate a rejection of the null hypothesis at the 1% and the 5% significance level.
Source: Author’s calculations.
Table 3 reports the results for all financial variables employed. Both tests strongly reject the null hypothesis of no cross-sectional correlation at either the 1% or the 5% significance level. Given above test results, movements in one variable of a particular country may well influence developments in other economies; strong economic and financial links across the transition economies can thus be inferred. This confirms the suitability of the SUR estimator against the country-by-country OLS estimator.
22 Even though several other cross-sectional dependence tests have been tested, Moscone and Tosetti
5.1 Financial Development - Economic Growth Causality
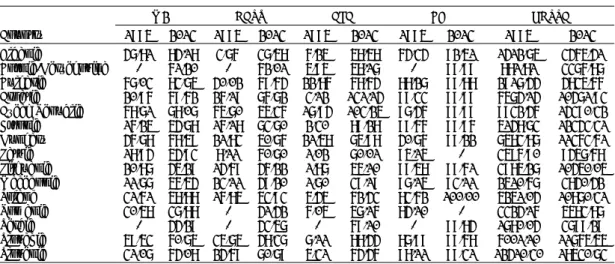
After having checked the viability of the employed estimator, Table 4 and Table 5 present in the form of plus and minus signs the significant results of the Granger causality tests for all financial variables. Whereas Table 4 shows the direction from financial development to economic growth, Table 5 provides causalities running from economic growth to the respective financial variable. Boldface signs indicate significance levels at 1%, normal signs stand for 5% or lower. Detailed results on the country-specific Wald tests and the coeffi-cients can be found in the tables of Appendix C. Note that the concept of Granger causality is primarily a statistical one and does not necessarily coincide with economic causation. Care therefore needs to be taken when interpreting results for policy recommendations. It is noticeable in Tables 4 and 5 that causality varies widely in direction and size across the transition country sample with respect to the financial indicator in place. This is not only the case in terms of significance of the Wald test statistics of the Granger causality tests but also with respect to coefficients in the equations estimated, which are on average larger for the growth-finance direction than for the opposite causality. Consequently, we analyze our results below in a step-by-step fashion according to direction of causality, significance and size of coefficients.
Examining the overall picture for causality from conventional measures of financial de-velopment to economic growth in columns [1] and [2] in Table 4, we find that financial sector development in the form of M2 to GDP and DCPS to GDP negatively Granger causes economic growth to some extent. In four out of seven and four out of six significant cases, financial monetization and domestic credit provision respectively have a negative impact on per capita economic growth. This is at odds with the conventional literature on the finance and growth relationship, which finds a predominantly positive impact, even when comparing with recent studies on nonlinearities within the relation (Arcand et al. (2015); Breitenlechner et al. (2015))23. However, our findings are generally in line with
the experience of Eastern European transition countries (e.g. Yu et al. (2012)). The results also confirm previous evidence from Mehl et al. (2006), who find a negative and often significant effect of financial monetization and intermediation on economic growth for South-Eastern European countries, albeit for an earlier period. In contrast, with a causality in the majority positive across transition countries, commercial bank assets over total assets (BA) in column [4] convey a rather different picture. Although BA also aims to proxy for the degree of financial development, compared to the M2 and DCPS variables it rather measures the risk sharing and information gathering capacity of the banking sector than 23As described in the literature review in Section 2, thresholds of DCPS and financial monetization for
insignificance or a negative impact of finance on growth are considerably higher than experienced by transition countries (see Table 2). Moreover, particularly for low and intermediate levels of financial development results are usually positive.
Table 4: Directions of Causality
Financial Indicator M2/GDP DCPS/GDP DCPS/GDP BA/GDP BA/GDP CFC/GDP
[1] [2] [3] [4] [5] [6]
Causality From Financial Development to Economic Growth
Albania + - - -Bosnia-Herzegovina + Bulgaria + + + Croatia - - + + + Czech Republic - - - - - + Estonia + + + Hungary - + + Latvia + + + Lithuania + + + + Macedonia + + + + + Poland - - + -Romania - - - + Serbia Slovakia - + + Slovenia - - + + + Austria + Germany -Total (+, -) (3, 4) (2, 4) (2, 7) (7, 2) (10, 2) (10, 1)
Remarks: Boldface plus or minus signs (+, -) indicate the positive (negative) directional link given
by the panel heading for the indicated financial indicators at the 1% significance level; plus or minus signs (+, -) indicate a positive (negative) effect at the 5% significance level or less. Reported signs are derived from the entries in the Tables of Appendix C.
Source: Author’s calculations.
its mere size and depth. Through the positive impact on growth, the superior allocation capabilities of commercial banks vis-à-vis central banks seem to play an essential role in many of the transition countries. In a similar way, consolidated foreign claims also exert an overall positive impact on GDP per capita in these countries.
As mentioned earlier in Section 3, the methodology used allows for an account of cross-sectional dependence among transition countries. However, close financial and trade ties also exist with neighbouring Western European countries.24 Germany and Austria are particularly connected with transition countries through foreign bank presence and a strong Eastern European integration in the supply chain of companies in these countries. To cover potential contributions through spillovers from these countries, we add them to the country set and re-estimate regressions for domestic credit extension DCPS and the ratio of commercial banking assets BA.25 Results presented in columns [3] and [5] generally confirm the findings from estimations with the transition country sample and 24The deep financial integration between the EU and transition countries has very recently been confirmed
by Fadejeva et al. (2016) who analyze spillover effects of financial shocks originating in the EU. They find that negative shocks to Euro area loan supply and aggregate demand trigger large Eastern European contractions in total credit and output.
25Due to data limitations, these are the only variables where a re-estimation with the extended country set
even partly increase the significance for individual countries. Below, we have a more differentiated look at the results for the individual variables and countries and analyze the different channels through which causalities may manifest themselves.
5.1.1 Countries and Causes
Although allowing for more general tendencies, the observations above exhibit quite some heterogeneity across countries. Somewhat contrasting with Caporale et al. (2015), who find a positive but insignificant impact of domestic credit on economic growth for their different subsamples, results of the Granger causality tests point at a foremost negative causality for the countries with a significant relationship. Croatia, Poland and Romania, for instance, exhibit mildly negative signs. The Czech Republic is a negative outlier in terms of significance, indicating negative causality from credit provision to growth at the 1% level. This negative trend becomes even more apparent when adding Austria and Germany to the sample, where Albania, Slovakia and Slovenia now also display negative causalities at low significance levels. Moreover, the significance of the negative relationship for Poland and Romania rises.26 Among the Baltics, only Latvia shows a positive and highly significant relationship, whereas for Estonia and Lithuania the test statistics remain non-significant. While Bulgaria does not show any significance for the conventional variables, Macedonia is the only other country with a strong positive influence of credit provision on growth. A key component in explaining the heterogeneity in above results may be the quality of regulatory systems and institutions, which has previously been found to play an essential role for a beneficial financial development in general (Beck et al. (2000b); Demetriades and Law (2006)) and for twelve Latin American countries in particular (de Gregorio and Guidotti (1995)). They have also shown to exert strong influence on the relationship in transition countries (Mehl et al. (2006)). The positive or at least non-negative impact of DCPS and M2 on economic growth in Bulgaria, Estonia and Latvia is according to Cottarelli et al. (2005) primarily related to their status as “early birds”, i.e. early and more pronounced financial development. Rapid privatization, public sector retrenchment and a general improvement of market-oriented institutions may have helped to base financial deepening on more solid grounds than in other countries. The predominantly positive relationship between the financial indicators and economic growth in the Baltic countries thus may reflect a more advanced legal and regulatory system.
The overall rather negative tendency in the other countries in terms of credit extension and monetization for economic growth is more in line with recent results of Cojocaru et al.
26Note also the non-significance of the credit variable for Austria and the even slightly negativity for
Germany. This may be related to the high degree of financial sector development in high-income economies, which, according to Arcand et al. (2015); Beck et al. (2014) and Breitenlechner et al. (2015), lead to no significant or a negative contribution to economic growth due to reasons explained earlier in Section 2.
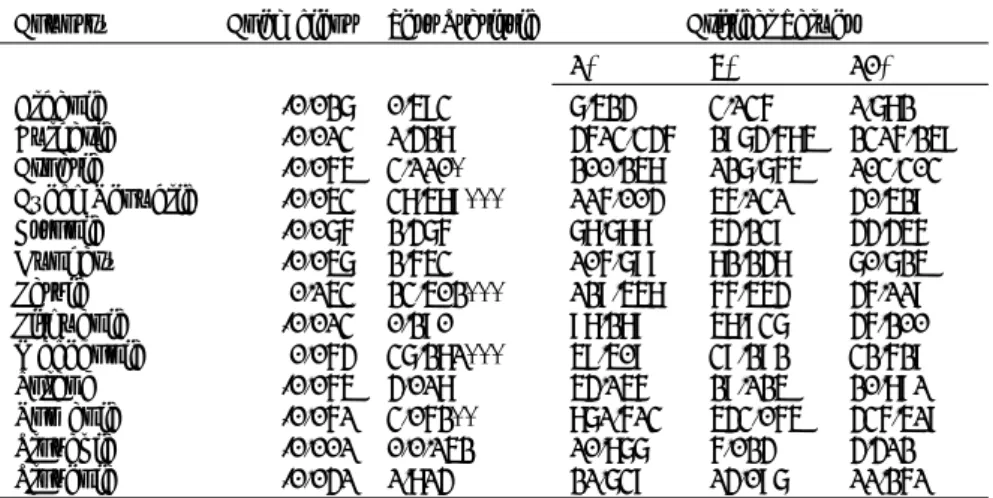
(2015), who single out a continuous persistence of soft budget constraints, state-owned enterprises and state-owned banks as reasons for a distortive allocation of credit. These findings have previously been confirmed by Yu et al. (2012), who find no relationship between finance and growth in the short run (less than 10 years) but a positive in the long run, mainly due to ill-enforced legal systems and political instability. Moreover, Cottarelli et al. (2005) group the negative outliers Albania, Czech Republic, and Romania as “sleeping beauties”, where a delayed cleaning up of banks’ balance sheets and a slower develop-ment of accounting standards may, at least to some extent, explain a negative Granger causality between financial development and growth. A similar conclusion can be drawn for Croatia and Slovenia, which also attract negative signs for the conventional indicators.27 In order to further check on the latter channel for a disruptive finance-growth nexus, we follow Pagano (2013) and calculate for the transition countries simple pairwise cor-relations between DCPS and the bank “Z-score”, a measure of bank creditworthiness28. A negative correlation reflects a decreased creditworthiness of a country’s banks with increasing credit provision, potentially putting the stability of the banking system at risk.29 Positive correlations on the other hand usually indicate further room for profits in the banking sector through credit extension and are thus primarily encountered in financially underdeveloped countries. Negative correlations have usually been found for mature economies where DCPS ratios exceed high thresholds, analogue to the negative territory boundary in the non-monotonicity literature of financial development (see e.g. Arcand et al. (2015)). When examining the correlation coefficients for the transition countries, negative values for Albania, the Czech Republic as well as Romania do not only support the above “sleeping beauties” hypothesis but also confirm our results of a primarily negative relationship between DCPS and growth. According to the negative correlations obtained, firms in these countries do not increase profitability with increasing credit provision what may have a negative impact on banks’ profits and capital base. The same conclusion can be drawn for Slovenia. The comparatively high negative correlations for Bulgaria and Estonia seem at first to stay in contrast to previous results. However, they may also underline that these countries’ regulatory systems seem more apt to deal with extended credit provision and are able to better ensure financial stability.
An additional disruptive effect on the relationship between conventional financial de-velopment and economic growth may be the plurality of major domestic financial and
27Although several transition economies entered the OECD during our sample period, the results do not
provide clear evidence of a relationship between OECD membership (and the accompanied build-up of efficient institutions) and positive impact of financial development.
28The bank “Z-score” is calculated as the the sum of return on assets (ROA) and the equity/assets ratio,
divided by the standard deviation of ROA. Data come from Cihak et al. (2012).
29Negative correlations have been found for Albania (-0.12), Bulgaria (-0.71), Czech Republic (-0.30),
Estonia (-0.47), Macedonia (-0.30), Romania (-0.13), Slovenia (-0.62). The other countries in the sample exhibit low positive correlations.
banking crises, particularly in the late 1990s30. Analyzing large yet different country sets, Rousseau and Wachtel (2011) and Breitenlechner et al. (2015) consider the incidence of banking crises as the reason for a weakening of the finance-growth link in recent years. With regard to above results, this decreasing trend is corroborated by evidence from the transition economies in light of their financial sector characteristics. When comparing the performance of the positive outliers Bulgaria, Estonia, Latvia and Lithuania against Western European countries during the Global Financial Crisis, Gros and Alcidi (2015) find that these countries were able to adjust quicker to the shock than their western counterparts. The large share of foreign ownership helped the banking sector to remain stable, to cushion negative loan shocks and avoid a full-blown banking crisis, what may have dented economic growth further (see e.g. Gardó and Martin (2010); Lindner (2011)). The results for the size of the commercial bank assets ratio are reported in column [4] of Table 4, where the variable is found to have a primarily positive effect on growth. The level of significance, however, varies among transition countries, what confirms previous results on 30 developing countries of Saci et al. (2009). When enlarging the country set with Austria and Germany in column [5], results are generally affirmed; Poland, Slovakia and Slovenia gain additional significance for a positive relationship. While Austria exhibits a low significant yet still positive impact on growth, it is insignificant for Germany and thus relates to results in Andrés et al. (2004) who find a weak positive relationship in OECD countries. Moreover, the hypothesis, as for instance argued in Pagano (1993), that a rather concentrated banking market may fail to allocate funds efficiently to investments cannot be confirmed for the majority of countries. As in Cojocaru et al. (2015), efficiency seems to matter more for growth than the sheer depth of the financial market.
We now turn to the last variable in the above table, consolidated foreign claims. In order to support our results, we compute country correlations between the CFC variable and the ratio of foreign bank assets over total assets.31 When examining foreign claims as a variable for foreign bank exposure of the economy in column [6] of Table 4, results look rather different. Almost all countries except for Albania, Estonia and Hungary, exhibit a positive and significant Granger causality running from CFC to economic growth. For Slovakia, Croatia and the Czech Republic the relationship is also positive yet only mildly at the 10% significance level. With the exception of Poland, this result blends well with 30E. g. Albania in 1994/1997, Bulgaria in 1996, Croatia in 1998, or the Czech Republic in 1996 and recently
the Global Financial Crisis; for a more detailed account consult Laeven and Valencia (2012). Unfortunately, it is technically not possible to test with the approach at hand for a differentiated impact of the recent financial crisis due to too short time series combined with a relatively large cross-section.
31For all positive and significant causality results, the correlations between CFC and the foreign bank assets
ratio are positive, yet to varying degrees. The average correlation is 0.55, while individual country correlations are ranging from 0.95 for Romania to a low 0.16 for Lithuania. Although we cannot with absolute certainty conclude that only foreign bank activity is measured, we nonetheless can infer from our results the direction of causality. The series for the foreign bank assets ratio have been taken from Cihak et al. (2012).
the recent findings of positive effects of foreign bank activity, such as introducing superior lending techniques, increasing efficiency or exercising more cautious lending32. Allen et al. (2011) also emphasize the subsidiary structure in transition countries, where many foreign banks are “locked in” due to long-term loan commitments of subsidiaries that cannot be recalled easily. This organisational structure of banks may certainly have helped to insulate the region against a stronger crisis impact. However, foreign banks are also suspected to “cherry pick” clients, potentially leaving other domestic banks to deal with less credit-worthy or “opaque” customers (de Haas (2014)).
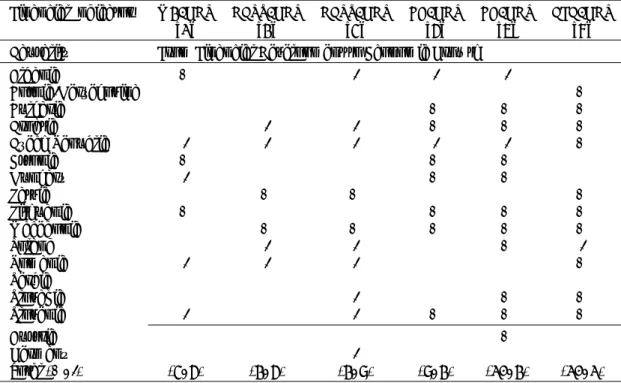
5.2 Economic Growth - Financial Development Causality
By examining results on causality running from economic growth to financial development in Table 5, the reverse Granger causality across all financial indicators is in the majority positive and seems to follow more the argumentative line of Robinson (1952). He argues that economic growth precipitates financial development as a result of higher demand for financial services for a growing economy. Apart from a high significance of the Wald test statistics, this finding can further be substantiated by significantly larger estimated coefficients in the equations compared to those estimated for the opposite causalities (see Appendix C). The only relationship with comparatively small coefficients belongs to the BA variable. However, the commercial bank assets ratio exhibits a very high persistency over time across all countries and financial sector development may have therefore not been reflected to a similar degree as in other variables.
The least significant Granger causalities appear for the liquid liabilities variable M2. In contrast, GDP per capita drives in almost all countries DCPS in a positive way. This also holds in the extended country version, where Austria and Germany attract positive and significant causalities. Given the observed discrepancy for the variable on domestic credit extension, our results cannot confirm a clear positive bi-directional causality in the short run as in Hassan et al. (2011).
Reasons for this rather strong positive Granger causality across all financial variables in general and for DCPS in particular may come to a large extent from the rather unusual and ad-hoc creation of financial sectors, which have been dominated by foreign banks in the transition countries. The opening-up of these countries after decades of no free market access has created plenty of opportunities for banks to tap unchartered territory and provide services to new markets and customers. This development has further been encouraged by local authorities in order to attract missing know-how, technology and capital. It was further meant to raise corporate governance and competitiveness among existing local banks. As a result, foreign investors started to enter the transition banking 32The importance of the efficiency aspect gains additional support through an average correlation of 0.63
Table 5: Directions of Causality
Financial Indicator M2/GDP DCPS/GDP DCPS/GDP BA/GDP BA/GDP CFC/GDP
[1] [2] [3] [4] [5] [6]
Causality From Economic Growth to Financial Development
Albania + + + + + + Bosnia-Herzegovina + + Bulgaria + + + + + + Croatia + Czech Republic + + + + Estonia + + + + Hungary + + + - - + Latvia + + Lithuania + + + + + Macedonia - + + Poland + + + + Romania + + + + Serbia + + Slovakia + + + + -Slovenia + + + + + Austria + Germany - + Total (+, -) (6, 1) (12, 0) (16, 0) (8, 1) (8, 1) (7, 1)
Remarks: Boldface plus or minus signs (+, -) indicate the positive (negative) directional link given
by the panel heading for the indicated financial indicators at the 1% significance level; plus or minus signs (+, -) indicate a positive (negative) effect at the 5% significance level or less. Reported signs are derived from the entries in the Tables of Appendix C.
Source: Author’s calculations.
markets on a large scale at the turn of the millennium, with Austrian, German, Italian and French banks taking the lead (Gardó and Martin (2010)).
Moreover, the gradual integration into the EU or at least the promise to become a member in the future has triggered increasing FDI and trade flows, often followed by a deep integration of Eastern European countries into western supply chains. In order to finance expansionary activities of firms, financial institutions provided the necessary funding through foreign subsidiaries or local banks. The prospect of future EU accession, labelled by Luengnaruemitchai and Schadler (2007) as “halo effect” of the EU/euro area, and the sustained good medium- and long-term economic prospects of the region (despite of rising economic imbalances in some countries in the run-up to the crisis) seem to have bolstered confidence among investors to set up shop in Eastern Europe over the middle to long-term.
6
Conclusion and Policy Implications
This paper examines the financial development and growth relationship for 15 Eastern European economies during 1994 – 2014 through a panel Granger causality analysis with bootstrapped Wald tests, which accounts for cross-sectional correlation and country-specific heterogeneity.
By comparing overall results in terms of causality direction, the significance of the Wald tests as well as the size of the estimated coefficients, we can conclude that finance in transition countries primarily follows economic growth. This demand-driven relationship originated in the opening-up of markets after Communist rule and has further been fu-elled by European integration, drawing in the process many new market participants into untapped territory.
In contrast, financial development exerts in the majority of countries a negative impact on economic growth, with most pronounced results found for financial monetization and credit extension. Potential reasons for such a negative causality consist, for instance, in the still existing persistence of soft budget constraints and ill-advised credit extension by domestic and often state-owned banks in several Eastern European economies. Conversely, countries with more sophisticated regulatory systems and mature financial markets, such as the Baltics, seem to rather profit from financial deepening.
Moreover, our results provide evidence that in the past a strong dominance of foreign banks may have enhanced efficiency and contributed to financial stability. However, in order to profit from further financial deepening in markets with strong foreign bank exposure, appropriately developed financial regulation and banking supervision need to be expanded within and across country borders. Experience shows that bank-based financial systems with in the majority foreign-owned assets may also pose severe risks for financial stability in times of economic distress (Winkler (2009)).
To achieve additional resilience against shocks to the banking system and ultimately economic growth in Eastern Europe, other key elements of more mature financial markets need to either be strengthened or progressively installed. Even though the development of stock markets did not seem to play a major role for economic growth in early stages of transition (Fink et al. (2009); Hagmayr and Haiss (2007)), they have recently been linked in the literature to fostering growth in middle-income countries (Shen and Lee (2006)) and in more advanced economies (e.g. Yu et al. (2012); Peia and Roszbach (2015)). Leaving the period of transition further behind, the development of capital markets together with sophisticated regulatory systems may thus be the next step towards a more sustainable growth experience along with an appropriate amount of financial sector depth.