HAL Id: hal-00304126
https://hal.archives-ouvertes.fr/hal-00304126
Submitted on 22 Apr 2008HAL is a multi-disciplinary open access
archive for the deposit and dissemination of sci-entific research documents, whether they are pub-lished or not. The documents may come from teaching and research institutions in France or abroad, or from public or private research centers.
L’archive ouverte pluridisciplinaire HAL, est destinée au dépôt et à la diffusion de documents scientifiques de niveau recherche, publiés ou non, émanant des établissements d’enseignement et de recherche français ou étrangers, des laboratoires publics ou privés.
Effects of dust storms on microwave radiation based on
satellite observation and model simulation over the
Taklamakan desert
J. Ge, J. Huang, F. Weng, W. Sun
To cite this version:
J. Ge, J. Huang, F. Weng, W. Sun. Effects of dust storms on microwave radiation based on satellite observation and model simulation over the Taklamakan desert. Atmospheric Chemistry and Physics Discussions, European Geosciences Union, 2008, 8 (2), pp.7931-7951. �hal-00304126�
ACPD
8, 7931–7951, 2008 Dust effects on microwave radiation J. Ge et al. Title Page Abstract Introduction Conclusions References Tables Figures ◭ ◮ ◭ ◮ Back CloseFull Screen / Esc
Printer-friendly Version Interactive Discussion Atmos. Chem. Phys. Discuss., 8, 7931–7951, 2008
www.atmos-chem-phys-discuss.net/8/7931/2008/ © Author(s) 2008. This work is distributed under the Creative Commons Attribution 3.0 License.
Atmospheric Chemistry and Physics Discussions
Effects of dust storms on microwave
radiation based on satellite observation
and model simulation over the
Taklamakan desert
J. Ge1, J. Huang1, F. Weng2, and W. Sun3
1
College of Atmospheric Sciences, Lanzhou University, Lanzhou, China
2
NOAA/NESDIS, Camp Springs, MD, USA
3
Dept. of Atmospheric Sciences, Hampton University, Hampton, VA, USA
Received: 17 March 2008 – Accepted: 18 March 2008 – Published: 22 April 2008 Correspondence to: J. Huang ([email protected])
ACPD
8, 7931–7951, 2008 Dust effects on microwave radiation J. Ge et al. Title Page Abstract Introduction Conclusions References Tables Figures ◭ ◮ ◭ ◮ Back CloseFull Screen / Esc
Printer-friendly Version Interactive Discussion Abstract
Effects of dust particles on microwave radiation over the Taklamakan desert are stud-ied with use of measurements from the Advanced Microwave Scanning Radiometer (AMSR-E) on the EOS Aqua satellite and a microwave radiation transfer model. Eight observed cases show that the signal from atmospheric dust can be separated from the
5
surface radiation by the fact that the dust particles produce stronger scattering at high frequencies and depolarize the background desert signature. This result of satellite data is consistent with the model simulation.
1 Introduction
Taklamakan is the second largest desert in the world and a major source of dust
10
aerosols in East Asia. The strong winds often stir up surface sand, lift small parti-cles and trigger monster dust storms. The most serious dust storms, called blind dust storms, can cause near-zero visibility. There are nearly 60 sandy days throughout a year over Taklamakan desert, and most of dust particles are transported into the atmo-sphere and form a layer of dust aerosols. These dust particles have been recognized
15
as important atmospheric constituents because dust particles influence the global cli-mate by scattering and absorbing solar radiation, and absorbing and emitting outgoing longwave radiation (Twomey et al., 1984; Albrecht, 1989; Resenfeld et al. 2001; De-Mott et al., 2003; Huang et al., 2006; Slingo et al., 2006). Recently, Huang et al. (2007) use the Cloud-Aerosol Lidar and Infrared Pathfinder Satellite Observations (CALIPSO)
20
to monitor the dust aerosols originated from the Taklamakan desert and point out that these dust plumes even can sack up against the northern slope of Tibetan Plateau, these dust plumes over Tibetan Plateau may alter the atmospheric circulation and lead to an earlier onset and intensification of the Indian monsoon (Lau, K.-M., and K.-M. Kim, 2006). The aerosols associated with dust storms can also pose a serious health
25
ACPD
8, 7931–7951, 2008 Dust effects on microwave radiation J. Ge et al. Title Page Abstract Introduction Conclusions References Tables Figures ◭ ◮ ◭ ◮ Back CloseFull Screen / Esc
Printer-friendly Version Interactive Discussion and predict their evolution for both climate and environment researches.
Several techniques have been developed for detecting and tracking dust storms. One of the detection methods is based on brightness temperature differences (BTD) either in two or three thermal-infrared channels (Prata, 1989; Ackerman, 1997; Legrand et al., 2001; Prata and Grant, 2001). This approach enables people to discriminate dust from
5
the clear sky over oceans and land. Limited work has been done on the sensitivity of microwave radiation to aerosols including volcanic ash (Delene et al., 1996) and in particular dust storms (El-Askary, 2003). The lack of interests in using microwave measurements for dust storm detection may be due to incomplete knowledge on dust particle size relative to the wavelength (or size parameter). In general, microwave
10
radiation can penetrate through the dust storm with little attenuation when the size parameter is small. From recent in-situ measurements, the dust aerosols can be as large as a millimeter size. Such particles can also be charged as well (Yang et al., 2003).
El-Askary (2003) studied dust storms using Tropical Rainfall Measuring Mission
15
(TRMM) Microwave Imager (TMI) data. At microwave frequencies, dust particles could scatter significant amount of radiation as identified by the scattering index (SI) which was developed by Ferraro and Grody (1994) for precipitation monitoring. In this study, we further examine the effects of dust storms on the AMSR-E brightness temperatures (Tb) and use the brightness temperatures to deduce the information on dust particles.
20
2 Data and model
The data used in this study are from the Advanced Microwave Scanning Radiometer (AMSR-E) onboard the NASA EOS Aqua satellite which was launched in May 2003. The AMSR-E has 12 channel polarization measurements at six frequencies in a range of 6.9 to 89 GHz. It conically scans the whole globe in two days as it ascends and
de-25
scends around the earth. The AMSR-E antenna temperature was converted to bright-ness temperatures using the method proposed by Wentz (1998). For the period of
ACPD
8, 7931–7951, 2008 Dust effects on microwave radiation J. Ge et al. Title Page Abstract Introduction Conclusions References Tables Figures ◭ ◮ ◭ ◮ Back CloseFull Screen / Esc
Printer-friendly Version Interactive Discussion 2003 to 2006, we have identified and collected eight dust storm cases (see Table 1)
over the Taklamakan desert.
The model used in this study is a dual polarized and discrete-ordinate microwave radiation transfer program (Weng, 1992), which is applied to simulate microwave radi-ation transfer in the atmosphere. The effects of dust particles on microwave radiradi-ation
5
are computed by this model with an assumption of spherical dust particle shapes.
3 Analysis and results
The particle sizes of sand and dust over the Taklamakan desert are mainly in the range from 0.002–0.2 mm (Yang et al., 2003). Strong winds not only lift small dust aerosols into the air higher than 1 km but also form a horizontal flow of large particles within
10
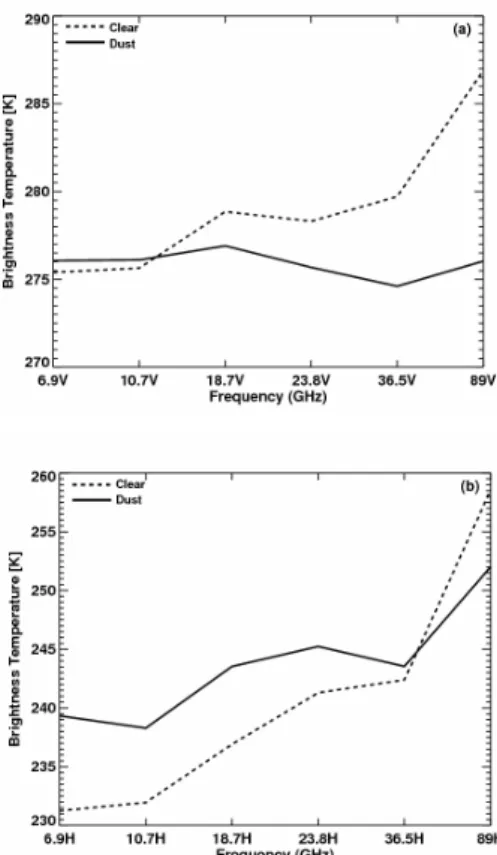
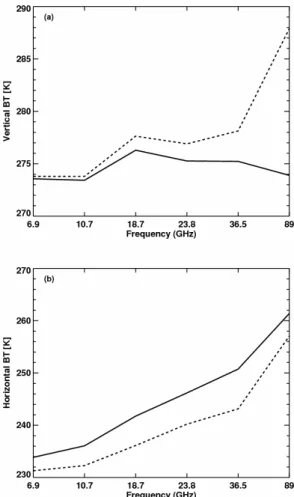
a boundary layer about 1.5 m in depth. Both dust particles suspending in the air and flowing near the surface can have a significant impact on microwave radiation transfer. In this study, we examine the effect of dust storms on the AMSR-E Tb and use it to deduce the signal of dust particles. Figure 1 compares the mean Tb for both vertical and horizontal polarizations from the dust storm case on 18 March 2005 with those
15
from the clear sky cases on March 2005. At vertical polarization (Fig. 1a), the bright-ness temperature spectra displays a distinct feature, especially at high frequency. The difference between the Tb of vertical polarization for clear and sandy days can reach 10.5 K at 89 GHz. This brightness temperature depression is presumably attributed to the extinction of the upwelling surface microwave radiation by the dust particles. At
20
low frequencies, the attenuation of microwave radiation by dust aerosol is small at the vertical polarization, because the dust particle size parameters are small at these long wavelengths. At the horizontal polarization (Fig. 1b), the brightness temperature for the dust case is initially larger than that of clear sky at lower frequencies and then be-comes smaller at 89 GHz. We can explain this oscillated feature in terms of relative
25
contributions from surface, and dust emission and scattering. For clear sky conditions, the brightness temperature at 6.9 GHz is lower because of the low surface emissivity
ACPD
8, 7931–7951, 2008 Dust effects on microwave radiation J. Ge et al. Title Page Abstract Introduction Conclusions References Tables Figures ◭ ◮ ◭ ◮ Back CloseFull Screen / Esc
Printer-friendly Version Interactive Discussion and a lack of atmospheric emission. When dust storms occur, the brightness
tem-perature increases as a result of increasing atmospheric emission from the dust. At higher frequencies, the surface emissivity is relatively higher at horizontal polarization, where the brightness temperature difference between clear and dust conditions mainly depends on whether there are large particles that produce significant scattering.
5
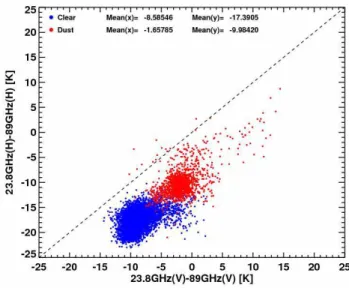
To quantify the scattering intensity, Basist et al. (1996) defines a scattering index. Here, we revise it by using the brightness temperature difference between 23.8 and 89 GHz to identify the scattering effects of dust aerosols. Figure 2 shows the scatter plot of T23.8 GHz(V)–T89 GHz (V)against T23.8 GHz (H)–T89 GHz (H) for eight cases. The
scat-tering indices using the vertical and horizontally polarized measurements are distinct
10
for dust and clear sky groups. For the clear sky groups represented by blue dots, the values of T23.8 GHz–T89 GHz are small, where the mean scattering indices are −8.59 K
and −17.39 K, for the respective different polarizations. In contrast, the mean values of T23.8 GHz–T89 GHz are much large for dust groups. At horizontal polarization, the mean scattering index is 6.93 K warmer than the clear groups. It is about 7.41 K warmer for
15
vertical polarization. Dust particles have scattering effects at high frequencies for both the vertical and horizontal microwave channels.
In Fig. 2, the mean value of T23.8 GHz (H)–T89 GHz (H) for dust groups is much larger
than that for the clear groups, which also indicates that the decrease of brightness temperature at the high frequency is due to the dust particles in the atmosphere but
20
not the surface phenomena. To use the full spectral information from AMSR-E data, we further introduce an index that is based on the three vertical polarization channels at 18.7, 23.8, and 89 GHz so that
SCAT = (18.7 V − 89 V)/2 + (23.8 V − 89 V)/2 (1)
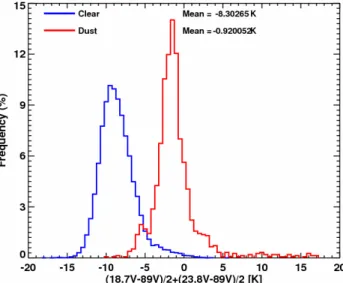
Figure 3 displays the probability density functions (PDF) of the SCAT from all
pixel-25
level data for either clear or dust cases. It appears that the clear and dust pixels can be separated between two PDFs. Smaller values of SCAT occur more frequently for clear desert, compared to these from dusty cases. The mean SCATs are −8.30 K and
ACPD
8, 7931–7951, 2008 Dust effects on microwave radiation J. Ge et al. Title Page Abstract Introduction Conclusions References Tables Figures ◭ ◮ ◭ ◮ Back CloseFull Screen / Esc
Printer-friendly Version Interactive Discussion −0.61 K for clear and dust cases, respectively. Note that for the dust cases, the SCAT
can reach 10 K. These extreme values are typically associated with strong dust storms which can lift up more and larger dust particulates and cause stronger scattering. It should be pointed out that the SCAT over Taklamakan desert is typically negative in our study but positive over Sahara from a study by Neale (1990) who used the Special
5
Sensor Microwave Imager (SSM/I) data. This difference may be due to a significant difference in chemical components of the two deserts and/or the calibration problems associated with SSM/I.
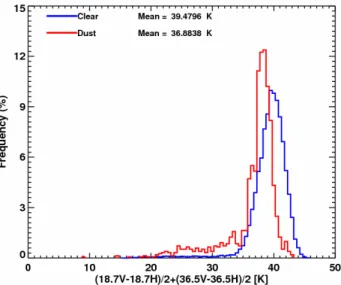
Deserts are normally characterized by a large polarization difference in brightness temperature at all microwave frequencies when atmosphere is clear. When the dust
10
storms occur, the polarization difference becomes smaller. Here, we define another index in reflecting the polarization change from the dust storms, viz.,
PTD = (18.7 V − 18.7 H)/2 + (36.5 V − 36.5 H)/2, (2)
Figure 4 plots the frequency distribution of the polarization difference for clear and the dusty cases. For clear cases, the mean value of the expression is 39.48 K, which is
15
slightly greater than the mean value of dusty cases of 36.72 K. In a dust storm, the non-spherical dust particles in the air and near surface can distribute randomly. These randomly distributed particles can emit and scatter microwave radiation to all directions, therefore depolarizing surface radiation as shown in Fig. 5. Note that the presence of dust particles does not significantly depolarize surface radiation at high frequencies,
20
because at high frequencies surface polarization difference is not significant.
To further elucidate the scattering properties of dust particles, simulations were con-ducted using the radiative transfer model. In the model calculations, the dust particles are assumed to be spheres with a normal size distribution. East Asia often has a high aerosol concentrations (Li et al., 2007), the average number concentration of dust
25
particles is extremely large over desert region and set to be 1700 cm−3 (Cheng et al.,
2004). Vertical profiles of temperature, pressure, humidity are from NCEP re-analysis data of 18 March 2005.
ACPD
8, 7931–7951, 2008 Dust effects on microwave radiation J. Ge et al. Title Page Abstract Introduction Conclusions References Tables Figures ◭ ◮ ◭ ◮ Back CloseFull Screen / Esc
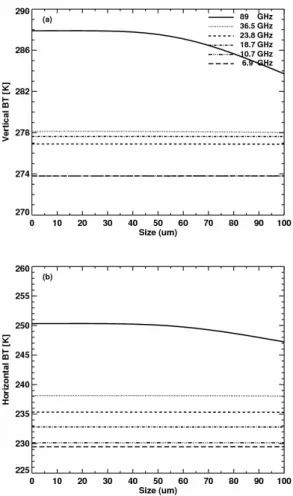
Printer-friendly Version Interactive Discussion Figure 6 shows the model simulation result of the brightness temperature variation
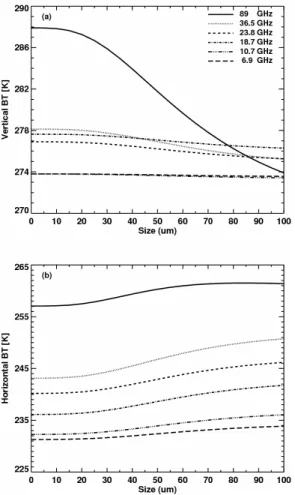
as a function of dust particle size without considering dust absorption property. The dielectric constant is 5.52 for dry sand at the six frequencies of AMSR-E. It clearly shows that both the vertical- and horizontal-polarization Tbs at the high frequency of 89 GHz are significantly reduced as dust particle size increases. In Fig. 6a, the Tb
5
is 4.2 K higher when particle size is 100µm than that in clear sky (i.e. 0 µm) and the
difference of Tb between clear and 100 µm is 3 k. For the other frequencies from 36.5 to 6.9 GHz, because of the wavelengths are much larger than particle sizes, both the vertical- and horizontal-polarization Tbs are almost invariant. Figure 7 is the same as Fig. 6, but considering dust absorption, the dielectric constant is 5.52–0.024i. Both
10
scattering and absorption cause the vertical-polarization Tb at 89 GHz to be reduced rapidly with the increase of particle size. As shown in Fig. 7a, the difference of Tb between clear (0µm) and 100 µm particle size conditions can reach 14 K for 89 GHz.
For 36.5, 23.8 and 18.7 GHz, the absorption of dust can also damp the microwave radiance penetrating the dust layer and the difference of Tb between clear (0 µm) and
15
100µm conditions are 2.9 K, 1.8 K and 1.5 K, respectively. In Fig. 7b, all of the Tbs at
the six frequencies become larger and larger with the increase of particle size. Thermal emission could account for this phenomenon.
Figure 8 is the model-simulated result of clear condition of March 2005 and the dust case on 18 March 2005. Firstly, we set a clear condition and adjust the surface
emissiv-20
ity of both vertical and horizontal channels for the six AMSR-E frequencies to make the simulation have the same values with satellite observed clear sky result. Table 2 shows the emissivity in the model. Comparing with Fig. 1, we can see that both the dashed lines in Fig. 1 and Fig. 8 which represent the Tb of clear sky have same values at each channel. Then, we add dust particle into the model and simulate the microwave
25
radiance which passes through the dust layer and is received by satellite sensor. In Fig. 8a, the Tb value of solid line at 89 GHz is 274 K that is much smaller than that of dashed line because of strong dust extinction effect on vertical polarized channel. The feature is consistent with it in Fig. 1a. For the horizontal channel of 89 GHz, there is
ACPD
8, 7931–7951, 2008 Dust effects on microwave radiation J. Ge et al. Title Page Abstract Introduction Conclusions References Tables Figures ◭ ◮ ◭ ◮ Back CloseFull Screen / Esc
Printer-friendly Version Interactive Discussion a difference between observation and simulation. In Fig. 1b, the Tb value of dust at
89 GHz is pronouncedly smaller than that of clear day. But in Fig. 8b, when dust is present, the Tb value of 89 Ghz is 1.3 k higher than that under clear condition. The mi-crowave brightness temperatures in the vertical polarization are not sensitive to sand particle habit, but it is sensitive to it in horizontal polarization (Hong et al., 2007). Thus,
5
the lack of accurate particle size distribution, shape and dielectric constant may intro-duce the difference of observation and simulation. We also calculated the PTD using the simulated Tb values. For clear day, the value of the expression (2) is 37.8 K and higher than that of sandy day which is 29.52 K. The model results confirm that dust depolarizes surface radiation.
10
4 Conclusions and discussions
AMSR-E brightness temperatures are analyzed for eight dust-storms over Taklamakan Desert during the period between 2003 and 2006, the impacts of dust on microwave radiation are also investigated by a radiative transfer model. Both the observed and the model-simulated results show that the brightness temperatures at high microwave
15
frequencies are depressed due to dust scattering. The dust particles also have some weak depolarization effects on surface microwave emission from deserts. This finding is significant when microwave measurements from space are combined with infrared sensor data. In an infrared algorithm, the brightness temperature differences between 8 and 11µm vs. those between 11 and 12 µm can discriminate the dust from clear sky
20
(Ackerman, 1997). However, the most common dust storms in East Asia are those caused by strong winds behind a cold front and generally coexist with cirrus. Because the visible-infrared radiance is primarily sensitive to the upper cirrus cloud layer, espe-cially when the upper-layer cirrus clouds are thick, the BTD approach can hardly detect dust underneath the cirrus clouds. Since the microwave radiation is not affected by
25
ice clouds, the change in microwave brightness temperature spectrum can be solely associated with dust particle effect when cirrus clouds and dust coexists in the
atmo-ACPD
8, 7931–7951, 2008 Dust effects on microwave radiation J. Ge et al. Title Page Abstract Introduction Conclusions References Tables Figures ◭ ◮ ◭ ◮ Back CloseFull Screen / Esc
Printer-friendly Version Interactive Discussion sphere. A multi-sensor algorithm has been recently developed to detect all dust storms
using VIS-IR (visible-infrared) and microwave measurements (Huang et al., 2007). It is shown that the algorithm can detect cloud-over-dust system while infrared measure-ments are only for the cloud-free-dust system.
Acknowledgements. This research is supported by National Science Foundation of China
un-5
der grant (40725015 and 40633017). The MODIS and AMSR-E microwave data were ob-tained from the NASA Earth Observing System Data and Information System, Distributed Ac-tive Archive Center (DAAC) at the GSFC.
References
Ackerman, S. A.: Remote sensing aerosols using satellite infrared observations, J. Geophy.
10
Res. 102, D14, 17 069–17 080, 1997.
Albrecht, B. A.: Aerosols, cloud microphysics, and fractional cloudiness, Science, 245, 1227– 1230, 1989.
Basist, A., Garrett, D., Ferraro, R., Grody, N. C., and Forsyth, D.: A comparison between snow cover products derived from visible and microwave satellite observations, J. Appl. Meteor.,
15
35, 163–177, 1996.
Br ´eon, F.-M., Tanr ´e, D., and Generoso, S.: Aerosol effect on cloud droplet size monitored from satellite, Science, 295, 834–838, 2002.
Cheng, T., Lu, D., Chen, H., et al.: Physical characteristics of dust aerosol over Hunshan Dake sandland in Northern China, Atmos. Environ., 39, 1237–1243, 2004.
20
Delene, D., Rose, W., and Grody, N.: Remote sensing of volcanic ash clouds using the special sensor microwave imager data, J. Geophys. Res., 101, 11 579–11 588, 1996.
DeMott, P. J., Sassen, K., Poellot, M., Baumgardner, D., Rogers, D. C., Brooks, S., Prenni, A. J., and Kreidenweis, S. M.: African dust aerosols as atmospheric ice nuclei, Geophys. Res. Lett., 30, 1732, doi:10.1029/2003GL017410, 2003.
25
El-Askary, H. M., Sarkar, S., Kafatos, M., and El-Ghazawi, T. A.: Multisensor approach to dust storm monitoring over the nile delta, IEEE Trans. on Geosci. Remote, 41, 2386–2391, 2003. Ferraro R. R. and Grody, N. C.: Effects of surface conditions on rain identification using the
ACPD
8, 7931–7951, 2008 Dust effects on microwave radiation J. Ge et al. Title Page Abstract Introduction Conclusions References Tables Figures ◭ ◮ ◭ ◮ Back CloseFull Screen / Esc
Printer-friendly Version Interactive Discussion
Huang, J., Ge, J., and Weng, F.: Detection of Asia dust storm using satellite microwave, visible and infrared measurements, Remote Sens. Environ., 110, 186–191, 2007.
Huang, J., Lin, B., Minnis, P., Wang, T., Wang, X., Hu, Y., Yi, Y., and Ayers, K.: Satellite-based assessment of possible dust aerosols semi-direct effect on cloud water path over East Asia, Geophys. Res. Lett., 33, doi:10.1029/2006GL026561, 2006.
5
Huang, J., Minnis, P., Lin, B., Wang, T., Yi, Y., Hu, Y., Sun-Mack, S., and Ayers, K.: Possible influences of Asian dust aerosols on cloud properties and radiative forcing observed from MODIS and CERES, Geophys Res. Lett., 33, L06824, doi:10.1029/2005GL024724, 2006. Huang, J., Minnis, P., Yi, Y., et al.: Summer dust aerosols detected from CALIPSO over the
Tibetan Plateau, Geophys Res. Lett., 34, L18805, doi:10.1029/2007GL029938, 2007.
10
Hong, G., Yang, P., Weng, F., and Liu, Q.: Microwave scattering properties of sand particles: Application to the simulation of microwave radiances over sandstorms, J. Quant. Spectr. Ra., 109, 684–702, doi:10.1016/j.jqsrt.2007.08.018, 2007.
Lau, K.-M. and Kim, K.-M.: Observational relationships between aerosol and Asian mon-soon rainfall, and circulation, Geophys. Res. Lett., 33, L21810, doi:10.1029/2006GL027546,
15
2006.
Legrand, M., Plana-Fattori, A., and N’Doume, C.: Satellite detection of dust using the IR im-agery of Meteosat, 1, Infrared difference dust index, J. Geophys. Res., 106, 18 251–18 274, 2001.
Li, Z., Chen, H., and Cribb, M.: Preface to special section on East Asian Studies of Tropospheric
20
Aerosols: An International Regional Experiment (EAST-AIRE), Geophys. Res. Lett., 112, D22S00, doi:10.1029/2007JD008853, 2007.
Neale, C. M. U., McFarland, M. J., and Chang, K.: Land-Surface-Type classification using microwave brightness temperatures from the special sensor microwave/imager, IEEE Trans. on Geosci. Remote , 28, 5, 829–838, September, 1990.
25
Prata, A. J.: Observations of volcanic ash clouds in the 10–12 micrometer window using AVHRR/2 data, Int. J. Remote Sens., 10, 751–761, 1989.
Prata, A. J. and Grant, I. F.: Retrieval of microphysical and morphological properties of volcanic ash plumes from satellite data: Application to Mt. Ruapehu, New Zealand, Q. J. R. Meteorol. Soc., 127, 2153–2179, 2001.
30
Rosenfeld, D., Rudich, Y., and Lahav, R.: Desert dust suppressing precipitation: a possible desertification feedback loop, Proceedings of the National Academy of Sciences, 98, 11, 5975–5980, 2001.
ACPD
8, 7931–7951, 2008 Dust effects on microwave radiation J. Ge et al. Title Page Abstract Introduction Conclusions References Tables Figures ◭ ◮ ◭ ◮ Back CloseFull Screen / Esc
Printer-friendly Version Interactive Discussion
Slingo, A., Ackerman, T. P., Allan, R. P., et al.: Observations of the impact of a major Sa-haran dust storm on the atmospheric radiation balance, Geophys. Res. Lett., 33, L24817, doi:10.1029/2006GL027869, 2006.
Twomey, S., Piepgrass, M., and Wolfe, T. L.: An assessment of the impact of pollution on global cloud albedo, Tellus, 36B, 356–366, 1984.
5
Weng, F.: A multi-layer discrete-ordinate method for vector radiative transfer in a vertically-inhomogeneous, emitting and scattering atmosphere–I. Theory, J. Quant. Spectrosc. Ra., 47, 19–33, 1992.
Weng, F.: A multi-layer discrete-ordinate method for vector radiative transfer in a vertically-inhomogeneous, emitting and scattering atmosphere—II, Appl. J. Quant. Spectrosc. Ra., 47,
10
35–42, 1992.
Wentz, F. J.: Algorithm theoretical basis document: AMSR ocean algorithm. Remote Sensing Systems, Tech. Rep., 110398, Santa Rosa, CA, USA, 28, 1998.
ACPD
8, 7931–7951, 2008 Dust effects on microwave radiation J. Ge et al. Title Page Abstract Introduction Conclusions References Tables Figures ◭ ◮ ◭ ◮ Back CloseFull Screen / Esc
Printer-friendly Version Interactive Discussion
Table 1. Eight dust cases used in this study.
Case Date GMT Lat◦N Lon◦E
1 2003/04/09 07:14 38.7–39.3 78.0–78.8 2 2004/03/12 07:02 38.9–39.3 81.0–82.0 3 2004/04/23 07:39 37.5–38.0 78.8–80.2 4 2005/01/30 06:38 38.4–39.5 81.5–83.5 5 2005/03/18 06:38 36.3–36.7 80.7–82 6 2006/03/13 06:44 38.8–39.7 78.3–81.2 7 2006/03/14 07:27 38.0–39.0 78.0–80.0 8 2006/03/15 06:31 36.8–37.7 80.5–83.0
ACPD
8, 7931–7951, 2008 Dust effects on microwave radiation J. Ge et al. Title Page Abstract Introduction Conclusions References Tables Figures ◭ ◮ ◭ ◮ Back CloseFull Screen / Esc
Printer-friendly Version Interactive Discussion
Table 2. Surface emissivity of vertical and horizontal channels for six AMSR-E frequencies.
Frequency (GHz) verticalSurface Emissivityhorizontal 6.9 0.882 0.749 10.7 0.888 0.752 18.7 0.901 0.763 23.8 0.9 0.772 36.5 0.904 0.785 89 0.94 0.83
ACPD
8, 7931–7951, 2008 Dust effects on microwave radiation J. Ge et al. Title Page Abstract Introduction Conclusions References Tables Figures ◭ ◮ ◭ ◮ Back CloseFull Screen / Esc
Printer-friendly Version Interactive Discussion
Fig. 1. Comparison of polarized brightness temperature of the dust case on 18 March 2005 and clear sky values of March 2005 as function of frequency. Upper panel is for vertical Tb, lower is for horizontal.
ACPD
8, 7931–7951, 2008 Dust effects on microwave radiation J. Ge et al. Title Page Abstract Introduction Conclusions References Tables Figures ◭ ◮ ◭ ◮ Back CloseFull Screen / Esc
Printer-friendly Version Interactive Discussion
Fig. 2. Comparison of the brightness temperature difference (in K) between T23.8 GHz(V)–
T89 GHz(V) and T23.8 GHz(H)–T89 GHz(H) for eight dust cases. The blue color represents the clear data and red the dust.
ACPD
8, 7931–7951, 2008 Dust effects on microwave radiation J. Ge et al. Title Page Abstract Introduction Conclusions References Tables Figures ◭ ◮ ◭ ◮ Back CloseFull Screen / Esc
Printer-friendly Version Interactive Discussion
Fig. 3. Comparison of the microwave scattering index i.e. SCAT=(18.7 V–89 V)/2+(23.8 V– 89 V)/2 between clear and dusty data. The blue color represents the clear sky. The red color is the dust cases.
ACPD
8, 7931–7951, 2008 Dust effects on microwave radiation J. Ge et al. Title Page Abstract Introduction Conclusions References Tables Figures ◭ ◮ ◭ ◮ Back CloseFull Screen / Esc
Printer-friendly Version Interactive Discussion
Fig. 4. Comparison of the microwave polarized brightness temperatures difference i.e. PTD=(18.7 V–89 V)/2+(23.8 V–89 V)/2 between clear and dusty data. The blue color repre-sents the clear sky. The red color is the dust cases.
ACPD
8, 7931–7951, 2008 Dust effects on microwave radiation J. Ge et al. Title Page Abstract Introduction Conclusions References Tables Figures ◭ ◮ ◭ ◮ Back CloseFull Screen / Esc
Printer-friendly Version Interactive Discussion
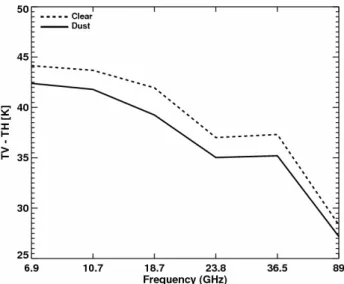
Fig. 5. Comparison of the average polarized brightness temperature difference as a function of frequency.
ACPD
8, 7931–7951, 2008 Dust effects on microwave radiation J. Ge et al. Title Page Abstract Introduction Conclusions References Tables Figures ◭ ◮ ◭ ◮ Back CloseFull Screen / Esc
Printer-friendly Version Interactive Discussion
Figure 6 Sensitivity of brightness temperature variation to dust particle
Fig. 6. Sensitivity of brightness temperature variation to dust particle size for six AMSR-E frequencies. The dielectric constant is 5.52–0i.
ACPD
8, 7931–7951, 2008 Dust effects on microwave radiation J. Ge et al. Title Page Abstract Introduction Conclusions References Tables Figures ◭ ◮ ◭ ◮ Back CloseFull Screen / Esc
Printer-friendly Version Interactive Discussion
Figure 7 Sensitivity of brightness temperature variation to dust particle
Fig. 7. Sensitivity of brightness temperature variation to dust particle size for six AMSR-E frequencies. The dielectric constant is 5.52–0.024i.
ACPD
8, 7931–7951, 2008 Dust effects on microwave radiation J. Ge et al. Title Page Abstract Introduction Conclusions References Tables Figures ◭ ◮ ◭ ◮ Back CloseFull Screen / Esc
Printer-friendly Version Interactive Discussion
Fig. 8. Comparison of simulated polarized brightness temperature of the dust case on 18 March 2005 and clear sky values of March 2005 as function of frequency. Upper panel is for vertical Tb, lower is for horizontal.