HAL Id: hal-00304736
https://hal.archives-ouvertes.fr/hal-00304736
Submitted on 1 Jan 2002HAL is a multi-disciplinary open access archive for the deposit and dissemination of sci-entific research documents, whether they are pub-lished or not. The documents may come from teaching and research institutions in France or abroad, or from public or private research centers.
L’archive ouverte pluridisciplinaire HAL, est destinée au dépôt et à la diffusion de documents scientifiques de niveau recherche, publiés ou non, émanant des établissements d’enseignement et de recherche français ou étrangers, des laboratoires publics ou privés.
land in South-Eastern Spain after cold season rainfall
N. Archer, T. Hess, J. Quinton
To cite this version:
N. Archer, T. Hess, J. Quinton. The water balance of two semi-arid shrubs on abandoned land in South-Eastern Spain after cold season rainfall. Hydrology and Earth System Sciences Discussions, European Geosciences Union, 2002, 6 (5), pp.913-926. �hal-00304736�
The water balance of two semi-arid shrubs on abandoned land in
South-Eastern Spain after cold season rainfall
Nicole Archer
1, Tim Hess
2and John Quinton
31Plant Research Unit, Division of Environmental and Applied Biology, Biological Sciences Institute, University of Dundee at SCRI, Invergowrie, Dundee DD2 5DA, UK 2Institute of Water and Environment, Cranfield University, Silsoe, Bedfordshire MK45 4DT
3Department of Environmental Science, Institute of Environmental and Natural Sciences, Lancaster University, Lancaster LA1 4YQ, UK
E-mail for corresponding author: [email protected]
Abstract
The inland, mountainous marginal areas (land abandoned by farming and colonised by shrubs) of the Iberian Peninsular, Spain, generally receive a higher rainfall than the coastal areas (Lazaro and Rey, 1991) and may store water after cold season (autumn and winter) rainfall. By measuring runoff, change of soil water content and rainfall, this study tests the hypothesis that two shrubs on two sites on abandoned land do not use all the water available after cold season rainfall. One site was on an upper alluvial slope dominated by Anthyllis cytisoides and the other on a lower alluvial slope dominated by Retama sphaerocarpa. The root systems of A. cytisoides and R. sphaerocarpa penetrate to 3 m and 20 m, respectively. A. cytisoides senesces during the dry season and R. sphaerocarpa is evergreen. The water balance is dominated by high actual evapotranspiration (ET), which is limited by rainfall. Reference evapotranspiration was high; runoff was low and soil water storage occurred above 2 m depth. ET and water storage were highest under A. cytisoides shrubs. Runoff was lower on the ‘Anthyllis’ site. The spatial variability of soil water is high and the problems of its measurement are discussed. The quantity of rainfall infiltrated was greater under shrubs than grass-areas, suggesting that shrub roots facilitated preferential flow. The growing season of A. cytisoides began when water was available in the upper soil layers and senescence occurred when the upper soil layers dried to less than 4 % water content. A.
cytisoides, therefore, relies on water from these layers. The main growth of R. sphaerocarpa occurred when the upper soil layers were
relatively dry, so that R. sphaerocarpa must extract water from deeper layers. Results suggest that A. cytisoides accumulates rainfall and runoff and directs water to lower layers for later use, while R. sphaerocarpa extracts water from deeper soil layers. By mid-summer both shrubs had extracted all the available water accumulated in the upper soil layers from cold season rainfall.
Keywords: water balance, neutron probe, patchy vegetation, mosaic vegetation, Spain, semi arid, Anthyllis cytisoides, Retama sphaerocarpa
Introduction
Water as a resource in south-eastern Spain is becoming scarcer, due to climatic and land-use change. In the Mediterranean Region, rainfall is generally decreasing (Palutikoff, 1999) while temperatures are increasing. Based on tree ring indices from Sierra de Cazorla in the south and the Pyrenees in the north of Spain, Puigdefábregas and Mendizabal (1998) showed that since the 17th century autumn-winter rainfall has declined while temperatures have mainly been increasing. From instrumental records of the Mediterranean between 1978 and 1993, Oñatate-Rubalcaba (1993) reported a decrease in annual rainfall and a general annual increase in temperature.
Alongside such a drying trend, land use has been changing rapidly. In the first half of the 20th century, the rural areas of south-eastern Spain became over-populated, so that agriculture encroached onto marginal land. Increased livestock stocking densities exhausted the grassland and soil erosion followed (Puigdefábregas and Mendizabal, 1998). Since the 1960s, emigration has led to progressive land abandonment and a patchy vegetation has developed, where ‘steppic’ shrubs, such as Artemesia herba-alba, Artemesia
campestris, Retama sphaerocarpa, Anthyllis cytisoides and Rhanterium suaveolens are interspersed by grass and/or bare
ground (Puigdefábregas and Mendizabal, 1998). Influenced by the agricultural policies of the European Union and the
local governments of Spain, forest plantations are spreading into areas of marginal land.
These marginal lands are often situated in mountainous and hilly regions where rainfall is often high. For example, in Almeriá Province, precipitation at the coast is 150 mm while inland, on the summits of the mountain ranges, it is 650 to 700 mm (Lazaro and Rey, 1991). The importance of these areas for collecting and storing rainfall and runoff in the past is demonstrated in a survey of the aljibes (Moorish cisterns) in Almería province, by Van Wesemael et al.(1998), who found that the aljibes were concentrated on the slopes of marginal areas, such as the Sierra de los Filabres, the Sierra de Gador and Sierra de Gata. Today, in the relative absence of studies of shrubland areas, it is not known whether water is stored within the slopes of these marginal areas.
Investigation of the hydrological effects of such marginal land has been focused mainly upon tree cover, such as Benayas (1998), Bergkamp (1998), Domingo et al. (1994), Piñol et al. (1991), Koechlin et al.(1986), Rambal (1984) and Vachaud et al. (1981). Expansion of forest and shrubland can lead to an increase in evapotranspiration and reduction in total runoff. Puigdefábregas and Mendizabal (1998), using data from southern France and Spain, show that for rainfall of less than 400 mm annually, land covered in forest and shrubs would yield virtually no drainage. On the other hand, forest and shrubland facilitate infiltration by intercepting runoff (Valentin and Herbés, 1999) and increase the concentration of rainfall to the base of plants by stemflow (Martinez-Meza and Whitford, 1996 and Domingo et al., 1998); this can cause localised groundwater recharge. The effect of the shrubs that are now colonising abandoned land and increasing ground cover has been studied only by Soto and Diaz-Fierros (1997) who investigated the effect on the soil water balance of throughfall in gorse (Ulex europeaus, L.) and by Belmonte-Serrato and Romero-Diaz (1994), who studied the spatial and temporal behaviour of interception flows in Rosmarinus officinalis, Thymus vulgaris, Pinus
halepensis and Juniperus oxycedrus. However, this research
takes no account of the non-continuous distribution of shrubs in the drier (<400 mm annual rainfall) Mediterranean areas, where shrubs are interspersed by bare areas or grass.
By quantifying the total water balance of two areas on a slope dominated by two leguminous shrubs, Retama
sphaerocarpa and Anthyllis cytisoides, interspersed with
grass and bare ground, in an area of marginal land in south-eastern Spain, the present study tests the hypothesis that shrubs do not use all the water available after cold season rainfall (most rain in the Mediterranean area falls during autumn and winter). These shrubs were chosen because of the differences in their rooting depths, to determine whether
shrubs with greater rooting depths encourage greater depths of water infiltration and abstraction. This study will increase the understanding of natural vegetation dynamics in south-eastern Spain, ultimately to improve land management practices for water conservation in these marginal areas.
Methodology
STUDY SITE
The field sites are within the Rambla Honda Experimental Station in Almería Province of south-eastern Spain (37º 08´ N, 2º 22´ W, 630 m altitude), in the contact zone between the south slope of the Filabres range and the Neogene depression of Sorbas-Tabernas, in the eastern part of the Betic Cordillera (Domingo et al., 1996). The Rambla Honda is an ephemeral river (rambla) which drains a basin of 30.6 km2 (Puigdefábregas et al., 1996). The experimental
area is in the lower part of the basin and has a south-easterly aspect. The valley comprises a catena of soil and vegetation, where Stipa tenacissima L. tussocks dominate the upper slopes, alluvial fans in the midslopes are populated mainly by Anthyllis cytisoides L. shrubs and the lower alluvial fans and drainage channels are dominated by Retama
sphaerocarpa. L. Boiss. The soils have poorly developed
pedogenic horizons and have been classified as Eutric Fluvisols and Eutric Regosols on the lower part of the fans and Eutric Leptosols on the upper fans and hillslopes (Puigdefábregas et al., 1996). An intensive field study of the Rambla Honda site (Puigdefábregas et al., 1996) found that these two soil groups have values of pH ranging from pH 6.5 to pH 8 and low values of electrical conductivity, cation exchange capacity and water holding capacity. From geographic and topographic interpretation of 30 years’ data from 166 meteorological stations installed in the Almería province, Lazaro and Rey (1991) estimated mean annual rainfall to be 300–350 mm and mean air temperature to be 15.5–16.5ºC. Rainfall occurs mainly in the autumn and winter between September and February and, normally, spring rainfall precedes a pronounced dry season from May to September. Rainfall has a high temporal and spatial variation.
The field sites each included a grass-dominated area adjacent to a shrub-dominated area. This enabled determination of any shrub effects on the total water storage in comparison with a grass-dominated area, where climate and soils were considered to be the same. The ‘Anthyllis site’, located on an upper alluvial fan, faced north-west and with a slope angle of approximately 8º. The shrub-area was dominated by Anthyllis cytisoides L. (Plate 1), a perennial leguminous drought deciduous cheamophyte up to 1.10 m
Plate 2. The Retama site in the Rambla Honda. R. sphaerocarpa shrubs and part of the adjacent grass-area. The white tubes are the sensor
cables.
Plate 1. The Anthyllis site in the Rambla Honda. A. cytisoides shrubs in flower with part of the grass-dominated area in the foreground. The
white tubes are the sensor cables, which were held above ground, so that runoff conditions were kept as natural as possible.
high (Alados, 1996). It has a branching root system with a main tap root that has been measured in open gully walls in the Rambla Honda to a depth of 2.5 m. The ‘Retama site’ was on a west facing lower alluvial fan with slopes of 2º in the grass-area and 4º in the shrub-area; this comprised mainly Retama sphaerocarpa L. Boiss (Plate 2), a
leguminous shrub with photosynthetic stems, very few leaves (Pugnaire and Haase, 1996) and an extensive dual root system; surface roots grow radially from a main stump and very deep vertical roots are capable of abstracting water from depths of 16–20 m (Hasse et al., 1996).
METEOROLOGICAL DATA
Meteorological data were recorded on an automated meteorological station by the Estacion Experimental De Zonas Aridas, Almería, Spain, at 640 m altitude, 200 m from the Retama site and 300 m from the Anthyllis site. From 11 December 1997 to 12 May 1998, temperature, wind speed, net radiation, relative humidity, vapour pressure and rainfall were recorded at hourly intervals. Unfortunately, there was not a complete dataset throughout the period of study so that rainfall data had to be supplemented by two automatic rain gauges, installed by the University of Amsterdam (The Netherlands) on alluvial fans 100 m from each site during 11 December 1997 to 2 February 1998.
SOIL PHYSICAL PROPERTIES
Using bulk density rings, replicates of three soil cores were taken from each site at a depth of 0.5 m. Each soil core was saturated and then placed on a sand table under suctions of 2, 4, 6, 8 and 10 kPa. After being left at each pressure for 42 hours, the soil cores were weighed and soil water content was determined. This procedure was repeated, placing the soil cores on pressure membranes which were then put under suctions of 100, 200, 400, 800, 1500 kPa. Soil saturation was determined by the porous plate method (Avery and Bascombe, 1972). From these results, water release curves were constructed for each site.
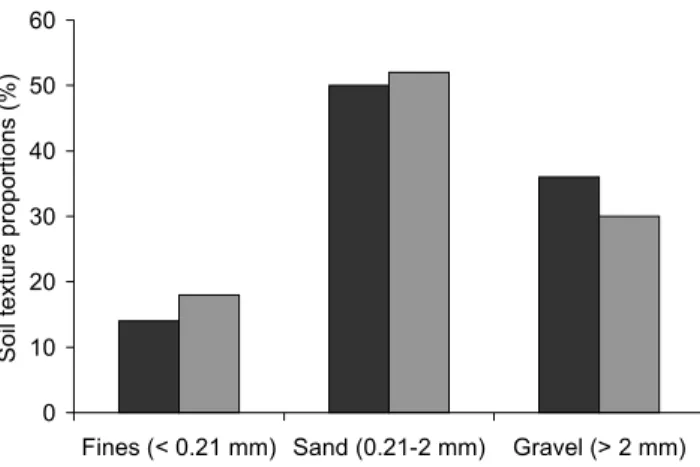
Twelve soil cores, augered to a depth of 1 m on each site were divided into four layers of 0.25 m. For each layer soil texture was determined by dry sieving, using sieve sizes of 2 mm and 0.21 mm. As there were few aggregates, dry soil passed easily through these sieves but soil could not be separated easily below a sieve size of < 0.21 mm. Particle sizes were categorised as gravel (> 2 mm), sand (2 mm to 0.21 mm), and fines (< 0.21 mm).
SOIL WATER CONTENT AND WATER POTENTIAL MEASUREMENT
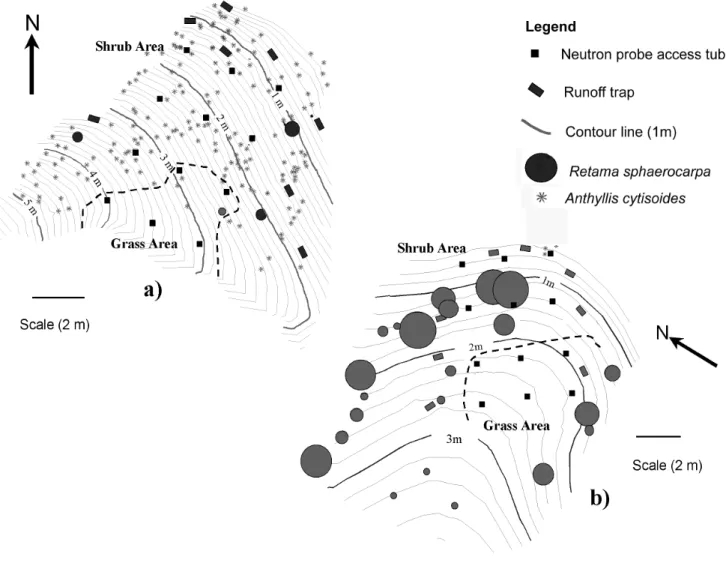
In the spring of 1996, 12 aluminium neutron probe access tubes were installed in a grid (three tubes across slope and four down slope) on each site to a depth of 3 m (Fig. 1 a, b). To reduce disturbance of the soil, the tubes were installed using reamers and a rammer as explained in Bell (1976).
Soil water content of each access tube was determined using a neutron probe (Didcot Instruments, Abingdon, U.K). Measurements began on 11 December 1997 and continued until July 1998. Water content at each access tube was measured one day after a rain event (> 5 mm), then five days after a rainfall event and then approximately every two weeks thereafter. Readings were taken at 0.25 m intervals
to a depth of 2.75 m. Within the measurement period, a total of 16 measurements were made for each access tube.
The neutron probe was calibrated in the laboratory using a modification of the drum procedure (Greacen et al., 1981; Lal, 1979). Calibration was carried out on a drum of initially dry soil of even bulk density, which was then slowly wetted up to 18% water content; as water content was increased, neutron probe measurements and soil samples were taken to estimate soil water content. Soil samples were taken horizontally with a tree corer through holes bored into the side of the drum. In this way very little soil was removed each time a measurement was taken and consequently measurements at different soil water contents could be taken with relatively little soil disturbance. As soil water content in the field never exceeded 12%, it was sufficient to calibrate the neutron probe for soil water contents below 18%.
The linear regression of the drum calibration was compared with the standard calibration curve for sand, gravel and silt (Bell, 1976). A t-test showed that there was no significant difference between the standard and the drum calibration (t = –2.35, n = 14, p = 0.034).
The volumetric soil water contents were estimated by Eqn. 1, (Bell, 1976):
(1)
θ is the volumetric water fraction at subsequent 0.25 m depth intervals, i, to the bottom of the access tube. fi is the layer factor, which is normally the distance between the half intervals on either side of the appropriate measuring depth, 0.25 m in this study, n is the number of intervals down the soil profile between the first soil surface measurement to the measurement above the last bottom measurement; in the present case, it is nine.
As the neutron probe was not available at the beginning of the autumn, gypsum blocks were installed to give an indication of water infiltration during the cold season rainfall. They were installed in three groups of four blocks outside and within shrubs; each group was positioned at depths of 0.25 m to 1 m and were recorded by a datalogger every half hour.
At the beginning of September, before the autumn rainfall, soil samples were taken between 1 m and 2 m depth from two soil profiles (one on each site), to check for availability of soil water at these depths. The water content of these samples was measured gravimetrically.
RUNOFF MEASUREMENT
+
+
=
∑
= = 9 25 . 0 2 2 1 1 n i i if
f
f
S
θ
θ
θ
Fig. 1. (a) The Anthyllis site, showing the installation of neutron probe access tubes and runoff traps. (b) The Retama site, showing the
installation of the neutron probe access tubes and runoff traps. Surface runoff measurement. The thick dotted black line on the site maps delineate the neutron probe tubes that are considered to be in grass and shrub areas.
Eight runoff traps, 0.5 m wide, were installed around the edge of the grid of access tubes to collect the runoff from the area instrumented with access tubes and each trap was connected to two 30-litre drums. After every rainfall event, these drums were emptied and the amount of runoff for each trap was recorded. The sizes of the micro-catchments, estimated by measuring the maximum slope length of each runoff trap, ranged from 14.9 to 31.7 m and 6.3 m to 14.7 m on the ‘Retama’ and ‘Anthyllis’ sites, respectively. The distributions of these troughs are shown in Fig.1 a, b. Catchment areas were estimated for each runoff trap from detailed site maps.
After each rainfall event, the average runoff depth was calculated from the runoff per m2 from each runoff trap,
followed by the average of the eight traps on each site.
WATER BALANCE
The water balance equation considered in this study was: (2) where ∆S is the change in stored soil water over a period of time, P is the precipitation, R is surface runoff, ET is actual evapotranspiration and D is drainage of water.
Precipitation, change in stored soil water and runoff were all measured in the field. The deepest measurement points (2.75 m) for all access tubes were monitored for any drainage past the measurement zone of the access tubes. Of the 24 access tubes, only two, one in the ‘Anthyllis’ site shrub-area and the other in the ‘Retama’ site shrub-shrub-area had an increase in soil water of 1.6% and 2.4%, respectively. The wetting front, even during the heaviest rainfall in December
D
ET
R
P
S
=
−
−
−
∆
1997, was not detected at the bottom of any tube; therefore, drainage was estimated to be zero. Actual evapotranspiration (ET) was, thus, estimated by a simplified water balance Eqn. (3),
(3) REFERENCE CALCULATIONS
Reference evapotranspiration, ETo, was calculated by the Penman-Montieth method from daily meteorological data using the methods of Allen et al. (1998). The reference evapotranspiration is the evapotranspiration from “a hypothetical crop with an assumed height of 12 cm, a fixed canopy resistance of 70 sm–1, and an albedo of 0.23, closely
resembling the evapotranspiration from an extensive surface of green grass of uniform height, actively growing, completely shading the ground and not short of water” (Allen et al., 1994).
PHENOLOGY OF R. SPHAEROCARPA AND A. CYTISOIDES
Growth, flowering and senescence of shrubs on each site were monitored each time neutron probe measurements were taken, when new growth, flowers and loss of leaves were recorded.
Results
METEOROLOGICAL DATA
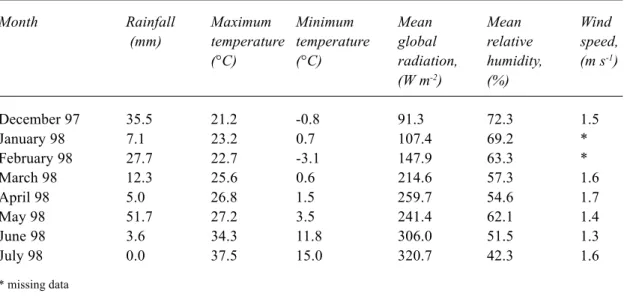
Most of the rainfall for the 1997 winter occurred during September 1997; an unusually high amount (162 mm) falling over only five days caused flooding in the valley (Fig. 2). During the period of neutron probe measurement, from 11 December 1997 to 2 July 1998, rainfall totalled 131.4 mm; the largest monthly amount, 51 mm, fell in May 1998. The monthly average rainfall, maximum and minimum temperatures, global radiation, relative humidity and wind speed from 1st December 1997 to 31st July 1998 are shown in Table 1. Maximum temperatures and global radiation increased gradually from December to May. Rainfall in May was associated with an increase in relative humidity. SOIL PHYSICAL PROPERTIES
The soil on both sites was predominantly sandy. The ‘Retama’ site had significantly (n = 12, p = 0.003) more gravel than the ‘Anthyllis’ site which had significantly (n = 12, p = 0.002) more fine particles than the ‘Retama’ site (Fig. 3). The sand fraction between the two sites was not
significantly different. The soil bulk densities at the ‘Anthyllis’ and ‘Retama’ sites were 1.46 g cm–3 and
1.53 g cm–3 respectively.
Field capacity (taken to be the water content at –33 kPa) was 14% and 12% (by volume), permanent wilting point (at –1500kPa) was 3% and 4% and the available water capacities were 11% and 8% for the ‘Anthyllis’ and ‘Retama’ sites, respectively.
SOIL WATER POTENTIAL AND SOIL WATER CONTENT
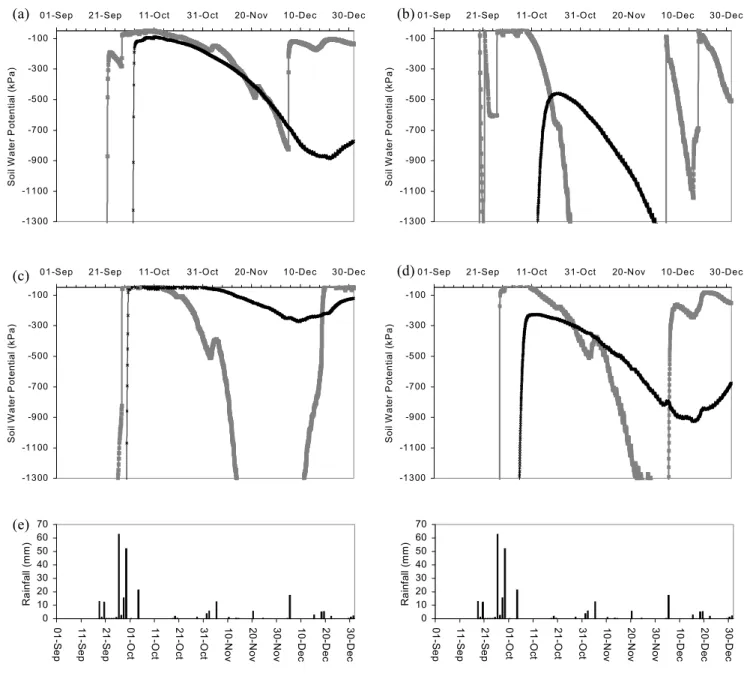
The gypsum blocks did not respond to water potentials above –50 kPa and below –1300 kPa (approximately 12% and 5% water content respectively); however, they gave a good indication of when the soil began to wet and they responded quickly to changes in soil water potential. Figure 4 shows soil water potential curves at 0.25 m and 1 m soil depth in ‘Anthyllis’ and ‘Retama’ grass and shrub areas in relation to rainfall. These graphs are taken from representative
0 40 80 120 160 200 01/09/97 01/10/97 01/11/97 01/12/97 01/01/98 01/02/98 01/03/98 01/04/98 01/05/98 01/06/98 01/07/98 Rainfall (mm)
Fig. 2. Monthly rainfall from September 1997 to July 1998.
0 10 20 30 40 50 60
Fines (< 0.21 mm) Sand (0.21-2 mm) Gravel (> 2 mm)
Soil texture proportions (%)
Fig. 3. Soil particle distribution for both sites. The black and grey
bars represent the Retama and Anthyllis sites respectively.
R
S
P
Table 1. Average monthly maximum and minimum temperatures, global radiation, relative humidity,
wind speed and rainfall.
Month Rainfall Maximum Minimum Mean Mean Wind
(mm) temperature temperature global relative speed,
(°C) (°C) radiation, humidity, (m s-1) (W m-2) (%) December 97 35.5 21.2 -0.8 91.3 72.3 1.5 January 98 7.1 23.2 0.7 107.4 69.2 * February 98 27.7 22.7 -3.1 147.9 63.3 * March 98 12.3 25.6 0.6 214.6 57.3 1.6 April 98 5.0 26.8 1.5 259.7 54.6 1.7 May 98 51.7 27.2 3.5 241.4 62.1 1.4 June 98 3.6 34.3 11.8 306.0 51.5 1.3 July 98 0.0 37.5 15.0 320.7 42.3 1.6 * missing data
groups of gypsum blocks, where the change of soil water potential has the same trend as other groups of gypsum blocks in grass and shrub areas. At 0.25 m depth, gypsum blocks under the ‘Anthyllis’ grass area were the first to respond to the relatively large rainfall on the 18 and 20 September 1997 but then were the first to dry. After the rainstorms of 26 to 29 September 1997, all layers from 0.25 m to 1 m became wet under the ‘Retama’ shrub and grass areas and the ‘Anthyllis’ shrub area. Under shrub areas at both sites, water infiltrated to 1 m soil depth before it did on the grassed areas. By the end of December, all soil layers are relatively wet from the infiltration of rainfall, except at 1 m under grass on the ‘Anthyllis’ site. After the September storms there was a drying period at all depths under grass and shrubs. Soil water potentials remained generally lower at all depths for longer under shrubs while, at 0.25 m soil depth, soil water fluctuated relatively quickly due to rainfall and then rapid drying.
The soil water content of the two profiles between 1 m and 2 m before the September rainfall ranged from 3 to 5%, indicating that soil water content below the gypsum blocks before the cold season rainfall was low.
Total soil water contents measured between 11 December 1997 and 2 July 1998 for 2.75 m profiles are shown in Fig. 5, along with the rainfalls. An analysis of variance and least squared differences of soil water content showed that the measured soil water content differed significantly between both sites and between the ‘Retama’ shrub and grass areas (n = 90, p < 0.001), but there was no significant difference between the grass and shrub areas on the ‘Anthyllis’ site. These significant differences (Fig. 5) show that the soil water content on the ‘Anthyllis’ site was consistently higher than
that at the ‘Retama’ site. The grass and shrub-areas of the ‘Retama’ site follow the same pattern of soil water change; the grass-area constantly had higher soil water content than the shrub-area. From December 1997 to February 1998, the ‘Anthyllis’ shrub-area had higher soil water contents than the grass-area but by April to May 1998, the soil water content under shrubs fell below that under grass. (Fig. 5).
After the rainfall between September and December 1997, the soil water content, relatively high at the beginning of the measurement period, decreased rapidly from February to March 1998. Rainfall of 11 mm at the beginning of February 1998 caused no change in soil water content but, after a heavy rainstorm (19 mm) in May 1998, the soil water content increased at both sites.
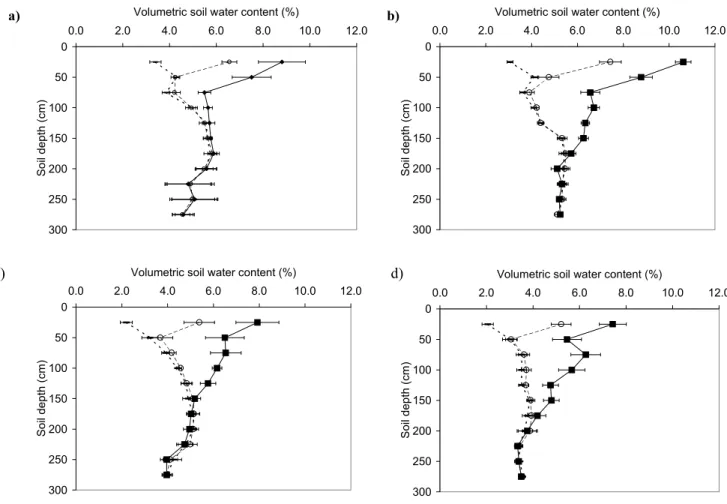
The soil water contents, averaged for grass and shrub areas for a selection of dates were graphed with mean standard errors (Fig. 6); they show the water content at the start of the measurements and then a trend of drying. In February 1998, soil water content was highest in the ‘Anthyllis’ shrub-area and particularly in the 0.25 m layer; it then decreased rapidly to 0.50 m and 0.75 m depths on the ‘Retama’ and ‘Anthyllis’ sites, respectively. By July, the 0.25 m layer was drier than the lower layers. Water infiltrated to the shallowest depth in the ‘Anthyllis’ grass-area but to greater depths in the Anthyllis shrub-areas. Below 2.25 m the driest profile was in the ‘Retama’ shrub-area. The rate of drying was the greatest on the ‘Anthyllis’ shrub-area. Little water movement is likely to have occurred at depths below 2 m, as soil water contents ranged from about 5.5 to 3.5% as compared to a field capacity of between 14 and 12%.
As soil heterogeneity is a dominant factor in the Rambla Honda, the total averages and coefficients of variation of
0 10 20 30 40 50 60 70 01 -S e p 11 -S e p 21 -S e p 01 -O ct 11 -O ct 21 -O ct 31 -O ct 10 -N o v 20 -N o v 30 -N o v 10 -D e c 20 -D e c 30 -D e c R a inf a ll ( m m ) 0 10 20 30 40 50 60 70 01 -S e p 11 -S e p 21 -S e p 01 -O ct 11 -O ct 21 -O ct 31 -O ct 10 -N ov 20 -N ov 30 -N o v 10 -D ec 20 -D e c 30 -D e c R a inf a ll ( m m ) -1300 -1100 -900 -700 -500 -300 -100
01-Sep 21-Sep 11-Oct 31-Oct 20-N ov 10-Dec 30-Dec
S o il W a te r P o te n tia l ( k P a ) -1300 -1100 -900 -700 -500 -300 -100
01-Sep 21-Sep 11-Oct 31-Oct 20-N ov 10-Dec 30-Dec
S o il W a te r P o te n tia l ( k P a ) -1300 -1100 -900 -700 -500 -300 -100
01-Sep 21-Sep 11-Oct 31-Oct 20-N ov 10-Dec 30-Dec
S o il W a te r P o te n tia l ( k P a ) -1300 -1100 -900 -700 -500 -300 -100
01-Sep 21-Sep 11-Oct 31-Oct 20-N ov 10-Dec 30-Dec
S o il W a te r P o te n tia l ( k P a )
Fig. 4. Soil water potential at 0.25 m soil depth (grey thick line) and 1 m soil depth (black thin line). a) Anthyllis site shrub area, b) Anthyllis
site grass area, c) Retama site shrub area, d)Retama site grass area. Rainfall from September to December 1997 (e) are shown to compare time of rainfall and infiltration of water.
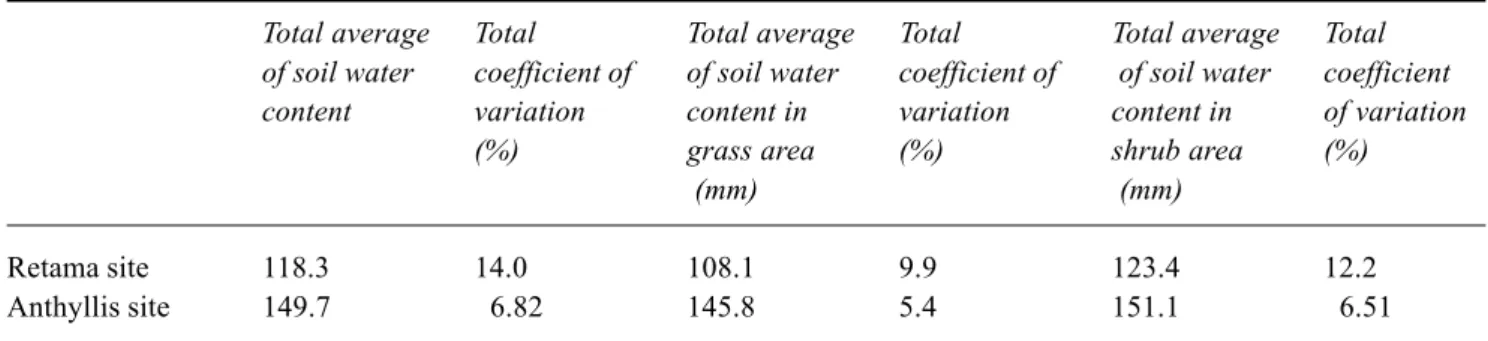
total soil water measurements were calculated for grass and shrub areas for both sites from 12 access tubes for all measurement dates (Table 2). The greatest variation in soil water content occurred at the ‘Retama’ site shrub-area. RUNOFF
Runoff was calculated for the whole of each site as it was not possible to separate runoff from shrub and grass areas. Runoff depth and runoff coefficients were calculated for each rain event and averaged over eight runoff traps
(Table 3). Runoff coefficients were calculated as a proportion of rainfall. Although 131.4 mm of rainfall fell during the measurement period, only six rainfall events produced measurable runoff. Mean runoff was 2.2 and 1.2 mm on the ‘Retama’ and ‘Anthyllis’ sites, respectively. The coefficients of variation for runoff were large; showing that variation of runoff across the two sites is high. The runoff measurements from December 1997 to July 1998 showed that the ‘Retama’ site had significantly more runoff so that runoff coefficients were significantly higher than those for the ‘Anthyllis’ site (n= 95, p = 0.003 and p = 0.001 respectively).
(a) (b)
(c) (d)
0 50 100 150 200 01/12/1997 29/12/1997 26/01/1998 23/02/1998 23/03/1998 20/04/1998 18/05/1998 15/06/1998 Precipitation (mm)
Soil water content (mm m
-2 )
Fig. 5. Soil water and rainfall events over the period of measurement. Soil water is calculated as a total of 2.75 m profiles and averaged for
each treatment. Bars represent rainfall events and sample points represent soil water content. z Anthyllis site, shrub area; Anthyllis site grass area; Retama site, shrub area; Anthyllis site, grass area. Although soil water contents were not measured continuously, but as points in time, the points are joined by dotted lines for clarity.
0 50 100 150 200 250 300 0.0 2.0 4.0 6.0 8.0 10.0 12.0 Volumetric soil water content (%)
Soil depth (cm) 0 50 100 150 200 250 300 0.0 2.0 4.0 6.0 8.0 10.0 12.0 Volumetric soil water content (%)
Soil depth (cm) 0 50 100 150 200 250 300 0.0 2.0 4.0 6.0 8.0 10.0 12.0 Volumetric soil water content (%)
Soil depth (cm) 0 50 100 150 200 250 300 0.0 2.0 4.0 6.0 8.0 10.0 12.0 Volumetric soil water content (%)
Soil depth (cm)
a) b)
Fig. 6. Average soil water contents and mean standard error at different depths of the Retama and Anthyllis sites for three different dates of
measurement. a) Anthyllis site grass area, b) Anthyllis site shrub area, c) Retama site grass area and d) Retama site shrub area. is 10/02/98,
is 27/05/98, --- is 02/07/98.
Table 2. Average soil water contents and coefficients of variation for sites, grass and shrub areas.
Total average Total Total average Total Total average Total
of soil water coefficient of of soil water coefficient of of soil water coefficient
content variation content in variation content in of variation
(%) grass area (%) shrub area (%)
(mm) (mm)
Retama site 118.3 14.0 108.1 9.9 123.4 12.2
Anthyllis site 149.7 6.82 145.8 5.4 151.1 6.51
Table 4. Summary of the water balance showing total AET, total soil water storage and total runoff totalled for periods
ranging from 13 to 56 days and total AET averaged per day.
Measurement Measure- Rainfall ETo RETAMASITE ANTHYLLISSITE
date ment (mm) (mm) Soil Runoff ET ET/ETo Soil Runoff ET ET/ETo
interval water (mm) (mm) water (mm) (mm)
(days) storage storage
(mm) (mm) 11/12/1997 138.9 176.8 05/02/1998 56 46 50.4 147.4 5.8 31.9 0.63 183.5 1.6 37.8 0.75 05/03/1998 28 8 44.8 128.2 0 27.6 0.62 157.6 0 34.3 0.77 02/04/1998 28 11 95.2 115.8 1.0 22.6 0.24 140.3 0.7 27.8 0.29 01/05/1998 29 5 116.0 102.1 0 18.7 0.16 128.4 0 17.0 0.15 27/05/1998 26 53 101.4 115.4 6.3 33.8 0.33 162.3 4.5 15.0 0.15 19/06/1998 23 6 94.3 104.0 0 17.6 0.19 130.9 0 37.6 0.40 02/07/1998 13 1 71.5 101.0 0 4.0 0.06 127.2 0 4.7 0.07 TOTAL 203 130 573.6 13.1 156.2 0.27 6.8 174.2 0.30 Table 3. Average runoff and coefficients and coefficients of variation calculated from eight runoff traps on the Retama and
Anthyllis sites for each rainfall event during the measurement period. Runoff coefficients are calculated as the proportion of rainfall that becomes runoff.
RETAMASITE ANTHYLLISSITE
Date Rainfall Average Runoff Coefficient Average Runoff Coefficient
event runoff coefficient of variation runoff coefficient of variation
(mm) (mm) (%) (mm) (%) 10/12/97 17.5 3.3 0.2 63.4 0.1 0.0 75.8 05/02/98 15.2 2.4 0.2 58.7 1.5 0.1 162.7 02/05/98 10.8 1.0 0.1 81.0 0.7 0.1 109.4 06/05/98 8.4 0.3 0.0 80.5 0.3 0.0 158.0 23/05/98 18.8 4.0 0.2 41.8 3.3 0.2 49.2 27/05/98 10.6 2.1 0.2 41.4 1.0 0.1 77.2 Total runoff (mm cm-2) 13.2 6.9
WATER BALANCE
The total actual evapotranspiration (ET), total loss of stored soil water and total water lost from runoff were averaged approximately for each month for both sites. The water balance was calculated only for the two sites, as runoff amounts could not be separated for grass and shrub treatments. Because the time of measurements depended on rainfall events, the soil water measurement periods were uneven so it was not possible to calculate the ET exactly for each month. No measurements were taken in January, so the first measurement period to be averaged was of 56 days. As only two measurements were taken in June, the water balance was calculated over 23 days and then over 13 days to the last measurement taken on 2 July 1998. Table 4 shows that the ‘Anthyllis’ site had less runoff, more soil water storage and more loss of water by ET than the ‘Retama’ site.
COMPARISON OF ACTUAL AND REFERENCE EVAPORATION AND RAINFALL
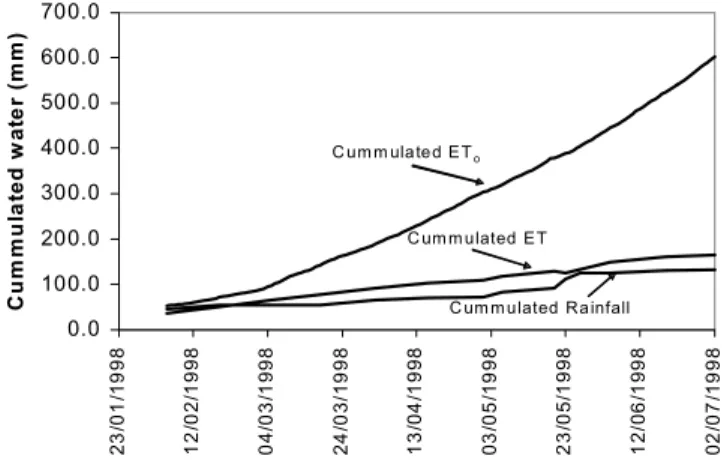
Cumulative rainfall, ET (average of ‘Anthyllis’ and ‘Retama’ sites) and ETo during the measurement period are shown in Fig. 7. ETo increased rapidly from beginning of March. The small gradient of cumulative ETo, during the cooler winter months (December 1997 to February 1998), illustrates the lower evaporative demand during the winter but, once net radiation and temperature increase from March 1998, the cumulative gradient increases quickly. However, cumulative ET remains well below ETo and follows the same pattern as cumulative rainfall. Daily ETo (Table 4) increased steadily throughout the summer but decreased during May when rainfall and relative humidity were higher and global radiation decreased (Table 1).
PHENOLOGY OF R. SPHAEROCARPA AND A. CYTISOIDES
Growth of A. cytisoides occurred mainly between January and March and flowering from March to the end of May. Senescence began in mid-June. The main growth of R.
sphaerocarpa occurred during mid-March to the end of May
and it flowered from the beginning of May to mid-June. These results are consistent with previous results from other alluvial fans in the Rambla Honda (Puigdefábregas et al., 1996).
Discussion
LIMITATION OF RAINFALL AND ET
The gypsum blocks installed showed that the soil was dry before the cold season rainfall but that water infiltrated relatively quickly after the first rainfall in September 1997. Soil water potential was low enough to cause draining, particularly under shrubs, suggesting that water would have infiltrated below the gypsum blocks. Gravimetric measurements of soil water content between 1 m and 2 m indicated that the soil at this depth was relatively dry; thus, by the time of the neutron probe measurements, the soil water content was that remaining from the infiltration from the September to December 1997 rainfall. From September to December 1997, Fig. 4 shows that drying took place at 0.25 m to 1 m after the September storms, indicating that
ET occurred down to 1 m under shrubs and grass during the
cold season.
During the period of neutron probe measurements, the only increase in soil water content followed the heavy rainfall in May but, in total, there was a net loss of soil water for both sites (Table 4). Even though it rained in January and February (Fig. 5), the continued loss of water from the soil profile at both sites probably reflected the rapid growth of grass and shrubs. Overall, ET exceeded rainfall over the measurement period, as shown in Table 4. All these results indicate that the hypothesis can be rejected; according to this investigation, shrubs used all the available cold season rainfall.
In semi-arid areas, where evaporative demand is high,
ET is limited by rainfall and it is, therefore, expected that ET and rainfall follow similar trends and remain well below ETo (Fig. 6). That rainfall limits ET is common in dry environments such as the Mojave Desert (Yoder and Nowak, 1999) and the semi-arid Mediterranean (Metochis and Orphanos, 1997; Piñol, et al., 1991).
Analysis of a 30-year rainfall record (1967-1997) near the area of the Rambla Honda (Lázaro et al., 2001) shows that the autumn rainfall of 1997 was above average and the winter 1997 rainfall was average (the average being
0.0 100.0 200.0 300.0 400.0 500.0 600.0 700.0 23 /0 1 /19 9 8 12 /0 2 /199 8 04 /0 3 /19 98 24 /0 3 /19 9 8 13 /0 4 /199 8 03 /0 5 /19 9 8 23 /0 5 /199 8 12 /0 6 /19 98 02 /0 7 /19 9 8 Cu m m u la te d w a te r ( m m ) C um m ulated ETo C um m ulated ET C um m ulated Rainfall
Fig. 7. Cumulative rainfall, ETo and average cumulative ET of the Anthyllis and Retama sites.
calculated over 30 years).The loss of all the available water from a relatively wet autumn and winter suggests that water will seldom remain stored in the soil of these slopes by mid-summer, except perhaps in much wetter years.
INFILTRATION AND RUNOFF
Previous studies of shrub and grass root systems at these two sites have shown that the shrub root systems form larger, deeper macro-pores than grass roots systems (Archer et al., 2002) and, hence, increase infiltration of water to deeper depths. This would lower the soil water potential at all depths under shrubs (Fig. 4) after the autumn storms in September 1997 by comparison with the higher water potential under grassed areas, as the lower density of macro-pores in grass areas would reduce infiltration of water to deeper depths. However, water did not penetrate beyond the rooting zone of R. sphaerocarpa and A. cytisoides, as the wetting fronts did not infiltrate deeper than 2 m (Fig. 6). Vachaud et al. (1991) observed similar soil water profiles when using a neutron probe to measure the soil water profile of a cropped degraded sandy soil in North Senegal.
Considering that the ‘Retama’ site has a greater gravel and lower silt content in the upper 1 m soil profile than the ‘Anthyllis’ site, it would be expected that infiltration of rainfall would be greater and runoff would be lower on the ‘Retama’ site. However, the ‘Anthyllis’ site has less average runoff. The higher average runoff on the ‘Retama’ site is probably because most this site is covered by grass and bare ground (Fig. 1b), whereas the ‘Anthyllis’ site has a greater cover of shrubs (Fig. 1a). There are several explanations for this: soil surface crusts found on the ‘Retama’ site would cause greater runoff rates (Hoogmoed et al., 1991); the higher shrub density on the ‘Anthyllis’ site may promote the greater infiltration under shrubs (Fig. 4) as A. cytisoides intercepts and channels 20% of gross rainfall as stem flow to the base of its roots (Domingo et al., 1998); dense shrub cover also produces more litter, which increases infiltration and reduces runoff. The large variations in runoff (Table 3) reflect the complexity of the two sites, where a mosaic of grass, shrubs and bare patches dominates the redistribution of surface water. All the processes described here are likely to be active on the sites but with different relative importance, both spatially and temporally, across the areas.
Large spatial variability of soil water
content and sampling technique of
soil water content
The large coefficient of variation of soil water content, particularly on the ‘Retama’ site (Table 2) is due to the large
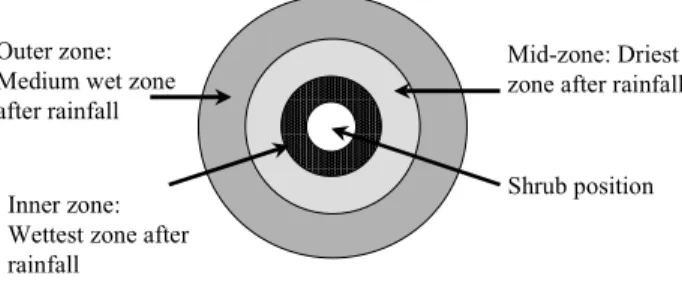
spacing between grass and R. sphaerocarpa shrubs. This is consistent with the results of Gaze et al. (1998); using neutron probe measurements in patchy vegetation dominated by Guiera senegalensis, they found a large spatial variability of soil water content. Figure 8 shows a possible reason for this result. Assuming that infiltration, due to stem flow and accumulation of runoff is greatest around the base of a shrub, the wettest area after rainfall would be around the base of the shrub. The mid-zone, which is away from the base of the shrub but under the shrub canopy, has the driest soil, as the canopy intercepts most rainfall and reduces the amount of water reaching the ground. The mid-zone would also be under the influence of shrub roots as it is nearer to the inner zone of the shrub. The outer zone would be drier than the inner zone, but wetter than the mid-zone, as the dry grass will intercept less rainfall than the shrub canopy causing more water to reach the soil than the mid-zone. The water content will, therefore, depend upon the exact positioning of the access tubes. At the shrub-area of the ‘Retama’ site, only one access tube is positioned below the canopy of R.
sphaerocarpa and the other five access tubes are
surrounding R. sphaerocarpa shrubs (Fig. 1b) so that they may represent more the effect of the grass-area and the outer edge of R. sphaerocarpa than the shrub area. This could explain the lower total water content measured in the ‘Retama’ shrub-area (Fig. 5). The gypsum blocks on the other hand showed greater differences between grass and shrub areas (Fig. 4), as they were installed directly under shrubs and outside in grass only areas.
By positioning access tubes within shrubs and others outside shrubs, Galle et al. (1999) observed that soil water storage in a tiger bush thicket is greater in the core of the thicket than on the edges after rainfall; there was also less variation between points within the core of the thicket and points between the edges of the thicket. Further, investigation of different sampling techniques in discontinuous vegetation of R. sphaerocarpa and A.
cytisoides might reduce the amount of variation in water
content.
Shrub position Inner zone:
Wettest zone after rainfall
Mid-zone: Driest zone after rainfall Outer zone:
Medium wet zone after rainfall
Fig. 8. Diagrammatic representation of water distribution under a
WATER AVAILABILITY FOR SHRUBS AND MARGINAL LAND MANAGEMENT
The large fluctuations in water potential at 0.25 m depth in grassed areas (Fig. 4) are probably due to grass cover. Water infiltrates rapidly to 0.25 m and then is quickly used by grasses as their growth begins with the cold season rainfall to early spring. The main growth of A. cytisoides (January to March) occurred when soil water was relatively high in the upper 2 m soil layer; due to its shallower rooting depths, growth is probably dependent on soil water storage in the upper soil layers. Also, A. cytisoides began to senesce once the upper 1.5 m soil layer dried to 4% water content. In contrast, the main growth period of R. sphaerocarpa (March to end May) does not coincide with availability of soil water in the upper soil layers, which suggests that R. sphaerocarpa must find water in deeper layers to enable growth. The extensive root system of R. sphaerocarpa would facilitate the uptake of water from deeper layers, enabling it to continue to function even during the dry season. The later growth of R. sphaerocarpa could also benefit from water recharge of deeper soil layers from rainfall occurring earlier in the year. Both shrubs appear to have developed different mechanisms to harvest the scarce rainfall in this dry environment. A. cytisoides accumulates rainwater and runoff and directs it to lower soil layers and R. sphaerocarpa takes water from deep soil layers, which may also be recharged from main runoff channels in the Rambla Honda.
Runoff coefficients are very low for both sites, due to the low rainfall, but also because the patchy ground cover intercepts and captures runoff. The low rainfall, the existence of flourishing shrubs within grass-areas, and little sign of erosion indicates that such a distribution of vegetation can utilise the available rainfall efficiently and stabilise the alluvial fan slopes.
Conclusion
Before the autumn rainfall, it was established that soil water content to 2 m depth was very low. With the first autumn rainfall in September, water infiltrated rapidly to 0.25 m depth and after storms, water infiltrated rapidly to 1 m. During the cold season, ET did occur, due to drying of the soil profile to 1 m, under grass and shrub cover. Even after a relatively wet cold season, there was no measured gain of water in the 2.75 m profile for the ‘Retama’ and ‘Anthyllis’ sites over the measured period, which indicates that both shrubs did not store water in the soil profile by mid-summer. Water loss is controlled by high ET, runoff is low and soil water storage occurs mainly above 2 m depth after rainfall. Variability of runoff and soil water content is high in this environment. The ‘Anthyllis’ site had a higher ET and water
storage and water use was highest under A. cytisoides shrubs. On the ‘Retama’ site, the shrub and grass areas had the same
ET. However, the grid system of access tubes may not
measure, effectively, the influence of the dispersed distribution of R. sphaerocarpa shrubs on soil water content, as access tubes were located mainly in the grass-area on the ‘Retama’ site. As the distribution of A. cytisoides shrubs was less dispersed within the shrub area, the grid of access tubes detected a greater difference between the grass and shrub-areas of the ‘Anthyllis’ site.
This study shows that A. cytisoides and R. sphaerocarpa are well adapted to their environment. A. cytisoides harvests water with its canopy and directs it to the upper soil layers where its roots are located. As water does not percolate below 2 m, virtually all the water infiltrating into the soil is available to A. cytisoides. Its growth is, therefore, finely tuned to rainfall, as the growing season occurs when water is readily available. The low soil water content in the upper 2.75 m soil layer would not sustain R. sphaerocarpa throughout the year, so that R. sphaerocarpa must rely on its root system to access deep water resources.
To obtain representative soil water measurements beneath widely distributed shrubs, a clumped distribution of access tubes may be better than the widely spaced grid system of neutron probe access tubes used in this study.
Acknowledgements
This research has been funded by the EC under its Environment Programme, contract number ENV4-CT95-0115 MEDALUS III (Mediterranean Desertification and Land Use Project) collaborative project. Thanks are due to the Consejo Superior de Investigaciones Científicas (CSIC) in Almería, particularly to Drs J. Puigdefábregas and M. Cano for allowing use of the facilities of the Estacíon Experimental de Zonas Aridas (EEZA) and the Rambla Honda field site. The help of Nigel Janes, Mark O’Brien and Samuel Leon-Desentis in field installation and of Ger Bergkamp, Carolina Boix (University of Amsterdam) and EEZA in allowing use of their rainfall data is acknowledged gratefully. In particular, Roberto Lazaro is thanked for the analysis of the Rambla Honda meteorological data and for his comments and advice.
References
Alados, C., 1996. Effects of early season defoliation of Anthyllis cytisoides (a Mediterranean browse species) on further herbivore attack. J. Arid Environ., 34, 455–463.
Allen, R.G., Smith, M., Perrier, A. and Pereira, L.S., 1994. An update for the definition of reference evapotranspiration. ICID Bulletin, 43, 1–34.
Allen, R.G., Pereira, L.S., Raes, D. and Smith, M., 1998. Crop evapotranspiration. FAO Irrigation and Drainage Paper 56. FAO, Rome. 300pp.
Archer, N.A.L., Quinton, J.Q. and Hess, T.M., (2002). Below-ground relationships of soil texture, roots and hydraulic conductivity in two-phase mosaic vegetation in south-east Spain. J. Arid Environ., 52, 535–553.
Avery, B.W. and Bascomb, C.L., 1974. Technical monograph No. 6 Soil Survey Laboratory methods. Harpenden. Adlard, Bartholomew Press, Dorking, U.K.
Bell, J.P., 1976. Neutron probe practice. Report No. 19, Institute of Hydrology Wallingford, UK.
Belmonte-Serrato, F. and Romero-Díaz, M.A., 1994. Distribución de flujos de agua en el proceso de interceptación en cuatro especies vegetales Mediterraneas y su relación con la cantidad de agua disponible en el suelo. In: Geomorfologia en Espana. J. Arnáez, J. M. García Ruiz and Gómez Villar (Eds.), Sociedad Espanola de Geomorfología. Logrono, Spain. 22–34. Benayas, J., 1998. Growth and survival in Quercus ilex l. Seedlings
after irrigation and artificial shading on Mediterranean set-aside agricultural land. Ann. Sci. Forest., 55, 801–807.
Bergkamp, G., 1998. Hydrological influences on the resilience of Quercus, spp. Dominated geoecosystems in central Spain. Geomorphol., 23, 101–126.
Domingo, F., Puigdefábregas, J., Moro, M. and Bellot, J., 1994. Role of vegetation cover in the biochemical balances of a small afforested catchment in Southeastern Spain. J. Hydrol., 159, 275–289.
Domingo, F., Van Gardingen, P. and Brenner, A., 1996. Leaf boundary layer conductance of two native species in southeast Spain. Agr. Forest Meteorol. 81, 179–199.
Domingo, F., Sánchez, G., Moro, M.J., Brenner, A.J. and Puigdefábregas, J., 1998. Measurement and modelling of rainfall interception by three semi-arid canopies. Agr.. Forest Meteorol.
91, 275–292.
Domingo, F., Villagarcia, L., Brenner, A.J. and Puigdefábregas, J., 1999. Evapotranspiration model for semi-arid shrub-lands tested against data from SE Spain. Agr. Forest Meteorol., 95, 67–84.
Galle, S., Ehrmann, M. and Peugeot, C., 1999. Water balance in a banded vegetation pattern. A case study of tiger bush in western Niger. Catena, 37, 197–216.
Gaze, S.R., Brouwer, J., Simmonds, L.P. and Bromley, J., 1998. Dry season water use patterns under Guiera senegalensis L. shrubs in a tropical savanna. J. Arid Environ., 40, 53–97. Greacen E., Correl, R., Cunningham, R., Johns, G. and Nicolls,
K., 1981. Chapter 6. Calibration. In: Soil water assessment by the neutron probe method, E. Greacen (Ed.). CSIRO, Adelaide, Australia. 50–81.
Haase, P., Pugnaire, F., Fernández, E., Puigdefábregas, J., Clark, S. and Incoll, L., 1996. An investigation of rooting depth of the semiarid shrub Retama sphaerocarpa (l.) Boiss. by labelling of ground water with a chemical test. J. Hydrol., 177, 23–31. Hoogmoed, W.B., Klaij, M.C. and Brouwer, J., 1991. Infiltration
runoff and drainage in the Sudano-Sahelian zone. In: Soil Water Balance in the Sudano-Sahelian Zone. Proceedings of the Niamey Workshop, February 1991. IASH. Publ. No. 199, 85– 98.
Koechlin, B., Rambal, S. and Debussche, M., 1986. Rôle des arbes pionniers sur la teneur en eau du sol en surface de friches de la région de la méditerranéenne. Acta Oecol. Plant., 7, 177–190.
Lázaro, R. and Rey, J., 1991. Sobre el clima de la provincia de alméria (SE Ibérico): primer ensayo de cartographia automática de medias anuales de temperatura y precipitatión. Suelo y planta
1, 61–68.
Lázaro, R., Rodrigo, F. S., Gutiérrez, L., Domingo, F. and Puigdefábregas, J., 2001. Analysis of a 30-year rainfall record (1967–1997) in semi-arid SE Spain for implications on vegetation. J. Arid Environ., 48, 373–395.
Metochis, C. and Orphanos, P., 1997. Yield of barley under Mediterranean conditions of variable rainfall. Agr. Forest Meteorol., 85, 251–258.
Martinez-Meza, E. and Whitford, W.G., 1996. Stemflow, throughfall and channelization of stemflow by roots in three Chihauhuan desert shrubs. J. Arid Environ., 32, 271–287. Oñatate-Rubalcaba, J.J., 1993. Caracterizacíon de los cambios
climáticos en la peninsula Ibérica y Canarias desde principios de siglo. Thesis, Universidad Autónoma de Madrid.
Palutikof, J.P., 1999. 11.2 Statistical downscaling of model data. Regional Indicators. Mediterranean Desertification and Land Use (MEDALUS III) Contract ENV4-CT95-0121. Final Report covering the period 1 January 1996 to 31 December 1998. 365– 412.
Piñol, J., Lledó, M.J. and Escarré, A., 1991. Hydrological balance of two Mediterranean forested catchments (Prades, northest Spain). Hydrolog. Sci. J., 36, 2–4.
Puigdefábregas, J. and Mendizabal, T., 1998. Perspectives on desertification: western Mediterranean. J. Arid Environ., 39, 209–224.
Puigdefábregas, J., Alonso, J., Delgado, L., Domingo, F., Cueto, M., Guitiérrez, L., Lázaro, R., Nicolau, J., Sánchez, G., Solé, A. and Vidal, S., 1996. The Rambla Honda field site: interactions of soil and vegetation along a catena in semi-arid southeast Spain. In: Mediterranean Desertification and Land Use, J. Brandt and J. Thornes ( Eds.) Wiley, Chichester, UK. 137–168. Pugnaire, F.I. and Haase, P., 1996. Facilitation between higher plant species in a semiarid Environment. Ecology, 77, 1420– 1426.
Rambal, S., 1984. Water balance and pattern of root water uptake by a Quercus coccifera L. evergreen scrub. Oecologia, 62, 18– 25.
Soto, B. and Diaz-Fierros, F., 1997. Soil water balance as affected by throughfall in gorse (Ulex europeus, L.) shrubland after burning. J. Hydrol. 195, 218–231.
Vachaud, G., Vauclin, M. and Colombani, J., 1981. Bilan hydrique dans le sud-tunesien. I. Caractérisation expérimentale des transferts dans la zone non saturée. J. Hydrol. 49, 31–52. Vachaud, G., Vauclin, M. and Cisse, L., 1991. Mesure in situ de
la consummation en eau de cultures pluviales par humidiétrie neutronique. In: Soil Water Balance in the Sudano-Sahelian Zone. Proceedings of the Niamey Workshop, February 1991. IASH. Publ. No. 199, 275–288.
Van Wesemael, B., Poesen, J., Solé, A., Cara, L. and Puigdefábregas, J., 1998. Collection and storage of runoff from hillslopes in a semi-arid environment: geomorphic and hydrologic aspects of the aljibe system in Almeria province, Spain. J. Arid Environ. 40, 1–14.
Valentin, C. and d’Herbés, J.M., 1999. Niger tiger bush as a natural water harvesting system. Catena, 37, 231-256.
Yoder, C. K. and Nowak, R. S., 1999. Soil moisture extraction by evergreen and drought-deciduous shrubs in the Mojave Desert during wet and dry years. J. Arid Environ., 42, 81-96.