Design of active, stable, and earth-abundant
acidic oxygen evolution catalysts
BY Michael Huynh
B.S. Chemistry, California Institute of Technology (2009)
SUBMITTED TO THE DEPARTMENT OF CHEMISTRY
IN PARTIAL FULFILLMENT OF THE REQUIREMENTS FOR THE DEGREE OF
Doctor of Philosophy in Chemistry
AT THE
Massachusetts Institute of Technology
June 2016
2016 Massachusetts Institute of Technology. All rights reserved.
SIGNATURE OF AUTHOR: CERTIFIED BY: ACCEPTED BY: MASSACHUSETTS INSTITUTE OF TECHNOLOGY
JUN 2
3
2016
LIBRARIES
ARCHIVES
Signature redacted_ ___
Department of Chemistry April 26, 2016_Signature redacted
Daniel G. Nocera Patterson Rockwood Professor of Energy, Harvard University Thesis SupervisorSignature redacted
Robert W. Field Haslam and Dewey Professor of Chemistry Chairman, Departmental Committee on Graduate Studies
3
THIS DOCTORAL THESIS HAS BEEN EXAMINED BY A COMMITTEE OF THE DEPARTMENT OF CHEMISTRY AS FOLLOWS: COMMITTEE CHAIRMAN: COMMITTEE MEMBER:
Signature redacted____
Mircea Dinca P r of ChemistrySignature redacted
I.-THESIS SUPERVISOR: Richard R. Schrock Frederick G. Keyes Professor of ChemistrySignature redacted
Daniel G. Nocera Patterson Rockwood Professor of Energy, Harvard University
5
Design of active, stable, and earth-abundant
acidic oxygen evolution catalysts
BY Michael Huynh
Submitted to the Department of Chemistry on April 29, 2016 in partial fulfillment of the requirements for the degree of Doctor of Philosophy in Chemistry
Abstract
Solar-driven electrochemical splitting of water to hydrogen and oxygen is crucial for the production of inexpensive, sustainable, and carbon-neutral fuels for future global energy requirements. Of the two half-reactions for water splitting, developing catalysts for the oxygen evolution reaction (OER) is a challenge because orchestrating the coupled transfer of four protons and four electrons is kinetically demanding. Currently, inexpensive and active OER catalysts comprised of earth-abundant elements from cobalt and nickel oxides operate in neutral and alkaline pH. These same systems corrode under acidic conditions, which is a regime important for electrolyzers and photoelectrochemical devices as well as for fundamental mechanistic studies. In this thesis, we iteratively design an active, stable, and earth-abundant acidic oxygen evolution catalyst through multiple generations. The first version focused on an electrodeposited manganese oxide (MnOx) catalyst that is stable in acid but exhibits low OER activity. Kinetic and mechanistic analysis on deposition and oxygen evolution mechanisms show that its stability manifests from strong manganese-oxygen bonds and self-healing. The second generation system improved activity while retaining acid stability by activating MnOx through a voltage cycling protocol. Structural studies show that activation induces a lower bulk manganese oxidation state and turbostratic disorder. This catalyst architecture was redesigned in the third iteration as a mixed metal oxide where functionality is decoupled into separate metals: Co was employed as the catalytic element while Mn served as the structural component. These CoMnOx films demonstrate the facile OER kinetics of Co and the acid corrosion resistance of Mn. However, these films cannot operate at high potentials since Mn dissolves as permanganate. Thus in our final fourth generation catalyst, we replaced the structural component with lead (doped with iron), an optimization discovered by potential-pH analysis. These CoFePbOx films exhibit -70 mV/decade Tafel slopes and long-term stability at 1 mA/cm2 in pH 2.5, operating at only 200 mV higher overpotential than iridium oxide. Overall, we demonstrate the ability to rationally modify and design an active, stable, and earth-abundant oxygen evolution catalyst.
THESIS SUPERVISOR: Daniel G. Nocera
7
Dedicated to everyone who helped me along the way; I promise to keep improving and pay it forward.
9
Contents
Title page 1 Thesis committee 3 Abstract 5 Dedication 7 Table of contents 9List of figures and tables 14
PREFACE AND ACKNOWLEDGEMENTS 33
CHAPTER 1: CATALYSIS FOR ENERGY STORAGE 41
1.1 Addressing global warming and rising energy consumption with renew- 42 able energy
1.2 Only solar energy is practically scalable 44
1.2.1 Solar is cost-competitive against fossil fuels 46
1.3 Energy storage is crucial for solar power 47
1.3.1 Methods for storing energy 47
1.3.2 Producing fuels 51
1.4 Water splitting for hydrogen production 52
1.5 Electrokinetics for evaluating catalysts 55
1.5.1 Normalizing activity by surface area is not sufficient 57
10
1.5.3 Tafel slopes for mechanistic analysis 61
1.5.4 Intuitive derivation of Tafel slopes 63
1.6 Catalysts for the oxygen evolution reaction 69
1.6.1 Alkaline OER 70
1.6.2 Neutral OER 71
1.6.3 Acidic OER 72
1.7 Scope of thesis 73
1.8 References 75
CHAPTER 2: NUCLEATION AND GROWTH MECHANISMS OF AN ELEC- 81 TRODEPOSITED MANGANESE OXIDE OXYGEN EVOLUTION CATALYST
2.0 Abstract 82
2.1 Introduction 83
2.2 Results 85
2.2.1 Nucleation and early growth of film 86
2.2.2 Electrokinetics 90
2.3 Discussion 95
2.3.1 Nucleation and initial growth 95
2.3.2 Mechanism of steady-state growth 98
2.4 Conclusion 104
2.4.1 Acknowledgements 104
2.5 Experimental 105
2.6 Calculations 110
2.6.1 Derivation of Tafel relation for progressive nucleation 110
11
CHAPTER 3: A FUNCTIONALLY STABLE MANGANESE OXIDE OXYGEN 117 EVOLUTION CATALYST IN ACID
3.0 Abstract 118
3.1 Introduction 119
3.2 Results 120
3.2.1 Tafel analysis 121
3.2.2 Reaction order analysis 124
3.2.3 Film dissolution analysis 128
3.3 Discussion 130
3.3.1 OER rate law in alkaline medium 131
3.3.2 OER rate law in acidic medium 134
3.3.3 OER rate law in intermediate pH medium 135
3.3.4 Stability and self-healing 136
3.4 Conclusion 138
3.4.1 Acknowledgements 139
3.5 Experimental 139
3.6 References 145
CHAPTER 4: NATURE OF ACTIVATED MANGANESE OXIDE FOR OXYGEN 151 EVOLUTION
4.0 Abstract 152
4.1 Introduction 153
4.2 Results 155
4.2.1 Electrochemical deposition and Tafel analysis 155
4.2.1.1 Constant potential deposition 155
12
4.2.1.3 Multipotential deposition 158
4.2.1.4 Cathodization 159
4.2.1.5 Cathodic deposition 160
4.2.1.6 Faradaic efficiency and stability 162
4.2.1.7 Film resistivity and purity 164
4.2.2 Mass change for electrodeposition protocols 167
4.2.3 Structural studies 171
4.2.3.1 SEM and TEM 171
4.2.3.2 X-ray photoelectron spectroscopy 172
4.2.3.3 Powder X-ray diffraction 174
4.2.3.4 X-ray pair distribution function 177
4.3 Discussion 183
4.3.1 Electrochemical activation of MnOx 184
4.3.1.1 Tafel slopes for comparing catalysts 184
4.3.1.2 Defining activated MnOx films 185
4.3.1.3 Determining the activation mechanism 186
4.3.2 Nature of activated MnOx 189
4.3.2.1 Morphology and oxidation state 189
4.3.2.2 Direct structural information by X-ray diffraction 189
4.3.2.3 Indirect structural information by pair distribution function 190
4.3.2.4 Structural foundation of activation 194
4.3.3 Performance of activated MnOx in acid 196
4.4 Conclusion 198
4.4.1 Acknowledgements 199
4.5 Experimental 199
13
CHAPTER 5: DESIGN OF AN ACTIVE, STABLE, AND EARTH-ABUNDANT 219 ACIDIC OXYGEN EVOLUTION CATALYST
5.0 Abstract 220
5.1 Introduction 221
5.2 Results 223
5.2.1 Electrochemical deposition and Tafel analysis 224
5.2.1.1 Unary metal oxide catalysts 224
5.2.1.2 Mixed metal oxide catalysts 227
5.2.2 Acid stability and Faradaic efficiency 230
5.2.2.1 Stability at low current density 230
5.2.2.2 Stability at high current densities 232
5.2.2.3 Faradaic efficiency 235
5.2.3 Physical characterization 235
5.2.3.1 Elemental analysis 235
5.2.3.2 Morphology and homogeneity 236
5.2.3.3 Powder X-ray diffraction (XRD) 240
5.2.3.4 Oxidation state 240
5.3 Discussion 243
5.3.1 Trade-off between activity and stability with MnOx 244 5.3.2 Decoupling activity from stability with CoMnOx 245 5.3.3 Independently optimizing stability with CoPbOx and CoFePbOx 250
5.3.4 Nature of stability 254
5.4 Conclusion 257
5.4.1 Acknowledgements 258
5.5 Experimental 258
14
List of figures and tables
Figure 1.1. Global mean land-ocean temperature change from the annual 42 mean (black U) and a 5-year moving average (red ).
Figure 1.2. World's primary energy supply in 2013. Coal includes peat and oil 43 shale while renewable sources include hydroelectric, geothermal, solar, and
wind.
Figure 1.3. Carbon-free and carbon-neutral energy sources compared in terms 45
of theoretical power output. Only solar energy provides enough power to practically meet future global energy consumption.
Figure 1.4. Price (in $) per watt for monocrystalline silicon photovoltaic cells. 46 Inset: A closer view at pricing in recent years.
Figure 1.5. Cost of electricity (in $/kWh) from a fully installed solar photo- 46 voltaics (using crystalline silicon) compared to that from the grid
(assum-ing 7% growth in pric(assum-ing). Areas with ample solar flux have already reached grid parity.
Figure 1.6. Energy density (by volume) and specific energy (by mass) for: (a) 49 nuclear, (b) electrochemical, and (c) chemical sources. Generally, as
en-ergy density (and specific enen-ergy) increases, it becomes harder to access that energy source due to its decreased reversibility and higher kinetic
bar-riers.
Figure 1.7. Energy density and specific capacity of Li-ion batteries over time. 50 The growth trend is linear.
Figure 1.8. Reaction diagram of storing energy where Ei is supplied to over-
54
come the overpotential (1) to store Eo. A catalyst is employed to lower the15
Figure 1.9. Storage efficiency (in %) for water splitting as a function of applied 55potential (Ej1,) beyond 1.23 V. Dotted lines provided as a guide for
compar-ing Ei, = 1.6 V to 9.0 V where the theoretical efficiency decreases from 77 to 14%.
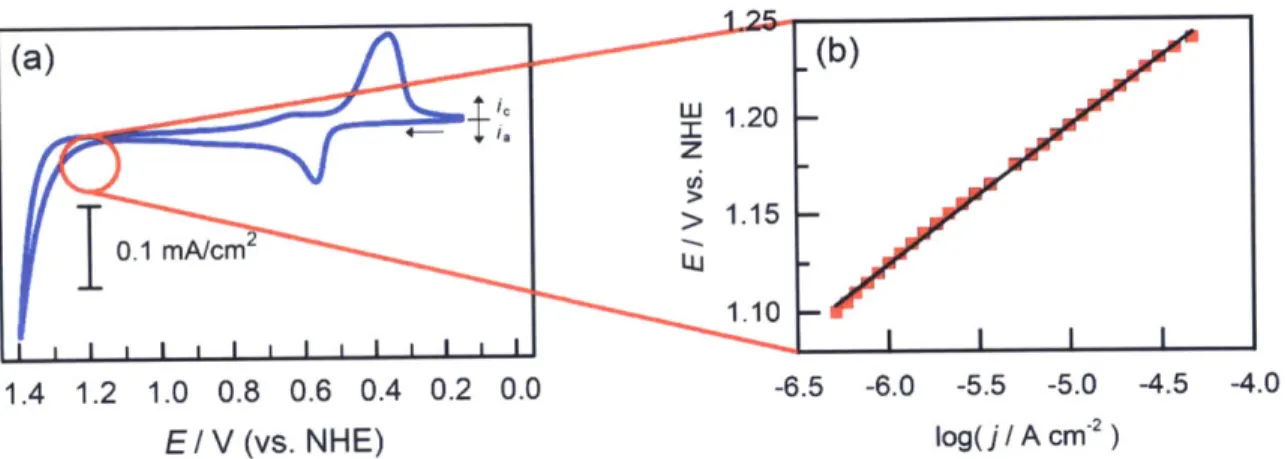
Figure 1.10. Oxygen evolution catalyzed by a manganese oxide catalyst film in 56 50 mM methylphosphonate buffer at pH 8. (a) Cyclic voltammogram
where the red circled region represents activation-controlled current for
OER
(b) Tafel plot of the same region by taking the logarithm of current density to produce a linear plot.Figure 1.11. Representative Tafel plots depicting how different slopes influ- 58 ence the activity of the catalyst. (a) Generally the lower the Tafel slope, the
better the catalyst since for a fixed potential (grey --), the catalyst with the lower slope has orders of magnitude greater current density. (b) How-ever, there may be exceptions where catalysts with higher Tafel slopes have greater current density depending on the potential (grey
)
since the exchange current density for the two films are different.Figure 1.12. Electrochemically active surface area measured by double-layer
59
capacitance. (a) Averaged anodic and cathodic current densities as afunc-tion of scan rate for MnOx films from 0 to 64 mC/cm loadings. (b) Calcu-lated double-layer capacitances as a function of MnOx catalyst loadings. As expected, thicker films have a smaller increase in surface area.
Figure 1.13. A representative cyclic voltammogram of a single one-electron 64 reversible redox couple in which the kinetic region of the CV (shaded in
light red) is isolated and then the current is logarithmized to produce a cor-responding Tafel plot with a slope of-60 mV/decade. The blue shaded re-gion in the CV is mass-transport controlled. The CV was simulated with DigiElch with the following parameters: k, = 10 cm/s, a = 0.5, D = 10-5
cm2/s, v = 0.1 V/s.
Figure 1.14. A representative cyclic voltammogram of a single one-electron 65 irreversible redox couple (red
)
where the kinetic region exhibits acorre-sponding Tafel plot with slope of- 120 mV/decade. The CV was simulated by decreasing k, to 10-1 cm/s. The reversible system is included for
compar-ison (grey' -).
Figure 1.15. A representative cyclic voltammogram of two one-electron re- 66 versible redox couples where the kinetic region exhibits a corresponding
16
Figure 1.16. A representative cyclic voltammogram of three one-electron re- 67 versible redox couples where the kinetic region exhibits a corresponding
Tafel plot with slope of-20 mV/decade.
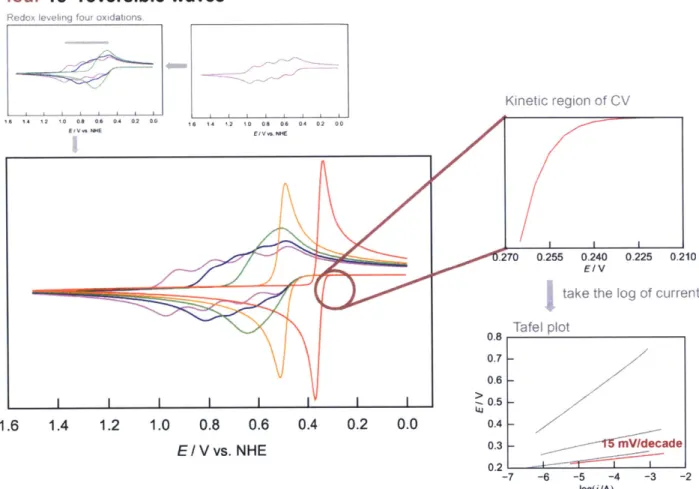
Figure 1.17. A representative cyclic voltammogram of four one-electron re- 68 versible redox couples where the kinetic region exhibits a corresponding
Tafel plot with slope of- 1S mV/decade.
Figure 2.1. Cyclic voltammograms of a 1 cm2 FTO electrode in
0.5
mM Mn21 84 and 50 mM MePi solution at (a) pH 3.0 and (b) pH 8.0, 50 mV/s scan rateshowing the Is (blue, -) and 2 0 0th (red,
)
cycles. (c) RepresentativeCV at pH 8.0 at 10 mV/s (blue, -). Region I is attributed to MnOx depo-sition while region II denotes water oxidation. For comparison, back-ground CV of same electrolyte but without Mn2
, (gray,
Figure 2.2. Powder X-ray diffraction (pXRD) taken on a 32 mC/cm2 MnOx 87 film deposited on FTO and anodized at 1.10 V in Mn2+-free 1 M Pi buffer
at pH 9 for four hours (top, red ') and of a bare FTO surface (bottom,
grey -).
Figure 2.3. Potential step chronoamperograms of platinum at
0.517
V (red, 87 ), glassy carbon at 0.5 17 V (green, ), HOPG at 0.637 V (blue,),
and FTO at 0.547 V (purple, - - - -) in a solution of 0.5 mM Mn2,
and 50 mM MePi with 1.90 M KNO3 electrolyte at pH 8.
Figure 2.4. Potential step chronoamperograms of a platinum disk electrode in 87 a solution of 0.5 mM Mn2 and 50 mM MePi with 1.90 M KNO3 electrolyte
at pH 8. Step potentials of 0.517 (red, -- -), 0.522 (yellow,
0.527 (green, ), 0.532 (blue, --- ), and 0.537 V (purple, - -- -) were applied. All experiments were preceded by an initial 5 s pulse at 0.397 V (not shown) to partially pre-charge the double layer.
Figure 2.5. Representative 5 x 5 pm AFM images of a highly oriented pyrolytic 88 graphite electrodes after being subjected to potential step polarization at
0.637 V in 0.5 mM Mn2' and 50 mM MePi with 1.90 M KNO3 electrolyte
at pH 8 for ca. (a) 0.2, (b) 0.5, (c) 1, (d) 2 (e) 4, and (f) 8 x tn, (~ 13 s).
Bar to the right of image indicates the depth with a full scale value of (a) 25, (b) 25, (c) 25, (d) 50, (e) 75 and (f) 100 nm.
Figure 2.6. Nucleus size, density, and surface coverage percentages as a func- 89 tion of the time to achieve peak current (t.a) derived from analysis of
MnOxAFMs in Figure 2.5. (a) Diameter (red, ) and height (green, ) of catalyst nuclei with error bars. (b) Percent of surface coverage (light blue,
17
)
and nucleus density (purple, A) of the5
x 5 tm HOPG surfaces.Diam-eters and nucleus densities could not be obtained for merged nuclei for t > 4 x
t.
In both figures, lines are presented to guide the eye.Figure 2.7. Landscape 1 x 1 Vm AFM image of a highly oriented pyrolytic 89 graphite electrode for passage of ca. 64 mC/cm2 at 0.637 V in 0.5 mM Mn2"
and 50 mM MePi with 1.90 M KNO3 electrolyte at pH 8. Bar to the right of
image indicates the depth with a full scale value of 100 nm.
Figure 2.8. Representative Kouteckf-Levich (K-L) plot for MnOx deposi- 91 tion on a Pt RDE in 0.5 mM Mn2", 50 mM MePi, and 1.90 M KNO3
elec-trolyte. A 2.55 mC/cm2
MnOx film was pre-deposited on the RDE prior to the experiment. The RDE was operated at 2500, 1600, 1225, 900, and 625
rpm at potentials from 0.517 (G ), 0.512 ( ), 0.507 ( ), 0.502 ( ), 0.497
( ), 0.492 ( ), 0.487 ( ), 0.482 (b), 0.477 (A), 0.472
(V),
0.467 (e),and 0.462 (g).
Figure 2.9. Tafel plot of MnOx deposition on a platinum rotating disk elec- 91 trode (RDE, surface area = 0.196 cm2) in solution of
0.5
nM Mn2" with 50 mM MePi and 1.90 M KNO3 electrolyte at pH 8. A 2.55 mC/cm
2
of catalyst film was pre-deposited on the RDE before Tafel data collection. The Tafel slope is 31.1 mV/decade. Normalized activation currents were obtained from Kouteck-Levich (K-L) analysis.
Figure 2.10. Tafel plots for potentials from 0.517 to 0.457 V in 50 mM MePi, 91 1.90 M KNO3 buffered solutions with (red, e ) and without (gray, g) 0.5
nM Mn2.
Figure 2.11. Tafel plots of MnOx film formation from 50 mM MePi, 1.90 M 92 KNO3 electrolyte at pH 8 containing: 0.010 (red, ), 0.018 (yellow, ),
0.032 (green, ), 0.056 (blue, A), 0.100 (purple, ) mM Mn 2. Activa-tion-controlled current densities
(jac)
were derived from Kouteckf-Levich analysis of steady-state data collected at multiple rotation rates. Average Tafel slope is 30.6 3.0 mV/decade.Figure 2.12. [Mn2] dependence of MnOx deposition in 50 mM MeP1 and 93
1.90 M KNO3 electrolyte at pH 8. Data were interpolated at fixed potentials
of 0.512 (red, ), 0.507 (green, ), 0.502 (blue, ), and 0.497 V (purple,
A) from Tafel plots collected for Mn2 concentrations from 0.0 10 to 0.100 mM. Average slope is 1.8 0.2.
Figure 2.13. Tafel plots of MnOx film formation from 0.5 mM Mn2 at pH 8.0 93 electrolyte containing 3.2 (red, ), 5.6 (yellow, ), 10.0 (green, ), 17.8
18
(blue, A), 31.6 (purple, V), and 56.2 mM (magenta, ) MePi and appro-priate amount of KNO3 to achieve a 2 M ionic strength.
Activation-con-trolled current densities (jac) were derived from Kouteckf-Levich analysis of steady-state data collected at multiple rotation rates. Average Tafel slope is 36.3 2.5 mV/decade.
Figure 2.14. [MePi] dependence for MnOx catalyst film growth in 0.5 mM 93 Mn2 at pH 8.0 with KNO3 adjusted to maintain an ionic strength of 2 M.
Data were interpolated at fixed potentials of 0.522 (red,
),
0.5 17 (yellow, ), 0.512 (green, ), 0.507 (blue, ), 0.502 (purple, v), and 0.497 V (ma-genta,)
from Tafel plots collected for MePi concentrations from 3.2 to 56.2 mM. The average slope is 0.0 0.1.Figure 2.15. Tafel plots of MnOx film formation from 0.5 mM Mn2 and 50 94 mM MePi with 1.90 M KNO3 electrolyte from pH 6.0
( ),
6.2 ( ), 6.4( ), 6.6 ( ), 6.8 ( ), 7.0 ( ), 7.2 ( ), 7.4 ( ), 7.6 (A),7.8 (V), 8.0
(*),8.2
(.),8.4
( ),
and 8.6(
). Activation-controlled current densities(jac) were derived from Kouteckf-Levich analysis of steady-state data col-lected at multiple rotation rates. Average Tafel slope is 31.6 2.1
mV/dec-ade.
Figure 2.16. pH dependence for MnOx deposition in 0.5 mM Mn2 with 50 95 mM MePi, and 1.90 M KNO3 electrolyte. Data were interpolated at fixed
current densities of log
j=
-5.0 (red,),
-4.4 (green,),
-3.7 (blue,),
and -3.0 (purple, A) from Tafel plots collected at pHs from 6.0 to 8.6, in-crementing by 0.2. The average slope is -117.6 1.1 mV/pH unit.Figure 2.17. Normalized potential step chronoamperograms for platinum disk 96 electrodes in 0.5 mM Mn2 and 50 mM MePi with 1.90 M KNO3 electrolyte
at pH 8. Data from Figure 2.4 was normalized to t1. and
jm.
for step poten-tials of 0.517 (red, - - ), 0.522 (yellow, ), 0.527 (green,),
0.532 (blue, -- -), and 0.537 V (purple, - -- -, For comparison,the-oretical normalized traces for instantaneous (dark grey, .- - .) and zeroth-order progressive (light grey, nucleated growth are overlaid with experimental results.
Figure 2.18. Normalized potential step chronoamperograms from data in Fig- 97 ure 2.3 of platinum at 0.517 V (red,
),
glassy carbon at 0.517 V (green,), HOPG at 0.637V (blue,
),
and FTO at 0.547 V (purple, -19
electrolyte at pH 8. For comparison, theoretical normalized traces for in-stantaneous (dark grey, . - -.) and zeroth-order progressive (light grey,
) nucleated growth are overlaid with experimental results.
Figure 2.19. Determination of the delay in nucleation onset (to). Potential step 98 chronoamperograms from Figure 2.9 were plotted as j21 vs. t to linearize
the rising portion of the current transient for GC at
0.5
17 V (green, ), HOPG at 0.637 V (blue, ), and FTO at 0.547 V (purple, - - - -) in a solution of0.5
mM Mn2' and 50 mM MePi with 1.90 M KN03
electro-lyte at pH 8. Linear fits to the rising portion produced x-axis intercepts of to = 4.1, 3.2, and 8.2 s for GC, HOPG, and FTO, respectively.
Figure 2.20. Proposed mechanism of MnOx catalyst film formation. The pre- 101 deposited MnOx film (with an average Mn oxidation state of +3.68,
deter-mined by coulometry in Table 1) first undergoes electrochemical oxidation in a two-electron, two-proton PCET minor equilibrium. The catalyst film then chemically oxidizes two Mn2'hexaaquo complexes, each in a one-elec-tron, one-proton PCET minor equilibrium to form two solution Mn3+ spe-cies that disproportionate, in the rate-limiting step, to Mn2+ and Mn*. Sub-sequent dehydration facilitates the deposition of a single Mn* site.
Figure 2.21. Tafel plot of early MnOx nucleation on a Pt disk electrode. Under 102 the SH model for progressive nucleation, the nucleation rate is
propor-tional to ta 2 (derivation in Calculations). Using tm derived from Figure
2.4 yields a Tafel plot with slope of 27.8 mV/decade.
Figure 3.1. Faradaic efficiency of OER on 10 mC/cm2 MnOx films operated 121 at 0.3 mA in 0.10 M Pi and 1.75 M KNO3 solution at various pH. 02 was
detected by fluorescence sensor for pH 2.5 (red, ), pH 7.0 (green,
),
and pH 12.0 (blue, -). Theoretical 02 traces (black, -) are calculated from total charge passed assuming 100% Faradaic efficiency. Plots are off-set by 2 h for clarity. Background sensor drift and 02leak of electrolysis cell included for comparison (grey, -).Figure 3.2. Tafel plots of the OER on 6 mC/cm2 MnOx operating in 0.10 M 122 Pi and 1.73 M KNO3 at low pH 2.5 (red, e); intermediate pH 5.5 (orange,
), 6.0 (yellow, ), 6.5 (green,
),
7.0 (light blue, ), 7.5 (blue,.),
8.0 (dark blue, m), and 8.5 (purple, +); and high pH 12.0 (magenta, ). Theoverpotential (1) was used instead of E so that plots at different pH could be displayed on the same scale. Intermediate pH plots have slopes that vary from 153 to 105 mV/decade, centered around 127 mV/decade at pH 7.0. The accessible range of potentials (and current densities) was restricted by corrosion at high potentials in some electrolyte conditions.
20
Figure 3.3. Tafel plots of OER on a 6 mC/cm2
MnOx film operated in 0.10 M 122 Pi buffer with 1.73 M KNO3 at (a) low pH of 1.0 (red,
),
1.5 (orange, ),2.0 (green, ), 2.5 (light blue, ), 3.0 (dark blue, V), and 3.5 (purple, *);
(b) intermediate pH of 5.5 (red,
:),
6.0 (orange, ), 6.5 (green, ), 7.0(light blue, ), 7.5 (dark blue, V ), 8.0 (purple, o), and 8.5 (magenta, m); and (c) high pH of 11.35 (red,
),
11.67 (orange, ), 12.00 (green,),
12.33 (light blue, ), 12.72 (dark blue, V ), 12.75 (purple, *), and 13.30 (magenta,
m).
Average Tafel slopes are (a) 653 166 mV/decade from pH 1.0 to 3.5; (b) 127 20.0 mV/decade varying from 105 mV/decade at pH 5.5 to 153 mV/decade at pH 8.5; and (c) 60.3 2.9 mV/decade from pH 11.35 to 13.30.Figure 3.4. Tafel plots of oxygen evolution on MnOx catalyst films of various 123 loadings, prepared by electrodeposition with passage of increasing total
charge, in acidic and neutral pH regimes. (a) In 0.10 M Pi and 1.90 M KNO3 electrolyte at pH 3.0 for 0 (grey, +), 6 (yellow, ), 32 (green,
),
100 (blue, A), and 250 mC/cm2
(purple,
V)
loadings; Tafel plots have an average slope of 230 8 mV/decade. (b) In 0.10 M Pi and 0.85 M KNO3electrolyte at pH 7.2 for 0 (grey, ), 0.5 (red, -), 6 (yellow, ), 32 (green, ), 100 (blue, A), 250 (purple, V), and 500 mC/cm2
(magenta, i.) load-ings; Tafel plots have an average slope of 121 2 mV/decade.
Figure 3.5. FESEM image of a MnOx film (100 mC/cm 2
catalyst loading) de- 124 posited on FTO. Scale bar, 300 nm.
Figure 3.6. Tafel plots of OER on a 6 mC/cm2
MnOx film operated in 0.10 M 125 Pi buffer at pH (a) 2.5, (b) 7.0, and (c) 12.5 with appropriate amount of
KNO3 to achieve a 2 M ionic strength. The concentration of Pi was varied
from 2.5 (red, ), 6.3 (yellow, ), 15.9 (green, ), 39.8 (light blue, ),
100.0 (dark blue, V), 251.2 (purple, 0), and 631.0 mM (magenta, i). Av-erage Tafel slopes are (a) 1642 1308 mV/decade for pH 2.5; (b) 126 10 mV/decade for pH 7.0; and (c) 50 1 mV/decade for pH 12.5.
Figure 3.7. [Pi] dependence for the OER on MnOx (6 mC/cm 2 films) oper- 125 ated over a wide pH range at (a) pH 2.5 forE = 1.467 (
),
1.497 ( ), 1.527(
), 1.557( ), 1.587(V), 1.617(e),and1.647V( ); (b)pH7.OforE= 0.960 (), 0.970 ( ), 0.980 ( ), 0.990 ( ), 1.000 ( ), 1.010
(o),
1.020 (m), 1.030 (+), and 1.040 V ( A ); and (c) pH 12.5 for E = 0.777 (*),0.792 ( ), 0.807 ( ), 0.822 ( ), 0.837
(V),
0.852 (e),and 0.867 V ( )with varying Pi concentrations from 2.5 to 631.0 mM. In all solutions, ap-propriate amounts of KNO3were added to achieve a total ionic strength of
21
2 M. Data were interpolated at fixed potentials from Tafel plots in Figure 3.6. The average slope in all three plots is zero.
Figure 3.8. pH dependence for the OER on MnOx (6mC/cm2 films) operated 127 in 0.10 M Pi and 1.73 M KNO3 at (a) acidic pH 1.0 to 3.5, at E = 1.447
( ),
1.467 ( ), 1.487 ( ), 1.507 ( ), 1.527 (V ), 1.547 (e), and 1.567V( ); (b) neutral pH 5.5 to 8.5, at log j = -6.10 ( ), -5.95 ( ), -5.80 (
),
-5.65 ( A ), and -5.50 (Y ); and (c) alkaline pH 11.35 to 13.30, at logj
-6.4 (e),-6.0 ( ), -5.6 ( ), -5.2 (A), and -4.8 ('T/). Data were interpo-lated at fixed potentials in (a) and at constant current densities in (b) and (c) from Tafel data in Figure 3.3. The average slope is: (a) zero for proton concentration dependence from pH 1.0 to 3.5; (b) -67.5 1.7 mV/pH for
E/pH from pH 5.5 to 8.5; and (c) -71.3 1.4 mV/pH for E/pH from pH
11.35 to 13.30.
Figure 3.9. Intermediate pH dependence of OER determined by potenti- 127 ostatic titration on a 6 mC/cm2
MnOx film operated in 0.10 M Pi buffer with 1.73 M KNO3. The steady-state catalytic current density was recorded
at constant potential (E = 1.30 V) as solution pH was raised in increments of ca. 0.25 pH units. At intermediate pH, the slope is 0.44.
Figure 3.10. Calibration curves correlating the full-width at half maximum 127 (FWHM) of the inorganic phosphate 31P-NMR peak to Mn"
concentra-tion in soluconcentra-tions of (a) 0.10 M Pi with 1.90 M KNO3 solution at pH 2.0
(red, o ); (b) 4 M phosphoric acid at pH 0.1 (green, ); and (c) 4 M HC1 with 0.10 M Pi at pH -0.5 (blue,
*).
Figure 3.11. Percent of 100 mC/cm2
MnOx film dissolved as a function of 129 time (t) for application of 0 (blue, m) and 10 (red, ) .A/cm2
current den-sity in (a) 0.10 M Pi with 1.90 M KNO3 solution at pH 2.0; (b) 4 M
phos-phoric acid at pH 0.1; and (c) 4 M HCl with 0.10 M Pi at pH -0.5. Lines are presented as guides.
Figure 3.12. Control experiment comparing Tafel plots recorded in 0.10 M Pi 130 and 1.73 M KNO3 at pH 7.0 using a stirbar at ca. 600 rpm (118.9
mV/dec-ade; blue,
*),
on a RDE at 2500 rpm (118.9 mV/decade; green, ) and through Kouteckf-Levich analysis (119.1 mV/decade; red, ). While the film thickness differed between the stirbar (6 MC/cm2 MnOx film onFTO) and RDE (30.6 MC/cm2
MnOx on Pt) cases, the slopes of all three plots were in agreement, establishing that activation-controlled current density could be obtained for oxygen evolution using a stirbar for the range of current densities explored.
22
Figure 3.13. Proposed mechanism for the OER on MnOx in (left) acidic and 133 (right) alkaline pH conditions. In the acidic regime, the resting state
com-prised of Mn"' edge sites undergo turnover-limiting cross-site proton-cou-pled disproportionation to produce adjacent MnW sites with terminal oxos. These terminal oxos couple to release 02. In the alkaline regime, the mixed valent Mn/ resting state proceeds through a one-electron, one-proton PCET to generate adjacent MnIv=O sites. Similarly, these terminal oxos then couple in the turnover-limiting step to produce 02.
Figure 3.14. Potential dependence on pH for MnOx deposition (red,
)
and 137 oxygen evolution on MnOx (blue,m).
Data were interpolated atj
1.3VA/cm 2 from Tafel plots for MnOx deposition (see Chapter 2) and Figure
3.3 (for the OER). The deposition trace is consistent with an inverse fourth-order dependence on [H] in the acidic regime and assumes a Mn2+ solution concentration of 50 M, which is consistent with concentrations
for a dissolved 6 mC/cm2
MnOx film.
Figure 4.1. Cyclic voltammogram of a 1 cm2
FTO electrode in
0.5
mM Mn 2 155 and 0.9 M KNO3 solution at 100 mV/s scan rate showing the first (blue line-) and second (red line
)
cycles.Figure 4.2. Tafel plots of oxygen evolution in 0.10 M Pi and 1.73 M KNO3 at 156
pH 7.0 on MnOx films deposited by different deposition protocols: con-stant potential without buffer (221 mV/decade Tafel slope; light blue,
),
constant potential in MePi buffer at pH 8 (123 mV/decade; blue, i), CV(68 mV/decade; purple,.), multipotential pulses (67 mV/decade; red,
),
and cathodization (70 mV/decade; green,Figure 4.3. Tafel plots of oxygen evolution in 0.10 M Pi and 1.90 M KNO3 at 157
pH 2.5 on constant potential deposited MnOx
(-650
mV/decade Tafel slope; blue m) and activated MnOx (91 mV/decade; red ).Figure 4.4. (a) Cyclic voltammogram of a 1 cm2
FTO electrode in 0.5 mM 157 Mn2' at 100 mV/s showing the first (blue line), intermediate (grey lines),
and last scans (red line). (b) Tafel plots of oxygen evolution in 0.10 M Pi and 1.73 M KNO3 at pH 7.0 on MnOx films deposited by different deposi-tion protocols: constant potential in MePi buffer at pH 8 (123 mV/decade Tafel slope; blue 0), CV (68 mV/decade; dark purple .), and CV without KNO3 during deposition (74 mV/decade; light purple ). The OER
activ-ity of a blank FTO electrode (grey, -) is included for comparison.
Figure 4.5. Electrochemical protocols for depositing MnOx on an FTO elec- 158 trode. Unactivated (as deposited) MnOx (brown) is produced by constant
23
potential results in activated MnOx (red). Activation can also occur by CV
cycling (not shown) and multipotential deposition (which repeats the an-odic-cathodic pulse sequence).
Figure 4.6. Tafel plots of oxygen evolution in 0.10 M Pi and 1.73 M KNO3 at 159
pH 7.0 on MnOx films prepared by multipotential deposition in 0.5 mM Mn2", 0.9 M KNO3 solution with the first pulse at 1.1 V for 3 s and the
sec-ond pulse for 2 s at a potential of: 0.4 V (92 mV/decade Tafel slope; blue A), 0.2 V (85 mV/decade; green ), 0 V (72 mV/decade; purple A), and -0.4 V (65 mV/decade; red ). A total of 50 pulse cycles were employed during multipotential deposition.
Figure 4.7. Tafel plots of oxygen evolution in 0.10 M Pi and 1.73 M KNO3 at 161
pH 7.0 on MnOx films produced by cathodization of MnOx in: Mn2
,-less solution (300 mV/decade Tafel slope; grey,
),
0.5 mM Mn2* with 100 mM Pi buffer at pH 7.0 (181 mV/decade; brown, '), and 0.5 mM Mn2+ with 100 mM MePi buffer at pH 8.0 (323 mV/decade; orange, ). Activated MnOx by cathodization in 0.5 mM Mn2' and 0.9 M KNO3 solution (70mV/dec-ade; green,
v)
is provided for comparison.Figure 4.8. Tafel plots of oxygen evolution in 0.10 M Pi and 1.73 M KNO3 at 161
pH 7.0 on MnOx films produced by cathodic deposition (221 mV/decade Tafel slope; light orange,
)
and cathodic deposition followed by short an-odic pulse (126 mV/decade; dark orange, ,).
Activated MnOx by cathod-ization (70 mV/decade; green,v)
is provided for comparison.Figure 4.9. Faradaic efficiency of OER on activated MnOx films operated at 161 0.1 mA/cm2
in 0.10 M Pi and 1.75 M KN03 solution at pH 2.5 (red,
)
and 7.0 (green, -).
02
was detected by fluorescence sensor and theoretical02 traces (black, -) are calculated from total charge passed during chron-oamperometry assuming 100% Faradaic efficiency. Plots are offset by 2 h for clarity. Background sensor drift and 02leak of electrolysis cell included for comparison (grey, -).
Figure 4.10. Electrochemical stability as measured by sustained chronoam- 162 perometry on FTO at 0.1 mA/cm2
for activated Mnox (red,
),
constantpotential deposited MnOx (blue, -), IrOx (purple, - - -) and blank FTO
(grey, -) in 0.10 M Pi and 1.73 M KNO3 at (a) pH 7.0 and (b) pH 2.5;
(c) in 0.5 M H2SO4 at pH 0.3. (d) Stability measurements were repeated using a higher surface area carbon cloth electrode (grey, * -) at 1 mA/cm 2.
MMI-24
Figure 4.11. Tafel plots of oxygen evolution on activated MnOx before (red 163
)
and after (light purple)
sustained chronoamperometry for 6 h at 0.1mA/cm2
in 0.10 M Pi and 1.73 M KNO3 at (a) pH 7.0 and (b) pH 2.5.
Figure 4.12. Double-layer capacitance measurements for determining the 164 electrochemically active surface area
(ECSA)
of FTO (0.2 mF/cm2slope; grey, R ) and carbon cloth (2.8 mF/cm2 slope; red,
)
in 1 M KNO3.
Cur-rent densities were recorded in a small non-Faradaic region near the open circuit potential of the electrode.
Figure 4.13. Electrochemical impedance spectroscopy evaluated at 1.65 V 165 with superimposed 5 mVAC signal: (a, b) FTO, (c, d) MnOx deposited at
constant potential, and (e, f) activated MnOx. (a, c, e) Bode plot featuring impedance (red, ) and phase data (blue, .). (b, d, f) Corresponding Nyquist plot where insets show expanded region at high frequencies. Data were fitted (black, -) to a (g) modified Randles circuit where R is uncom-pensated resistance, Rf is the Faradaic resistance, Y(a) is a constant phase element similar to a capacitor that includes solution and film capacitance, and Wd is a Warburg element representing diffusion limitations during ox-ygen evolution. Fitted parameters are presented in Table 4.1.
Figure 4.14. Cyclic voltammogram (top) and corresponding change in mass 167 as measured by a quartz crystal microbalance (bottom) on a Pt-sputtered
quartz electrode in
0.5
mM Mn2" and 0.9 M KNO3 solution at 50 mV/s
scan rate. The scans progress from red to purple lines, and grey arrow indi-cates increase in mass over time. The current-time view of the same pro-cess is shown in Figure 4.15.
Figure 4.15. Current-time view (top) and corresponding change in mass as 167 measured by a quartz crystal microbalance (bottom) on a Pt-sputtered
quartz electrode in
0.5
mM Mn2" and 0.9 M KNO3 solution at 50 mV/sscan rate. The scans progress from red to purple lines, and grey arrow indi-cates increase in mass over time. The CV view is shown in Figure 4.14.
Figure 4.16. Current-time view (top) and corresponding change in mass as 169 measured by a quartz crystal microbalance (bottom) on a Pt-sputtered
quartz electrode performing multipotential deposition of MnOx by alter-nating between 1.1 V for 3 s and -0.4 V for 2 s in
0.5
mM Mn2' and 0.9 M
KNO3 solution.
Figure 4.17. Cyclic voltammogram (top) and corresponding change in mass 169
25
quartz electrode in Mn-free 0.9 M KNO3 solution at 50 mV/s scan rate.
The scans progress from red to purple lines.
Figure 4.18. Cyclic voltammogram at 50 mV/s scan rate (top) and corre- 169 sponding change in mass as measured by a quartz crystal microbalance
(bottom) on a Pt-sputtered quartz electrode in a solution of
0.5
mM Mn2.
and 50 mM MePi at pH 8.0 (red, ) and without any Mn2+ (grey, ). Arrows were added to show progression of the cycles.
Figure 4.19. Change in mass as measured by a quartz crystal microbalance on 168 a constant potential deposited MnOx film (of 3 MC/cm 2 loading, -0.7 g)
cathodized in:
0.5
mM Mn2' and 0.9 M KNO3 solution (green, -- ), Mn2+_ free solution of 0.9 M KNO3 (grey, - ), and 0.5 mM Mn2' and 50 mM
MePi at pH 8 (orange,
Figure 4.20. Change in mass on a Pt-sputtered quartz electrode as measured 170 by a quartz crystal microbalance for cathodic deposition at -0.4 V in: (a)
Mn-free 0.9 M KNO3 solution (grey) and with added 0.5 mM Mn 2 (red)
where the black arrow indicates when the electrode potential was switched to open circuit. (b) With added
0.5
mM Mn2+ (red,)
where the black arrow denotes a 30 s anodic pulse at 1.0 V. The same anodic pulse on a fresh electrode (grey,)
without any prior cathodic deposition procedure is provided for comparison.Figure 4.21. FESEM images of: MnOx deposited at constant potential in MePi 171
(top) and activated MnOx (middle). Both samples were electrodeposited on FTO substrate (bottom). Scale bars are 400 nm.
Figure 4.22. HRTEM images of isolated nanosized domains from MnOx de- 171 posited at constant potential (top) and from activated MnOx (bottom). All
samples were electrodeposited on carbon film (visible as amorphous back-ground). Scale bar is 2 nm. Interplanar spacing for constant potential MnOx was measured from the FFT and indexed according to birnessite.
Figure 4.23. XPS diagnostics for assessing average Mn oxidation state in 172 MnOx films: (a, b) Mn 3s peak splitting width (A3s); (c, d) Mn 2p/2
bind-ing energy; (e, f) Mn 3p bindbind-ing energy. High-resolution spectra are shown in the bottom row for MnOx prepared by: constant potential
(*,-),
mul-tipotential ( , ), multipotential followed by OER ( , ), cathodization(e,-), and cathodization followed by OER ( , ). The top row provides a simplified view of the diagnostic parameters extracted from the spectra with comparison to manganese oxide control compounds (grey, darker i is from this chapter, lighter and black bars is compiled from literature).
26
High-resolution XPS spectra for control compounds are shown in Figure
4.24.
Figure 4.24. High-resolution XPS spectra in the (a) Mn 3s, (b) 2p, and (c) 3p 173 regions for control manganese oxides: Mn'O2 (blue, -), Mn.. 20 3 (green,
-), Mn"," 304 (red, ), and Mn"O (magenta, ).
Figure 4.25. Powder X-ray diffraction patterns of FTO (grey, ) and MnOx 175 thin films electrodeposited by: constant potential (blue, -),
multipoten-tial cycling (red, ), and cathodization (green, -).
Figure 4.26. Powder X-ray diffraction patterns of MnOx prepared by: con- 175 stant potential (top -), cathodization (bottom -), and multipotential
(middle ) deposition. Constant potential MnOx (blue -) matches bir-nessite (grey M, JCPDS #01-087-1497) while cathodized samples (green -) matches hausmannite (grey ., JCPDS #24-0734). Multipotential MnOx (red
)
was highly disordered and the phase was undetermined by XRD.Figure 4.27. Powder X-ray diffraction patterns of control manganese oxide 175 compounds: P-MnO2 (pyrolusite, light blue, ; JCPDS-ICDD card
#01-071-0071), 6-MnO2 (birnessite, blue, -; JCPDS #01-087-1497),
a-Mn2O3 (bixbyite, green, -; JCPDS #00-041-1442), a-Mn304
(haus-mannite, red, ; JCPDS #00-024-0734), and MnO (manganosite, ma-genta, ; JCPDS #00-007-0230). Compounds were matched to JCPDS-ICDD entries (grey *).
Figure 4.28. Pair distribution functions of total scattering collected from con- 176 trol manganese oxides:
P-MnO
2 (pyrolusite, light blue), 6-MnO2(birnes-site, blue, -), a-Mn2
O
3 (bixbyite, green,)
a-Mn30
4 (hausmannite, red,), and MnO (manganosite, magenta, ). PDFs for MnOx samples are in Figure 4.29.
Figure 4.29. Atomic pair distribution functions (PDFs) of MnOx prepared by 177 different deposition protocols: constant potential (top -), multipotential
(middle ), and cathodization (bottom -). PDFs are truncated at 40
A.
PDFs for manganese oxide control samples are in Figure 4.28.Figure 4.30. Calculated PDF model fits (black) overlaid on experimental PDF 179 traces of MnOx catalysts prepared by different deposition methods:
con-stant potential (blue -), multipotential (red ), and cathodization (green -). The cathodized sample was fit in two ways: hausmannite struc-ture alone (top green -) and a two-phase birnessite and hausmannite fit
27
(bottom green -). The difference curves (grey -) between the calculated
and experimental PDFs are offset below each sample.
Figure 4.31. Polyhedral structural models for birnessite (8-Mn0 2, left) and 187
hausmannite (a-Mn3
0
4, right) where Mn, 0, and K atoms are in black, red,and green, respectively. In hausmannite, green and blue regions represent
the MnO octahedron and MnO4 tetrahedron, respectively.
Figure 4.32. Decomposition of the PDF of the calculated birnessite fit (bot- 191 tom grey -) into contributions from primary atomic pairs where IL
de-notes interlayer species including K and 0 (from H20) atoms. The
inten-sity of the top four curves (IL-IL, 0-IL, Mn-IL, and 0-0) have been magnified 2x for clarity. The experimental PDF for constant potential de-posited MnOx is provided for comparison (bottom blue).
Figure 4.33. Decomposition of the PDF of the calculated hausmannite fit 191
(bottom grey -) into contributions from primary atomic pairs where
Mn(oct) and Mn(tet) refer to a Mn atom in octahedral and tetrahedral ge-ometry, respectively. The experimental PDFs for
a-Mn
304 (hausmannite,bottom light green
)
and cathodized MnOx (bottom dark green -) areprovided for comparison.
Figure 4.34. Schematic for the structure of nanosized MnOx domains during 194 activation. First, birnessite (8-Mn0 2, from constant potential deposition)
undergoes surface comproportionation with Mn"(OH)2, formed by
ca-thodization. The resulting hausmannite (a-Mn3"1 1"0 4) then converts to
disordered birnessite upon anodic conditioning (from either voltage cy-cling protocols or during oxygen evolution). This disordered birnessite layer is more active towards OER than the original birnessite phase.
Figure 4.35. Tafel plot of constant potential deposited MnOx in 0.10 M Pi and 197 1.73 M KNO3 at pH 2.5 with slopes of 678 mV/decade (red, ) and 125
mV/decade (purple, -). The lower slope region at higher potentials is consistent with permanganate formation.
Figure 5.1. Tafel plots of oxygen evolution for unary metal oxides in 0.10 M Pi 224 and 1.0 M KNO3 at (a) pH 7.0 and (b) pH 2.5 of: CoOx (red -, 60 and 82
mV/decade Tafel slope at pH 7.0 and 2.5, respectively), NiOx (light
ma-genta , 90 mV/decade at pH 7.0), FeOx (orange , 45 and 51
ade at pH 7.0 and 2.5 respectively), MnOx (blue 4, 125 and 650 mV/dec-ade at pH 7.0 and 2.5), PbOx (brown -, 130 and 121 mV/decmV/dec-ade at pH 7.0 and 2.5), and IrOx (purple *, 41 and 32 mV/decade at pH 7.0 and 2.5).
28
Figure 5.2. Cyclic voltammograms of a 1 cm2 FTO electrode at 50 mV/s in
0.5
225 mM of: (a) Mn2+ (red ), (b) Ni2+ (light magenta ), (c) Fe2
+ (orange
), (d) Mn2+ (blue -), (e) Pb2+ (brown -), and (f) Ir3+ (purple -). All metal ions were buffered with 50 mM MePi at pH 8.0 except for Fe2+ (which was deposited at 75 'C in 1.0 M KNO3) and Ir3* (which was deposited in
an oxalate/carbonate buffer at pH 10.5). Figure 5.3. Cyclic voltammograms of a 1 cm2
FTO electrode at 50 mV/s in 50 227 mM MePi buffer at pH 8.0 with: (a) 0.25 mM ea. C02+ and Mn2+ (red );
and (b) 0.25 mM ea. Co2
+ and Pb2+ (light green ) with Fe2, (dark green -). Background CV of metal-free MePi buffer (grey -) included for com-parison.
Figure 5.4. Tafel plots of oxygen evolution for CoMnOx in 0.10 M Pi and 1.0 228 M KNO3 at (a) pH 7.0 and (b) pH 2.5 of: CoMnOx deposited at 0.90 (dark
green e, 65 and 81 mV/decade at pH 7.0 and 2.5), 0.65 (light green , 85 mV/decade at pH 2.5), and 1.15 V (dark cyan
,
83 mV/decade at pH 2.5). Unary metal oxides provided for comparison with slopes defined in Figure 5.1: CoOx (red ), MnOx (blue -), and IrOx (purple *).Figure 5.5. Tafel plots of oxygen evolution in 0.10 M Pi and 1.0 M KNO3 at 229
(a) pH 7.0 and (b) pH 2.5 for: CoPbOx (light green
,
70 mV/decade at both pH 7.0 and 2.5) and CoFePbOx (dark green *, 70 mV/decade at both pH 7.0 and 2.5). CoFeOx (orange , 70 mV/decade at both pH 7.0 and 2.5) and unary metal oxides are provided for comparison with slopes de-fined in Figure 5.1: CoOx (red ), PbOx (brown ), and IrOx (purple *).Figure 5.6. Electrochemical stability for acidic OER measured by sustained 231 chronoamperometry at: (a) 0.1 mA/cm2
in pH 2.5 Pi for CoMnOx depos-ited at 0.65 (light green
),
0.90 (dark green -), and 1.15 V (dark cyan) along with CoOx (red ), NiOx (light magenta ), MnOx (blue
--- ), IrOx (purple *ee), and FTO (grey m) for comparison; (b) 1.0 mA/cm2
in pH 2.5 Pi for CoPbOx (light green ) and CoFePbOx (dark green -) with CoFeOx (orange ), CoOx (red ), and PbOx (brown --- ) for comparison; and (c) 1.0 mA/cm2 in pH 2.0 sulfate for CoFePbOx (dark green -). The inflection of potential in the plots indicates film dis-solution.
Figure 5.7. Electrochemical stability for acidic OER measured by sustained 233 chronoamperometry at 1.0 mA/cm2
in 0.10 M Pi and 1.0 M KNO3 solution at pH 2.5 for: MnCoOx deposited at 0.90 V (dark green -), CoOx (red
29
(purple **0), and FTO (grey -). The inflection of potential in the plots indicates film dissolution.
Figure 5.8. Measured oxygen concentration and corresponding Faradaic effi- 234 ciency of OER in 0.5 M Pi solution at pH 2.5 on CoMnOx operated at 0.1
mA/cm2
(red, ) and CoFePbOx operated at 1.0 mA/cm2 (blue, 0). 02
was detected by gas chromatography in 20 min snapshots and theoretical
02 concentrations (grey, -) are calculated from the charge passed during chronoamperometry assuming 100% Faradaic efficiency. The average effi-ciency for CoMnOx and CoFePbOx is 91 and 97%, respectively.
Figure 5.9. FESEM images of CoMnOx electrodeposited at: (a) 0.65, (b) 237 0.90, and (c) 1.15 V with (d) CoOx and (e) MnOx for comparison. All
samples were prepared on FTO substrate, and scale bars are 200 nm.
Figure 5.10. FESEM images of (a) CoPbOx and (b) CoFePbOx with (c) 237 PbOx and (d) FTO for comparison. All samples were electrodeposited on
FTO, and scale bars are 100 nm.
Figure 5.11. EDS elemental maps recorded through SEM of (a) CoMnOx 238 (deposited at 0.90 V) and (b) CoFePbOx. Individual elemental channels
for Co (red), Mn (blue), Fe (orange), and Pb (green) were combined and overlaid on the respective SEM image. All samples were prepared on FTO substrate, and scale bars are 200 nm for CoMnOx and 100 nm for CoFeP-bOx.
Figure 5.12. EDS elemental maps recorded through SEM of: (a) CoMnOx 238 (deposited at 0.65 V), (b) CoMnOx (deposited at 1.15 V), and (c)
CoP-bOx. Individual elemental channels for Co (red), Mn (blue), and Pb (green) were combined and overlaid on the respective SEM image. All samples were prepared on FTO substrate, and scale bars are 200 nm for
CoMnOx and 100 nm for CoPbOx.
Figure 5.13. High-resolution EDS elemental maps recorded through STEM 239 of CoFePbOx. Individual elemental channels for Co (red), Mn (blue), Fe
(orange), and Pb (green) were combined and overlaid on the respective image. Scale bars are S nm for CoMnOx and 5 nm for CoFePbOx.
Figure 5.14. STEM image of CoFePbOx electrodeposited directly on a carbon 239 mesh TEM grid. Scale bar is 20 nm.
Figure 5.15. X-ray diffraction patterns of CoMnOx (red
)
and CoFePbOx 240 (blue -) powders, originally prepared as thin films on FTO.30
Figure 5.16. High-resolution XPS spectra in the (a) Co 2p and (b) Mn 2p re- 241 gions for: CoMnOx (deposited at 0.90 V, dark green -) compared to
CoOx (red ), and MnOx (blue -).
Figure 5.17. High-resolution XPS spectra in the (a) Co 2p and (b) Pb 4f re- 241 gions for: CoPbOx (light green ) and CoFePbOx (dark green -)
com-pared to CoOx (red ), and PbOx (brown -).
Figure 5.18. High-resolution XPS spectra in the Fe 2p region for CoFePbOx 242 (dark green -) compared to a Fe2O3 control (orange ). The peak for
CoFePbOx is assigned to Sn 3p3/2 from the underlying FTO substrate.
Figure 5.19. Progression of designing an active, stable, and earth-abundant 243 acidic OER catalyst. The first generation system focused on demonstrating
film stability at low pH with MnOx. The activity of MnOx was improved in the second generation by activating MnOx for
OER
The catalyst was re-formulated as a mixed metal oxide for the third generation, where function-ality was separated into catalytic and structural elements comprising Co and Mn, respectively. Finally, the degradation of Mn oxides at high anodic potentials was solved by replacing it with a FePb oxide structural compo-nent to create the fourth generation catalyst.Figure 5.20. Pourbaix diagram of manganese (generated from the Materials 248 Project). Dashed lines indicate the hydrogen and oxygen evolution
reac-tions.
Figure 5.21. Process for independently optimizing the structural component 249 of mixed metal films to discover a metal oxide that is both stable at high
anodic potentials and at acidic pH. Pourbaix diagrams of metals (shown as simplified representations of stability and corrosion, generated from the Materials Project and experimental data) were analyzed for stability in the top left region of the plots (corresponding to high anodic potentials and low pH). The candidates were then filtered by removing precious, rare, and highly poisonous metals; then further refined by excluding oxides that were incompatible with anodic electrodeposition in buffer. In this manner, Pb was identified as a promising replacement for Mn for stabilizing
OER
cata-lysts in acid.Figure 5.22. Hypothesis for the "chelation" effect where the structural com- 254 ponent (shown as Mn in this example) provides scaffolding and maintains
strong metal-oxygen bonds during oxygen evolution to keep the overall catalyst structure intact, which prevents the catalytic metal (shown as Co) from dissolving.
31
Table 1.1. Common Tafel slopes and their corresponding mechanism for a 63 catalytic process involving electron-transfer (E) and chemical (C) steps for
up to four electron-transfer pequilibriums (e.g., the oxygen evolution re-action).
Table 2.1. Coulometric titration of MnOx catalyst films 85
Table 4.1. Fitting parameters for electrochemical impedance spectroscopy 166 evaluated at 1.65 V with superimposed 5 mV AC signal using a modified
Randles circuit model (Figure 4.13).
Table 4.2. Pearson's product-moment correlation coefficients calculated be- 178 tween PDFs of manganese oxide control samples and MnOx catalyst films.
Table 4.3. Summary of PDF fit results for MnOx catalyst samples. 181
33
Preface and Acknowledgements
I am really happy to have made it to this point. When I first entered graduate school, I could not imagine myself actually graduating. I felt that I did not deserve to be here and lacked the chemistry intuition, knowledge, and work ethic to play on the same field as my peers. The lingo was foreign and the work hours were long. But just being in this environ-ment and not giving up meant that I slowly started to understand and discuss chemistry at a higher level, the lab environment became comfortable, and the hours seemed negligi-ble. I slowly made small steps in research, and now I can independently start and finish research projects. Overall, I appreciate that graduate school was able to hone my ability to think critically and advance my ability to work harder. I owe all of this to my friends,
research group, advisor, and family.
I am extremely grateful for the friends that I gained during graduate school. Since the first day, we braved through teaching, classes, and exams. These fine folks include: Jon Axtell, Carl Brozek, Joe Elias, Aaron Gell, Grace Han, Eric Hontz, Dan Kozera, Harris Liu, Jeff Martell, Mik Minier, Shannon Morey, and Tarun Narayan. My first apartment-mate
at MIT was Austin Travis; even though we were the same year, I was very impressed by his knowledge and enthusiasm for chemistry. He was a huge chemistry nerd in the best possible ways, and I remember our lengthy discussions about superheroes and comic books. Sadly, he left us early, but I will always remember his influence and emulate his enthusiasm. I would like to thank Hyangsoo Jeong for the fun times playing guitar to-gether. It forced me to start singing songs rather than just playing them, which made me
34
a better musician. Recently, I had the honor of working with Leon Liu, a friend of mine back from Caltech, on a side project for the DOE Sunshot program. I appreciate our dis-cussions and thank him for challenging me to think better and produce higher-quality work. I also thank Xiao Liu and Jijo Wang for their support and the fun times we spent together. Shout-out to Travis Quinlan for being a cool apartment-mate and to Ning Bao for writing music with me. Whenever I want to take a break from chemistry, I enjoy talking about computer programming with Bryce Anderson to learn about modern languages, low-level architectural details, programming paradigms, and asynchronous coding. He is an amazing software engineer. Hieu Hoang was a "battle buddy" during the first few years working through classes and requirements. He is one of those people who you meet for the first time and can immediately trust as a friend. Whenever I was looking to grab dinner or just hang out very late at night, I could count on finding him toiling away in lab. Dan Graham is a special friend of mine who I frequently engage in random discussions on just about anything. I fondly remember nights in lab where we would blast metal and punk music as loud as we could. I could always depend on his open mindedness and correct moral compass to guide me along the right path. He's my "partner in crime" for scheming about startup ideas, and we would bounce ridiculous concepts off of each other. It was fun to see him get excited about our different ideas. Finally, I would particularly like to high-light Miller Li and Bon Jun Koo, both the same year and inorganic chemists. Miller was my later apartment-mate, and I consider him like a brother. He is one of the kindest indi-viduals I know-constantly helping other people, even at his own expense. I also learned a lot about gaming and animation from him, and a lot of late nights after a long day in lab were consumed by competitive multiplayer games and screenings. Bon Jun is my office-mate ever since we moved to Harvard, and she is one of the finest friends I have the honor of having. She is a very genuine person with an exuberant and outgoing personality who makes everyone around her better. Any gathering is immediately more enjoyable with her sharp wit and perfect one-liners. I owe the majority of my social life throughout graduate
35
school to her invitations. Both of them are constantly watching my back and looking out for my well-being. It is rare to have lifelong friends you can trust with your life, and I am forever thankful for their friendship and influence.
I am fortunate to join an extraordinary lab and learned everything I now know about chemistry and research from the group members and professor. My peers constantly set the bar higher and higher as scientists. Every time I thought I did something well (e.g., good results, decent presentation, etc.), another group member would outdo it, and then someone else would push expectations even higher. While it was tough to keep up with everyone, I enjoyed trying to compete with these "giants" since it forced me to work hard at becoming a better scientist. I particularly thank Kwabena Bediako and Yogi Suren-dranath for helping me start my research in the group, teaching me electrokinetics, and for their mentorship. Kwabena was always my adjacent bench-mate, and I would bring him my toughest scientific questions and problems. Much of my scientific development comes from reviewing papers and working on grants and other publications with him. He has a knack for selecting the correct problems and experiments to tackle as well as wrap-ping up a project for publication. I remember one time after a long flight to the west coast for a conference, when I was tired and could barely stay awake, that Kwabena was still working on a paper for a few hours after I decided to sleep. That kind of work ethic of "getting it done no matter what" was also demonstrated by other group members includ-ing Tom Teets, Chris Lemon, and Chong Liu. I also learned about "goinclud-ing the extra mile" by running that additional experiment or analyzing results at a deeper level to uncover insight from many group members including Andrew Ullman and those aforementioned. Even a simple failed experiment can have important implications! I would also like to thank Danna Freedman who was my adjacent desk-mate at MIT for her mentorship. She would drop tips on how to be a better graduate student and scientist, was always be happy to answer any questions, and patiently explained many chemistry concepts to me.
Simi-36
larly, I am indebted to Chris Lemon for his mentorship, chemistry expertise, and gener-osity in including me on some of his publications. He is a scientific role model in terms of combining intelligence with hard work and produces comprehensive and rigorous results. Joep Pijpers and Tom Kempa were extremely kind to let me shadow them and learn about nanofabrication and electron microscopy. I also enjoyed conversations with Tom about computers, cinema, and photography. Similarly, I have benefited from Chong Liu and Tuncay Ozel's assistance with research techniques. Dilek Kiper is a big reason why I can just focus on fun research in lab without worrying about anything else. She is an amazing person who is constantly working behind the scenes to keep the lab running smoothly and everyone happy. She randomly brings me snacks with a bright smile and invites me to events that she hosts. I am indebted to her always looking out for me and genuinely caring for my interests. When needing a short break in lab, I usually pester Dan Graham (men-tioned earlier), Evan Jones, or Nancy Li. Evan and I (joined by Kwabena occasionally) would battle on an old Super Nintendo system in one of Harvard CCB's common areas. We would play an obscure "battle game" that was added as an afterthought to Super Mario 3 (part of the SNES Super Mario All-Stars compilation). What started out as a very simple and casual game eventually turned into cutthroat competition as we devised strategies upon counter-strategies that literally evolved to exploiting glitches in the game to win. Every battle felt like a playoff series and we both brought our highest level of play to each game. I will miss having such a worthy opponent after I leave graduate school. Less com-petitively, I was able to convince Nancy to pick up a few casual games that I was interested in, and so a lot of fun conversations in lab were about gaming and a certain trading card series. I am also fortunate to have mentored two fantastic undergraduates from MIT: Alex Siegenfeld and Eric Lau. Alex is one of the most brilliant students at MIT yet is ridicu-lously humble. I learned a lot from observing how he thinks and approaches problems. Similarly, Eric combines a perfect blend of intelligence, hard work, and ambition that