aJonas Odermatt and Rebekka Bolliger contributed equally to this work.
*Corresponding author: Philipp Schuetz, Medical University Department, Endocrinology, Diabetology and Metabolism, Kantonsspital Aarau, Aarau, Aargau, Switzerland, E-mail: [email protected]
Jonas Odermatt, Rebekka Bolliger, Lara Hersberger, Manuel Ottiger and Beat Mueller: Medical University Department, Endocrinology, Diabetology and Metabolism, Kantonsspital Aarau, Aarau, Aargau, Switzerland
Mirjam Christ-Crain: Medical University Department, Endocrinology, Diabetology and Metabolism, University Hospital Basel, Basel, Basel-Stadt, Switzerland
Matthias Briel: Basel Institute for Clinical Epidemiology and Biostatistics, Department of Clinical Research, University Hospital Basel, Basel, Basel-Stadt, Switzerland; and Department of Clinical Epidemiology and Biostatistics, McMaster University, Hamilton, Ontario, Canada
Heiner C. Bucher: Basel Institute for Clinical Epidemiology and Biostatistics, Department of Clinical Research, University Hospital Basel, Basel, Basel-Stadt, Switzerland
Jonas Odermatt
a, Rebekka Bolliger
a, Lara Hersberger, Manuel Ottiger, Mirjam Christ-Crain,
Matthias Briel, Heiner C. Bucher, Beat Mueller and Philipp Schuetz*
Copeptin predicts 10-year all-cause mortality in
community patients: a 10-year prospective cohort
study
DOI 10.1515/cclm-2016-0151
Received February 23, 2016; accepted April 6, 2016; previously published online May 12, 2016
Abstract
Background: Copeptin, the C-terminal part of the
argi-nine vasopressin (AVP) precursor peptide, is secreted in
response to stress and correlates with adverse clinical
outcomes in the acute-care hospital setting. There are no
comprehensive data regarding its prognostic value in the
community. We evaluated associations of copeptin levels
with 10-year mortality in patients visiting their general
practitioner (GP) for a respiratory infection included in a
previous trial.
Methods: This is a post hoc analysis including data from
359 patients included in the PARTI trial. Copeptin was
measured in batch-analysis on admission and after 7 days.
We calculated Cox regression models and area under the
receiver operating characteristic curve (AUC) to assess
an association of copeptin with mortality and adverse
outcome. Follow-up data were collected by GP, patient
and relative tracing through phone interviews 10 years
after trial inclusion.
Results: After a median follow-up of 10.0 years,
mortal-ity was 9.8%. Median admission copeptin levels (pmol/L)
were significantly elevated in non-survivors compared to
survivors (13.8, IQR 5.9–27.8; vs. 6.3 IQR 4.1–11.5; p < 0.001).
Admission copeptin levels were associated with 10-year
all-cause mortality [age-adjusted hazard ratio 1.7 (95% CI,
1.2–2.5); p < 0.001, AUC 0.68]. Results were similar for
dis-charge copeptin levels. Copeptin also predicted adverse
outcomes defined as death, pulmonary embolism and
major adverse cardiac and cerebrovascular events.
Conclusions: In a sample of community-dwelling patients
visiting their GP for a respiratory infection, copeptin levels
were associated with 10-year all-cause mortality. In
con-junction with traditional risk factors, this marker may help
to better direct preventive measures in this population.
Keywords: biomarker; copeptin; primary care; respiratory
tract infection; 10-year mortality.
Introduction
In primary care, detection of patients at increased risk
of death and adverse clinical outcome is crucial to target
intensified interventions for these high-risk
individu-als that may improve survival. Risk scores, such as the
Framingham score, are well established and help to direct
cardiovascular risk management, for instance, use of
statin therapy. In addition to clinical parameters, novel
inflammatory blood biomarkers have been proposed to
improve prognostication [1–4]. However, as yet most
bio-marker research has looked at the acute care in a
hospi-tal setting, and the potential for primary care patients is
incompletely understood [5, 4].
Among novel markers, copeptin, an osmo-dependent
stress and inflammatory biomarker, has generated much
interest [6, 7]. Copeptin, a 39-aminoacid glycopeptide,
is the C-terminal part of the arginine vasopressin (AVP)
precursor peptide and is produced in the hypothalamus
[8]. Copeptin serves as a sensitive surrogate marker for AVP
production and parallels AVP plasma osmolality changes
[9]. A drop in blood pressure or a change in osmotic
pres-sure induces AVP release. Further, AVP itself plays an
important part in the endocrine stress response, acting
as a potent synergistic factor of corticotropin-releasing
hormone and is, therefore, a hypothalamic stimulator of
the hypothalamo-pituitary-adrenal axis [10–14].
Several studies have reported a strong association
of copeptin with long-term mortality mainly in hospital
settings [15]. These studies include patients with sepsis
[16, 17], pneumonia and lower respiratory tract infections
[16, 18, 19], stroke [20, 21], acute myocardial infarction and
congestive heart failure [22–25], as well as diabetes type 2
[26], metabolic syndrome [27] and diabetes insipidus [28].
Also in primary care, copeptin was found to predict risk in
patients with heart failure [29, 30], but there is no
compre-hensive data assessing the usefulness of serum copeptin
levels as a general “risk marker” in a patient sample from
primary care contacting general practitioners (GPs) due to
acute respiratory tract infections (ARTIs).
Herein, we evaluated the ability of copeptin to predict
mortality and adverse clinical outcomes in
community-dwelling patients visiting their GP for a respiratory
infec-tion followed over a 10-year-time period.
Materials and methods
Study design
This is a post hoc analysis of prognostic markers for death sam-pled 10 years ago in the context of a primary care intervention trial [31]. The initial cohort included 458 adult patients with an ARTI, of which 359 (78.5%) could be contacted to assess long-term outcomes between April and August 2015.
The initial PARTI trial (“Procalcitonin-Guided Antibiotic Use vs. a Standard Approach for Acute Respiratory Tract Infections in Pri-mary Care”) was a randomised, open, multicentre, non-inferiority trial [31]. A study protocol was published beforehand [32]. In brief, adult patients with an ARTI, and in their GP’s opinion in need of antibiotics, were randomised to either a procalcitonin (PCT)-guided approach or a standard approach of antibiotic therapy from Decem-ber 13, 2004 until April 30, 2006. For the PCT-guided therapy, the use of antibiotics was more or less strongly discouraged based on defined PCT cut-off ranges [33]. The standard approach followed evidence-based guidelines for the use of antibiotics. The aim of the trial was to prove the safety and efficacy of using PCT levels to guide antibiotic therapy.
The PARTI study protocol, as well as the present follow-up-trial, was approved by the local Ethics Committee of Basel (EKBB), and all procedures conformed to the Declaration of Helsinki. Written informed consent, including authorisation for secondary analyses,
was obtained from all participating physicians and patients on the day of randomisation.
The initial PARTI trial is registered: isrctn.org; Identifier: ISRCTN73182671.
Data collection and endpoints
For the current analysis, we performed follow-up interviews with all GPs, patients and/or relatives based on their availability. We assessed outcomes using systematic questionnaires. There was no blinded assessment for outcomes.
Also, the register of death of the cantons Stadt and Basel-Land was consulted if no information about vital status was avail-able. From a total of 458 patients with an ARTI included in the initial trial, 359 patients were included in the follow-up study (276 patients were assessed through 40 primary care physicians, 73 patients were contacted by phone calls, nine patients were detected via the regis-ters of death and one patient died during the 28-day follow-up period of the initial trial).
The primary outcome was 10-year all-cause mortality. Second-ary outcomes were adverse outcome events including death, pulmo-nary embolism and major adverse cardiac or cerebrovascular events (MACCE), which includes cardiac infarction, cardiac arrest, stroke and transient ischemic attack. We also looked separately at MACCE and stroke as secondary outcomes.
Analysis of blood biomarkers
Blood samples were collected in the primary care centre from each patient on the day of randomisation, as well as after 7 days, and sent by courier to the central Laboratory of the University Hospital Basel for measurement of PCT. Leftover blood samples were frozen and stored at –80 °C for the later measurement of prognostic mark-ers. Copeptin serum values were determined using a novel sandwich immunoluminometric assay (B.R.A.H.M.S GmbH, Hennigsdorf, Germany) with intra- and inter-assay coefficients of variation of up to 20% using an automated immunofluorescent assay (Kryptor©, B.R.A.H.M.S GmbH, Hennigsdorf, Germany) [34, 35].
Statistical analyses
Categorical variables are expressed as percentages (numbers) and continuous variables as medians [interquartile ranges (IQRs)], unless stated otherwise. If applicable, 95% confidence intervals (CIs) are presented. The χ2 (Wald) test is used for frequency comparisons, the non-parametric (Mann-Whitney-U) test for two-sample comparisons. We analysed the associations of copeptin with primary and sec-ondary outcomes using univariable and multivariable Cox regression analyses adjusting for age (bivariable model) as well as age, gender, randomisation arm, antibiotic use initially, smoking history, comor-bidities and type of infection (fully adjusted model). We report hazard ratios (HRs) and 95% CIs as a measure of association and C-Statistics [area under the curve (AUC)] as a measure of discrimination. As the distribution of raw biomarker data was skewed, we used a natural logarithm (base e) transformation. Thereafter, the distribution of the
biomarker data approximated a normal distribution. The HR thereby corresponds to a nearly one-fourth-unit increase in the explanatory variable and to a 2.72-fold increase in log-transformed biomarker lev-els. Further, for illustration, we present Kaplan-Meier survival esti-mates of long-term survival by quartiles of copeptin levels.
Statistical analyses were performed using STATA 12.1 (STATA Corp, College Station, TX, USA). A p-value < 0.05 indicated statistical significance.
Results
Patient characteristics
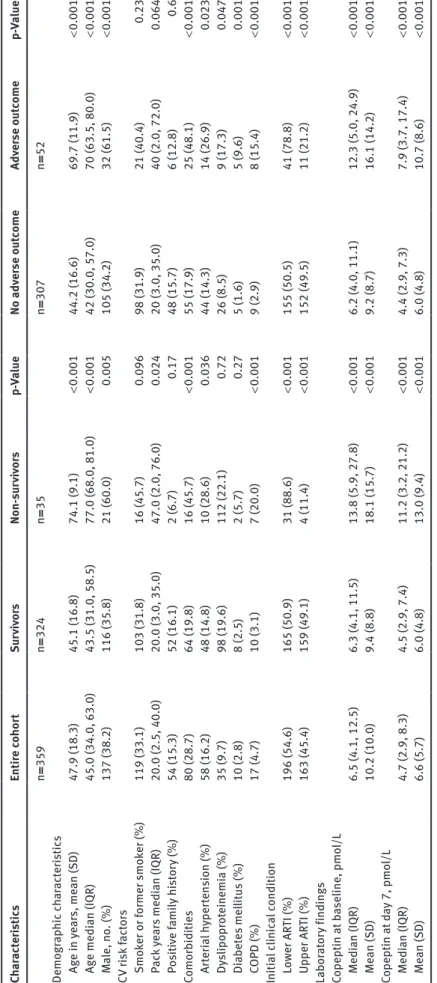
Baseline characteristics of the entire cohort (n = 359)
as well as stratified by the primary endpoint (10-year
vital status) and the main secondary endpoint (adverse
outcome) are shown in Table 1. The overall median age
was 45.0 and 38.2% (137) of the patients were male. There
were differences in age, comorbidities (arterial
hyperten-sion, chronic obstructive pulmonary disease), initial
clini-cal classification for ARTI (lower vs. upper) at the day of
randomisation and nicotine consumption according to
the survival status.
However, there was no significant difference found
between the traceable patients (n = 359) and the
popula-tion that was lost to follow-up (n = 99) (see Supplemental
Data, Table S1).
Primary outcome: 10-year all-cause mortality
A total of 35 of the 359 patients (9.8%) died during the 10.0
(IQR 9.5–10.3) years of follow-up. Median baseline
copep-tin blood levels (pmol/L) were significantly higher in
non-survivors compared to non-survivors (13.8, IQR 5.9–27.8; vs. 6.3,
IQR 4.1–11.5; p < 0.001). Similarly, biomarker results at day
7 also showed significant differences between survivors
and non-survivors (11.2, IQR 3.2–21.2; vs. 4.5, IQR 2.9–7.4;
p < 0.001).
A strong association of copeptin with an outcome was
also found in Cox regression analysis as summarised for
admission blood levels in Table 2 and for follow-up blood
levels in Table 3. The age-adjusted HR of copeptin for
prediction of mortality was 1.7 (95% CI 1.2–2.5, p = 0.005)
and 2.5 (95% CI 1.6–4.0, p < 0.001) at day 7. We also found
fair discrimination with AUCs of 0.68 (95% CI 0.6–0.8) at
baseline and 0.71 (95% CI 0.6–0.8) at day 7 (Figure 1). The
results also remained robust in a fully adjusted model
including age, gender, randomisation arm, antibiotic
use initially, smoking history, comorbidities and type of
infection.
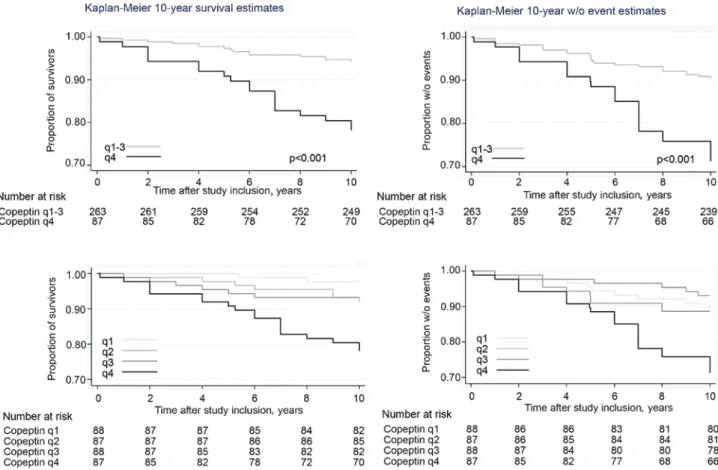
To further illustrate these associations, we generated
Kaplan-Meier curves (Figure 2 and Supplemental Data,
Figure S1), with patients stratified based on copeptin
blood level quartiles. Mortality was significantly increased
in patients in the highest copeptin quartile compared to
quartiles 1–3.
We also performed several exploratory subgroup
anal-yses as presented in Tables 2 and 3. Although
discrimina-tion was highest for patients < 60 years of age (AUC 0.77)
and for females (AUC 0.69), there was no evidence of
signif-icant effect modification (Figure 1). We also calculated
sen-sitivity and specificity for different copeptin cut-off levels
for all-cause mortality prediction. Sensitivity was 91.4% at
a 3 pmol/L cut-off with however a low specificity of 13.6%.
Conversely, specificity was 80.9% at the 15 pmol/L cut-off
with a sensitivity of 42.9%. Detailed results including
posi-tive (PPV) and negaposi-tive predicposi-tive values (NPV) are
pre-sented (see Supplemental Data, Table S2).
Secondary outcomes: 10-year incidence
of adverse outcome events
A total of 52 patients (14.5%) reported to have experienced
an adverse outcome event defined as death, pulmonary
embolism or major adverse cardiac and cerebrovascular
events. Copeptin blood levels were significantly elevated
in these patients at baseline and at day 7 compared to
the patients not having an event. Again, Cox regression
models found significant associations between both
initial and day 7 copeptin levels and adverse outcome,
with fair discrimination (Tables 2 and 3).
Kaplan-Meier curves (Figure 2), with patients
strati-fied based on copeptin quartiles, again found higher event
rates in patients in the highest copeptin quartile.
We also explored associations of copeptin with
dif-ferent components of adverse outcome, namely MACCE
(n = 19) and stroke (n = 8) (see Supplemental Data,
Tables S3 and S4). Although copeptin was increased in
patients reaching these endpoints, statistically significant
associations were not found in regression models.
Discussion
The key finding of this first prospective, observational
10-year follow-up study including community-dwelling
patients visiting their GP for a respiratory infection is that
copeptin measured during the index visit and 7 days later
was a predictor for 10-year all-cause mortality and
inci-dence of adverse outcome. Thereby these data expand
Ta ble 1: B aseline c har act er is tic s of the s tudy pop ul ation o ver al l and b y 10-ye ar 1 ° and m ain 2 ° o ut come. Ch ar act er is tic s Entir e c ohor t Sur viv or s Non-su rv iv or s p-Va lue No adv er se o ut come Adv er se o ut come p-Va lue n = 359 n = 324 n = 35 n = 307 n = 52 Demogr ap hic ch ar act er is tic s Ag e in ye ar s, me an (S D) 47.9 (18.3) 45.1 (16.8) 74.1 (9.1) < 0.001 44.2 (16.6) 69.7 (11.9) < 0.001 Ag e medi an (IQR) 45.0 (34.0, 63.0) 43.5 (31.0, 58.5) 77.0 (68.0, 81.0) < 0.001 42 (30.0, 57.0) 70 (63.5, 80.0) < 0.001 M ale, no . (%) 137 (38.2) 116 (35.8) 21 (60.0) 0.005 105 (34.2) 32 (61.5) < 0.001 CV ri sk fact or s Smo ker or f ormer s mo ker (%) 119 (33.1) 103 (31.8) 16 (45.7) 0.096 98 (31.9) 21 (40.4) 0.23 P ac k y ear s medi an (IQR) 20.0 (2.5, 40.0) 20.0 (3.0, 35.0) 47.0 (2.0, 76.0) 0.024 20 (3.0, 35.0) 40 (2.0, 72.0) 0.064 P os iti ve f ami ly hi st or y (%) 54 (15.3) 52 (16.1) 2 (6.7) 0.17 48 (15.7) 6 (12.8) 0.6 Comorb iditie s 80 (28.7) 64 (19.8) 16 (45.7) < 0.001 55 (17.9) 25 (48.1) < 0.001 Ar ter ia l h yper ten sion (%) 58 (16.2) 48 (14.8) 10 (28.6) 0.036 44 (14.3) 14 (26.9) 0.023 Dy slipopr ot einemi a (%) 35 (9.7) 98 (19.6) 112 (22.1) 0.72 26 (8.5) 9 (17.3) 0.047 Di abet es mel lit us (%) 10 (2.8) 8 (2.5) 2 (5.7) 0.27 5 (1.6) 5 (9.6) 0.001 C OPD (%) 17 (4.7) 10 (3.1) 7 (20.0) < 0.001 9 (2.9) 8 (15.4) < 0.001 Initi al clinic al condition L ow er AR TI (%) 196 (54.6) 165 (50.9) 31 (88.6) < 0.001 155 (50.5) 41 (78.8) < 0.001 Upper AR TI (%) 163 (45.4) 159 (49.1) 4 (11.4) < 0.001 152 (49.5) 11 (21.2) < 0.001 La bor at or y finding s Copeptin at b aseline, pmo l/L Medi an (IQR) 6.5 (4.1, 12.5) 6.3 (4.1, 11.5) 13.8 (5.9, 27.8) < 0.001 6.2 (4.0, 11.1) 12.3 (5.0, 24.9) < 0.001 Me an (S D) 10.2 (10.0) 9.4 (8.8) 18.1 (15.7) < 0.001 9.2 (8.7) 16.1 (14.2) < 0.001 Copeptin at d ay 7, pmo l/L Medi an (IQR) 4.7 (2.9, 8.3) 4.5 (2.9, 7.4) 11.2 (3.2, 21.2) < 0.001 4.4 (2.9, 7.3) 7.9 (3.7, 17.4) < 0.001 Me an (S D) 6.6 (5.7) 6.0 (4.8) 13.0 (9.4) < 0.001 6.0 (4.8) 10.7 (8.6) < 0.001 Dat a ar e pr esent ed a s medi an (IQR), me an (S D) or % (no .). p-Va lue s ar e s tati stic al ly signific ant at < 0.0 5. IQR, int er quar tile r ang e (25th–75th per centi le s); SD , s tand ar d dev iation; CV , c ar dio va sc ul ar; C OPD , c hr onic o bs tructi ve p ulmon ar y di se ase; AR TI, ac ut e r es pir at or y t ract inf ection. C omorb iditie s w er e identified b ased on the medic al rec or d of GP , p atient repor t, or both.
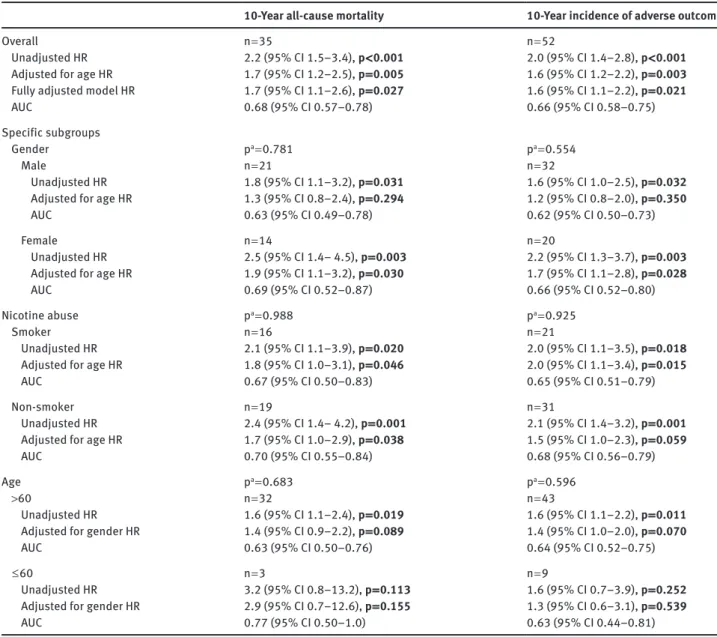
Table 2: Association between copeptin blood levels at baseline and outcomes: 10-year all-cause mortality and 10-year incidence of adverse outcome.
10-Year all-cause mortality 10-Year incidence of adverse outcome
Overall n = 35 n = 52
Unadjusted HR 2.2 (95% CI 1.5–3.4), p < 0.001 2.0 (95% CI 1.4–2.8), p < 0.001 Adjusted for age HR 1.7 (95% CI 1.2–2.5), p = 0.005 1.6 (95% CI 1.2–2.2), p = 0.003 Fully adjusted model HR 1.7 (95% CI 1.1–2.6), p = 0.027 1.6 (95% CI 1.1–2.2), p = 0.021
AUC 0.68 (95% CI 0.57–0.78) 0.66 (95% CI 0.58–0.75)
Specific subgroups
Gender pa = 0.781 pa = 0.554
Male n = 21 n = 32
Unadjusted HR 1.8 (95% CI 1.1–3.2), p = 0.031 1.6 (95% CI 1.0–2.5), p = 0.032
Adjusted for age HR 1.3 (95% CI 0.8–2.4), p = 0.294 1.2 (95% CI 0.8–2.0), p = 0.350
AUC 0.63 (95% CI 0.49–0.78) 0.62 (95% CI 0.50–0.73)
Female n = 14 n = 20
Unadjusted HR 2.5 (95% CI 1.4– 4.5), p = 0.003 2.2 (95% CI 1.3–3.7), p = 0.003
Adjusted for age HR 1.9 (95% CI 1.1–3.2), p = 0.030 1.7 (95% CI 1.1–2.8), p = 0.028
AUC 0.69 (95% CI 0.52–0.87) 0.66 (95% CI 0.52–0.80)
Nicotine abuse pa = 0.988 pa = 0.925
Smoker n = 16 n = 21
Unadjusted HR 2.1 (95% CI 1.1–3.9), p = 0.020 2.0 (95% CI 1.1–3.5), p = 0.018
Adjusted for age HR 1.8 (95% CI 1.0–3.1), p = 0.046 2.0 (95% CI 1.1–3.4), p = 0.015
AUC 0.67 (95% CI 0.50–0.83) 0.65 (95% CI 0.51–0.79)
Non-smoker n = 19 n = 31
Unadjusted HR 2.4 (95% CI 1.4– 4.2), p = 0.001 2.1 (95% CI 1.4–3.2), p = 0.001
Adjusted for age HR 1.7 (95% CI 1.0–2.9), p = 0.038 1.5 (95% CI 1.0–2.3), p = 0.059
AUC 0.70 (95% CI 0.55–0.84) 0.68 (95% CI 0.56–0.79)
Age pa = 0.683 pa = 0.596
>60 n = 32 n = 43
Unadjusted HR 1.6 (95% CI 1.1–2.4), p = 0.019 1.6 (95% CI 1.1–2.2), p = 0.011
Adjusted for gender HR 1.4 (95% CI 0.9–2.2), p = 0.089 1.4 (95% CI 1.0–2.0), p = 0.070
AUC 0.63 (95% CI 0.50–0.76) 0.64 (95% CI 0.52–0.75)
≤ 60 n = 3 n = 9
Unadjusted HR 3.2 (95% CI 0.8–13.2), p = 0.113 1.6 (95% CI 0.7–3.9), p = 0.252
Adjusted for gender HR 2.9 (95% CI 0.7–12.6), p = 0.155 1.3 (95% CI 0.6–3.1), p = 0.539
AUC 0.77 (95% CI 0.50–1.0) 0.63 (95% CI 0.44–0.81)
ap-Value for subgroup interaction. Data for univariable and multivariable analyses are given as HR (95% CI) and p-value. Data regarding prognostic analysis are given as AUC (95% CI). A higher AUC reflects greater accuracy: 0.5, the null value, indicates coin-toss accuracy, while 1.0, the maximum value indicates 100% accuracy. p-Values in bold type are statistically significant at < 0.05. The univariable model includes: the natural logarithmic value of admission copeptin blood concentrations. The bivariable model includes: the natural logarithmic value of admission copeptin blood concentrations and patient age or gender, depending on the subgroup. The fully adjusted model includes: the natural logarithmic value of admission copeptin blood concentrations and patient age, gender, randomisation arm, antibiotic use initially, smoking history, comorbidities and type of infection.
data from the hospital setting to primary care and suggest
that this marker may be useful in the risk assessment of
this patient population.
Several studies have reported associations of copeptin
levels with adverse outcomes, namely mortality [15–30].
It has been speculated that through its implication in
the stress response, copeptin may help to detect higher
severity of somatic disease. In patients with chest pain,
for example, low copeptin levels can exclude myocardial
infarction with high NPV [36]. Similarly, in patients with
respiratory infection and low copeptin levels, adverse
clinical outcomes are highly unlikely. In our study, a
copeptin level of ≤ 3 pmol/L had an NPV of 93.6% for
mor-tality and thus makes this endpoint highly unlikely.
Con-versely, in patients with copeptin ≥ 15 pmol/L mortality is
much more likely as evidenced by a PPV of 19.5%.
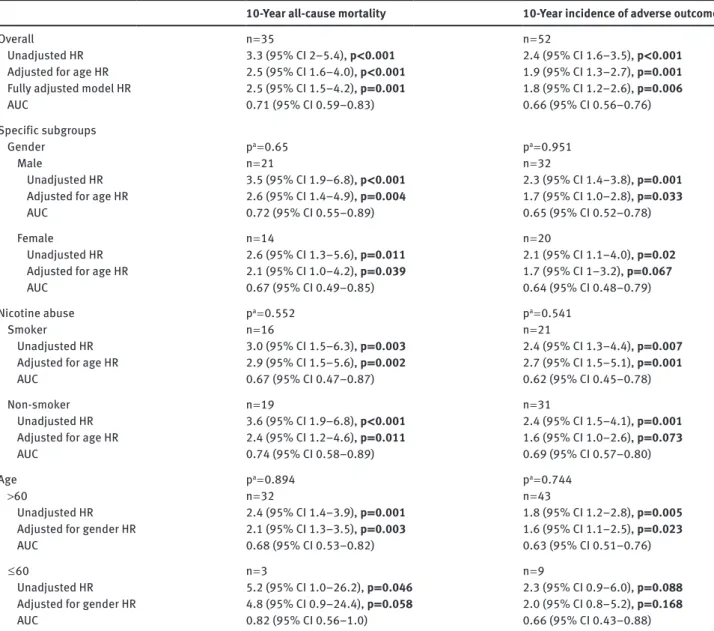
Table 3: Association between copeptin blood levels at day 7 follow-up and outcomes: 10-year all-cause mortality and 10-year incidence of adverse outcome.
10-Year all-cause mortality 10-Year incidence of adverse outcome
Overall n = 35 n = 52
Unadjusted HR 3.3 (95% CI 2–5.4), p < 0.001 2.4 (95% CI 1.6–3.5), p < 0.001 Adjusted for age HR 2.5 (95% CI 1.6–4.0), p < 0.001 1.9 (95% CI 1.3–2.7), p = 0.001 Fully adjusted model HR 2.5 (95% CI 1.5–4.2), p = 0.001 1.8 (95% CI 1.2–2.6), p = 0.006
AUC 0.71 (95% CI 0.59–0.83) 0.66 (95% CI 0.56–0.76)
Specific subgroups
Gender pa = 0.65 pa = 0.951
Male n = 21 n = 32
Unadjusted HR 3.5 (95% CI 1.9–6.8), p < 0.001 2.3 (95% CI 1.4–3.8), p = 0.001 Adjusted for age HR 2.6 (95% CI 1.4–4.9), p = 0.004 1.7 (95% CI 1.0–2.8), p = 0.033
AUC 0.72 (95% CI 0.55–0.89) 0.65 (95% CI 0.52–0.78)
Female n = 14 n = 20
Unadjusted HR 2.6 (95% CI 1.3–5.6), p = 0.011 2.1 (95% CI 1.1–4.0), p = 0.02
Adjusted for age HR 2.1 (95% CI 1.0–4.2), p = 0.039 1.7 (95% CI 1–3.2), p = 0.067
AUC 0.67 (95% CI 0.49–0.85) 0.64 (95% CI 0.48–0.79)
Nicotine abuse pa = 0.552 pa = 0.541
Smoker n = 16 n = 21
Unadjusted HR 3.0 (95% CI 1.5–6.3), p = 0.003 2.4 (95% CI 1.3–4.4), p = 0.007
Adjusted for age HR 2.9 (95% CI 1.5–5.6), p = 0.002 2.7 (95% CI 1.5–5.1), p = 0.001
AUC 0.67 (95% CI 0.47–0.87) 0.62 (95% CI 0.45–0.78)
Non-smoker n = 19 n = 31
Unadjusted HR 3.6 (95% CI 1.9–6.8), p < 0.001 2.4 (95% CI 1.5–4.1), p = 0.001 Adjusted for age HR 2.4 (95% CI 1.2–4.6), p = 0.011 1.6 (95% CI 1.0–2.6), p = 0.073
AUC 0.74 (95% CI 0.58–0.89) 0.69 (95% CI 0.57–0.80)
Age pa = 0.894 pa = 0.744
>60 n = 32 n = 43
Unadjusted HR 2.4 (95% CI 1.4–3.9), p = 0.001 1.8 (95% CI 1.2–2.8), p = 0.005
Adjusted for gender HR 2.1 (95% CI 1.3–3.5), p = 0.003 1.6 (95% CI 1.1–2.5), p = 0.023
AUC 0.68 (95% CI 0.53–0.82) 0.63 (95% CI 0.51–0.76)
≤ 60 n = 3 n = 9
Unadjusted HR 5.2 (95% CI 1.0–26.2), p = 0.046 2.3 (95% CI 0.9–6.0), p = 0.088
Adjusted for gender HR 4.8 (95% CI 0.9–24.4), p = 0.058 2.0 (95% CI 0.8–5.2), p = 0.168
AUC 0.82 (95% CI 0.56–1.0) 0.66 (95% CI 0.43–0.88)
ap-Value for subgroup interaction. Data for univariable and multivariable analyses are given as HR (95% CI) and p-value. Data regarding prognostic analysis are given as AUC (95% CI). A higher AUC reflects greater accuracy: 0.5, the null value, indicates coin-tossaccuracy, while 1.0, the maximum value indicates 100% accuracy. p-Values in bold type are statistically significant at < 0.05. The univariable model includes: the natural logarithmic value of day 7 follow-up copeptin blood concentrations. The bivariable model includes: the natural loga-rithmic value of day 7 follow-up copeptin blood concentrations and patient age or gender, depending on the subgroup. The fully adjusted model includes: the natural logarithmic value of day 7 follow-up copeptin blood concentrations and patient age, gender, randomisation arm, antibiotic use initially, smoking history, comorbidities and type of infection.
Copeptin also showed statistically significant
asso-ciations with the incidence of adverse outcomes defined
as death, pulmonary embolism or major adverse cardiac
and cerebrovascular events. However, associations were
not found for stroke and MACCE themselves, but there are
possible explanations. First, our study had only a limited
number of patients suffering events, owing to the
gener-ally healthy patient population under study with a low
burden of comorbidities. Further, our results indicate that
copeptin, as a marker of non-specific stress response, is
better at tracking the risk of death than predicting the
incidence of cardio- and/or cerebrovascular events. For
example, Sun et al. found in a meta-analysis with 14,395
cardio-cerebrovascular patients that copeptin was
asso-ciated with all-cause mortality [37]. Therefore, copeptin
seems to be more accurate in identifying the patients at
Figure 1: Forest plot of copeptins prognostic accuracy in predicting 10-year all-cause mortality in different patients subgroups.
Figure 2: 10-year Kaplan-Meier survival and without adverse outcome curve according to baseline copeptin blood concentration. Plots showing the association between endpoint and copeptin quartiles, 4th quartile vs. 1st–3rd quartiles and between 1st, 2nd, 3rd and 4th quartile.
risk of death, rather than in predicting specific medical
diagnosis in a long-term follow-up of generally healthy
outpatients. Nonetheless, we are aware that there are
studies showing an association of copeptin levels with
MACCE and stroke in subpopulations such as patients
with type 2 diabetes [27, 38] or undergoing haemodialysis
[39], and that copeptin seems to be a valid biomarker to
potentially rule out acute myocardial infarction, in the
acute phase of the disease [36, 40–43].
In our study population, copeptin blood levels were
not significantly influenced by age, gender or smoking
status, confirmed statistically in the interaction analysis.
Former studies demonstrated similar results with no
sig-nificant correlation of copeptin with gender [44] or age
[34]. Bosselmann et al. showed that copeptin and other
cardiovascular biomarkers are closely associated with
renal function in heart failure. Still, the marker was useful
for risk stratification independently of renal function [45].
Also, Choi et al. found a standardised mean difference by
study region with significant differences in copeptin blood
levels, but a positive consistent association of copeptin
with poor prognosis [46].
Interestingly, we had access to copeptin levels on
admission to the GP’s office, i.e. in patients suffering
from ARTI and 7 days later when the infection may have
been cured. Our results suggest that copeptin blood levels
taken on a 7-day follow-up have a slightly stronger
asso-ciation with outcome compared to admission results for
mortality and adverse clinical outcome prediction. In
con-trast, a meta-analysis of Choi et al. in a different setting
showed that early measurement of plasma copeptin in
the patients with acute stroke provides better prognostic
information about the functional outcome and mortality
[46]. Because differences in our study sample were small,
further research is needed to define the optimal usage of
this marker in the GP setting.
As mentioned before, measurements of copeptin
levels have been demonstrated to be useful in a variety of
clinical scenarios. The potential benefit of copeptin
com-pared to other biomarkers is due to its central role as a
marker for a key hormone in the body. It is not restricted
to a single organ system and is triggered by many disease
processes. This lack of specificity with regard to the
underlying diagnosis may be an advantage as a more
generalisable marker for severe disturbances in patient
physiology [14].
Katan et al. have shown that copeptin levels mirror
different levels of stress more accurately than cortisol
[28]. Cortisol measurements are limited by, for example,
cross-reactivity with other steroids [47]; its concentration
varies with the amount of hormone-binding proteins,
underlies a circadian rhythm [48] and changes with food
intake [49].
The main strengths of this study include the
participa-tion of multiple GP practices, the long follow-up period of
10 years and the community sample of patients with ARTI
of different severity representative for patients mainly
treated in primary care.
However, we are aware of several limitations. Firstly,
the incomplete baseline risk assessment in the original
cohort, in particular, missing certain blood parameters
such as lipid values or blood pressure, does not allow
us to investigate whether copeptin would improve
state-of-the-art risk scores (e.g. Framingham). Secondly, while
the register of deaths could confirm the survival status of
the patients, no information was available on the cause of
death. There is also the possibility that the GPs have not
seen their patients on a regular basis, or that the relatives
did not remember their medical information. Therefore,
we limited our analysis to all-cause mortality rather than
to cause-specific mortality. Thirdly, we lack in
comprehen-sive measurement of confounders. Thus, our results are
biased by confounding we cannot control for. Finally, our
sample was small in size with a follow-up rate of 78.5%
and we observed only few events. We were therefore not
able to look into short-term adverse outcomes in this study
and a larger trial is needed.
Conclusions
In a sample of community-dwelling patients visiting their
GP for a respiratory infection, copeptin was associated
with a 10-year all-cause mortality. In conjunction with
tra-ditional risk factors, this marker may help to better direct
preventive measures in this population. Still, further
evi-dence must determine the role of copeptin in primary care
as a marker of risk stratification, by evaluating whether
preventive interventions help to reduce mortality risk in
this population.
Acknowledgments: We are grateful to the physicians, their
staffs and patients who participated in the PARTI trial and
the follow-up data collection. We would also like to thank
the staff of the central laboratory of the University
Hospi-tal Basel for their assistance and technical support.
Author contributions: Mr. Odermatt and Ms. Bolliger
contributed equally to this study. Mr. Odermatt,
Ms. Bolliger and Dr. Schuetz had full access to all of the
data in the study and take responsibility for the
integ-rity of the data and performed the statistical work, and
drafted the manuscript. All authors helped to interpret
the findings, read and revised the manuscript critically
for important intellectual content, and approved the final
version of the manuscript.
Research funding: This investigator-initiated PARTI trial
was sponsored by a grant from the Swiss National Science
Foundation (3300C0-107772) and by the Association for
the Promotion of Science and Postgraduate Training of
the University Hospital Basel. B.R.A.H.M.S AG provided
assay and kit material related to the study. Dr. Schuetz
and Dr. Christ-Crain were supported by funds from the
Freiwillige Akademische Gesellschaft, the Department
of Endocrinology, Diabetology and Clinical Nutrition,
and the Department of Clinical Chemistry, all Basel,
Switzerland. Drs. Christ-Crain, Mueller, and Schuetz,
received support from B.R.A.H.M.S to attend meetings
and fulfilled speaking engagements. Drs. Schuetz,
Christ-Crain and Mueller received support from bioMérieux to
attend meetings and fulfilled speaking engagements.
Dr. Mueller has served as a consultant and received
research support from B.R.A.H.M.S and bioMérieux. All
other authors declare that the answer to the questions on
the competing interest form is all “No” and therefore have
nothing to declare.
Employment or leadership: None declared.
Honorarium: None declared.
Competing interests: The funding organization(s) played
no role in the study design; in the collection, analysis, and
interpretation of data; in the writing of the report; or in the
decision to submit the report for publication.
References
1. Schuetz P, Hausfater P, Amin D, Amin A, Haubitz S, Faessler L, et al. Biomarkers from distinct biological pathways improve early risk stratification in medical emergency patients: the multinational, prospective, observational TRIAGE study. Crit Care 2015;19:377.
2. Schuetz P. “Personalized” sepsis care with the help of specific biomarker levels on admission and during follow up: are we there yet? Clin Chem Lab Med 2015;53:515–7.
3. Kutz A, Briel M, Christ-Crain M, Stolz D, Bouadma L, Wolff M, et al. Prognostic value of procalcitonin in respiratory tract infections across clinical settings. Crit Care 2015;19:74.
4. Grolimund E, Kutz A, Marlowe RJ, Vogeli A, Alan M, Christ-Crain M, et al. Long-term prognosis in COPD exacerbation: role of biomarkers, clinical variables and exacerbation type. Chron Obstruct Pulmon Dis 2015;12:295–305.
5. Alan M, Grolimund E, Kutz A, Christ-Crain M, Thomann R, Falconnier C, et al. Clinical risk scores and blood biomarkers as predictors of long-term outcome in patients with community-acquired pneumonia: a 6-year prospective follow-up study. J Intern Med 2015;278:174–84.
6. Blum CA, Mirza U, Christ-Crain M, Mueller B, Schindler C, Puder JJ. Copeptin levels remain unchanged during the menstrual cycle. PLoS One 2014;9:e98240.
7. Urwyler SA, Schuetz P, Sailer C, Christ-Crain M. Copeptin as a stress marker prior and after a written examination – the CoEXAM study. Stress 2015;18:134–7.
8. Land H, Schutz G, Schmale H, Richter D. Nucleotide sequence of cloned cDNA encoding bovine arginine vasopressin-neurophysin II precursor. Nature 1982;295:299–303.
9. Bolignano D, Cabassi A, Fiaccadori E, Ghigo E, Pasquali R, Pera-cino A, et al. Copeptin (CTproAVP), a new tool for understanding the role of vasopressin in pathophysiology. Clin Chem Lab Med 2014;52:1447–56.
10. Gillies GE, Linton EA, Lowry PJ. Corticotropin releasing activity of the new CRF is potentiated several times by vasopressin. Nature 1982;299:355–7.
11. Rivier C, Vale W. Modulation of stress-induced ACTH release by corticotropin-releasing factor, catecholamines and vasopressin. Nature 1983;305:325–7.
12. Rivier C, Vale W. Interaction of corticotropin-releasing factor and arginine vasopressin on adrenocorticotropin secretion in vivo. Endocrinology 1983;113:939–42.
13. Milsom SR, Conaglen JV, Donald RA, Espiner EA, Nicholls MG, Livesey JH. Augmentation of the response to CRF in man: relative contributions of endogenous angiotensin and vasopressin. Clin Endocrinol (Oxf) 1985;22:623–9.
14. Nickel CH, Bingisser R, Morgenthaler NG. The role of copeptin as a diagnostic and prognostic biomarker for risk stratification in the emergency department. BMC Med 2012;10:7.
15. Iversen K, Gotze JP, Dalsgaard M, Nielsen H, Boesgaard S, Bay M, et al. Risk stratification in emergency patients by copeptin. BMC Med 2014;12:80.
16. Seligman R, Papassotiriou J, Morgenthaler NG, Meisner M, Teixeira PJ. Copeptin, a novel prognostic biomarker in ventilator-associated pneumonia. Crit Care 2008;12:R11.
17. Jochberger S, Zitt M, Luckner G, Mayr VD, Wenzel V, Ulmer H, et al. Postoperative vasopressin and copeptin levels in non-cardiac surgery patients: a prospective controlled trial. Shock 2009;31:132–8.
18. Christ-Crain M, Opal SM. Clinical review: the role of biomark-ers in the diagnosis and management of community-acquired pneumonia. Crit Care 2010;14:203.
19. Kim SH, Chung JH, Lee JC, Park YH, Joe JH, Hwang HJ. Carboxy-terminal provasopressin may predict prognosis in nursing home acquired pneumonia. Clin Chim Acta 2013;421:226–9.
20. Dong X, Tao DB, Wang YX, Cao H, Xu YS, Wang QY. Plasma copeptin levels in Chinese patients with acute ischemic stroke: a preliminary study. Neurol Sci 2013;34:1591–5.
21. Meisel A, Meisel C, Harms H, Hartmann O, Ulm L. Predicting post-stroke infections and outcome with blood-based immune and stress markers. Cerebrovasc Dis 2012;33:580–8.
22. Khan SQ, Dhillon OS, O’Brien RJ, Struck J, Quinn PA,
Morgenthaler NG, et al. C-terminal provasopressin (copeptin) as a novel and prognostic marker in acute myocardial infarction: Leicester Acute Myocardial Infarction Peptide (LAMP) study. Circulation 2007;115:2103–10.
23. Gegenhuber A, Struck J, Dieplinger B, Poelz W, Pacher R, Morgenthaler NG, et al. Comparative evaluation of B-type natriu-retic peptide, regional pro-A-type natriunatriu-retic peptide, mid-regional pro-adrenomedullin, and Copeptin to predict 1-year
mortality in patients with acute destabilized heart failure. J Card Fail 2007;13:42–9.
24. Stoiser B, Mortl D, Hulsmann M, Berger R, Struck J,
Morgenthaler NG, et al. Copeptin, a fragment of the vasopressin precursor, as a novel predictor of outcome in heart failure. Eur J Clin Invest 2006;36:771–8.
25. Maisel A, Xue Y, Shah K, Mueller C, Nowak R, Peacock WF, et al. Increased 90-day mortality in patients with acute heart failure with elevated copeptin: secondary results from the Biomarkers in Acute Heart Failure (BACH) study. Circ Heart Fail 2011;4:613–20. 26. Then C, Kowall B, Lechner A, Meisinger C, Heier M, Koenig W,
et al. Plasma copeptin is associated with type 2 diabetes in men but not in women in the population-based KORA F4 study. Acta Diabetol 2015;52:103–12.
27. Enhorning S, Hedblad B, Nilsson PM, Engstrom G, Melander O. Copeptin is an independent predictor of diabetic heart disease and death. Am Heart J 2015;169:549–56.e1.
28. Katan M, Muller B, Christ-Crain M. Copeptin: a new and promis-ing diagnostic and prognostic marker. Crit Care 2008;12:117. 29. Alehagen U, Dahlstrom U, Rehfeld JF, Goetze JP. Association of
copeptin and N-terminal proBNP concentrations with risk of cardiovascular death in older patients with symptoms of heart failure. J Am Med Assoc 2011;305:2088–95.
30. Balling L, Kistorp C, Schou M, Egstrup M, Gustafsson I, Goetze JP, et al. Plasma copeptin levels and prediction of outcome in heart failure outpatients: relation to hyponatremia and loop diuretic doses. J Card Fail 2012;18:351–8.
31. Briel M, Schuetz P, Mueller B, Young J, Schild U, Nusbaumer C, et al. Procalcitonin-guided antibiotic use vs a standard approach for acute respiratory tract infections in primary care. Arch Intern Med 2008;168:2000–7; discussion 7–8.
32. Briel M, Christ-Crain M, Young J, Schuetz P, Huber P, Periat P, et al. Procalcitonin-guided antibiotic use versus a standard approach for acute respiratory tract infections in primary care: study protocol for a randomised controlled trial and baseline characteristics of participating general practitioners [ISRCTN73182671]. BMC Fam Pract 2005;6:34.
33. Schuetz P, Chiappa V, Briel M, Greenwald JL. Procalcitonin algo-rithms for antibiotic therapy decisions: a systematic review of randomized controlled trials and recommendations for clinical algorithms. Arch Intern Med 2011;171:1322–31.
34. Morgenthaler NG, Struck J, Alonso C, Bergmann A. Assay for the measurement of copeptin, a stable peptide derived from the precursor of vasopressin. Clin Chem 2006;52:112–9. 35. Morgenthaler NG, Struck J, Jochberger S, Dunser MW.
Copep-tin: clinical use of a new biomarker. Trends Endocrinol Metab 2008;19:43–9.
36. Reichlin T, Hochholzer W, Stelzig C, Laule K, Freidank H, Morgenthaler NG, et al. Incremental value of copeptin for rapid rule out of acute myocardial infarction. J Am Coll Cardiol 2009;54:60–8.
37. Sun H, Sun T, Ma B, Yang BW, Zhang Y, Huang DH, et al. Prediction of all-cause mortality with copeptin in
cardio-cerebrovascular patients: a meta-analysis of prospective studies. Peptides 2015;69:9–18.
38. Mellbin LG, Ryden L, Brismar K, Morgenthaler NG, Ohrvik J, Catrina SB. Copeptin, IGFBP-1, and cardiovascular progno-sis in patients with type 2 diabetes and acute myocardial infarction: a report from the DIGAMI 2 trial. Diabetes Care 2010;33:1604–6.
39. Fenske W, Wanner C, Allolio B, Drechsler C, Blouin K, Lilienthal J, et al. Copeptin levels associate with cardiovascular events in patients with ESRD and type 2 diabetes mellitus. J Am Soc Nephrol 2011;22:782–90.
40. Keller T, Tzikas S, Zeller T, Czyz E, Lillpopp L, Ojeda FM, et al. Copeptin improves early diagnosis of acute myocardial infarc-tion. J Am Coll Cardiol 2010;55:2096–106.
41. Afzali D, Erren M, Pavenstadt HJ, Vollert JO, Hertel S, Waltenberger J, et al. Impact of copeptin on diagnosis, risk stratification, and intermediate-term prognosis of acute coronary syndromes. Clin Res Cardiol 2013;102:755–63. 42. Lipinski MJ, Escarcega RO, D’Ascenzo F, Magalhaes MA,
Baker NC, Torguson R, et al. A systematic review and
collaborative meta-analysis to determine the incremental value of copeptin for rapid rule-out of acute myocardial infarction. Am J Cardiol 2014;113:1581–91.
43. Maisel A, Mueller C, Neath SX, Christenson RH,
Morgenthaler NG, McCord J, et al. Copeptin helps in the early detection of patients with acute myocardial infarction: primary results of the CHOPIN trial (Copeptin Helps in the early detection Of Patients with acute myocardial INfarction). J Am Coll Cardiol 2013;62:150–60.
44. Balmelli C, Meune C, Twerenbold R, Reichlin T, Rieder S, Drexler B, et al. Comparison of the performances of cardiac troponins, including sensitive assays, and copeptin in the diagnostic of acute myocardial infarction and long-term progno-sis between women and men. Am Heart J 2013;166:30–7. 45. Bosselmann H, Egstrup M, Rossing K, Gustafsson I,
Gustafsson F, Tonder N, et al. Prognostic significance of cardio-vascular biomarkers and renal dysfunction in outpatients with systolic heart failure: a long term follow-up study. Int J Cardiol 2013;170:202–7.
46. Choi KS, Kim HJ, Chun HJ, Kim JM, Yi HJ, Cheong JH, et al. Prog-nostic role of copeptin after stroke: a systematic review and meta-analysis of observational studies. Sci Rep 2015;5:11665. 47. Diamandis EP. Analysis of serum proteomic patterns for early
cancer diagnosis: drawing attention to potential problems. J Natl Cancer Inst 2004;96:353–6.
48. Venkatesh B, Mortimer RH, Couchman B, Hall J. Evaluation of random plasma cortisol and the low dose corticotropin test as indicators of adrenal secretory capacity in critically ill patients: a prospective study. Anaesth Intensive Care 2005;33:201–9. 49. Knoll E, Muller FW, Ratge D, Bauersfeld W, Wisser H. Influence
of food intake on concentrations of plasma catecholamines and cortisol. J Clin Chem Clin Biochem 1984;22:597–602.
Supplemental Material: The online version of this article (DOI: 10.1515/cclm-2016-0151) offers supplementary material, available to authorized users.