HAL Id: hal-01096511
https://hal.archives-ouvertes.fr/hal-01096511
Submitted on 19 Dec 2014HAL is a multi-disciplinary open access archive for the deposit and dissemination of sci-entific research documents, whether they are pub-lished or not. The documents may come from teaching and research institutions in France or abroad, or from public or private research centers.
L’archive ouverte pluridisciplinaire HAL, est destinée au dépôt et à la diffusion de documents scientifiques de niveau recherche, publiés ou non, émanant des établissements d’enseignement et de recherche français ou étrangers, des laboratoires publics ou privés.
In vivo estimation of pigment composition and optical
absorption cross-sectionby spectroradiometry in four
aquatic photosynthetic micro-organisms
Vona Méléder, Martin Laviale, Bruno Jesus, Jean-Luc Mouget, Johann
Lavaud, Farzaneh Kazemipour, Patrick Launeau, Laurent Barillé
To cite this version:
Vona Méléder, Martin Laviale, Bruno Jesus, Jean-Luc Mouget, Johann Lavaud, et al.. In vivo estima-tion of pigment composiestima-tion and optical absorpestima-tion cross-secestima-tionby spectroradiometry in four aquatic photosynthetic micro-organisms. Journal of Photochemistry and Photobiology B: Biology, Elsevier, 2013, 129, pp.115-124. �10.1016/j.jphotobiol.2013.10.005�. �hal-01096511�
Accepted Manuscript
In vivo estimation of pigment composition and optical absorption cross-section
by spectroradiometry in four aquatic photosynthetic micro-organisms
Vona Méléder, Martin Laviale, Bruno Jesus, Jean Luc Mouget, Johann Lavaud, Farzaneh Kazemipour, Patrick Launeau, Laurent Barillé
PII: S1011-1344(13)00224-8
DOI: http://dx.doi.org/10.1016/j.jphotobiol.2013.10.005
Reference: JPB 9586
To appear in: Journal of Photochemistry and Photobiology B: Bi-ology
Received Date: 22 March 2013 Revised Date: 13 September 2013 Accepted Date: 10 October 2013
Please cite this article as: V. Méléder, M. Laviale, B. Jesus, J.L. Mouget, J. Lavaud, F. Kazemipour, P. Launeau, L. Barillé, In vivo estimation of pigment composition and optical absorption cross-section by spectroradiometry in four aquatic photosynthetic micro-organisms, Journal of Photochemistry and Photobiology B: Biology (2013), doi: http:// dx.doi.org/10.1016/j.jphotobiol.2013.10.005
This is a PDF file of an unedited manuscript that has been accepted for publication. As a service to our customers we are providing this early version of the manuscript. The manuscript will undergo copyediting, typesetting, and review of the resulting proof before it is published in its final form. Please note that during the production process errors may be discovered which could affect the content, and all legal disclaimers that apply to the journal pertain.
In vivo estimation of pigment composition and optical absorption cross-section by
spectroradiometry in four aquatic photosynthetic micro-organisms
Vona Méléder1,2, Martin Laviale1,3, Bruno Jesus1,4, Jean Luc Mouget5, Johann Lavaud2, Farzaneh Kazemipour6,7, Patrick Launeau6 and Laurent Barillé1
1 LUNAM Université, Université de Nantes, MMS-EA 21 60, 2 rue de la Houssinière, BP 92 208, 44322, Nantes Cedex 3, France
2 UMR 7266 ‘LIENSs’, CNRS / University of La Rochelle, Institute for CoastalResearch and Environment (ILE), 2 rue Olympe de Gouges, 17000, La Rochelle Cedex, France
3 Departamento de Biologia and CESAM – Centro de Estudos do Ambiente e do Mar, Universidade de Aveiro, Campus de Santiago, 3810-193 Aveiro, Portugal
4 Centro de Biodiversidade, Genómica Integrativa e Funcional (BioFIG), Faculdade de Ciências, Universidade de Lisboa, Campo Grande, 1749-016 Lisboa, Portugal. 5 LUNAM Université, Université du Maine, MMS-EA 21 60, Avenue Olivier Messiaen, 72085, Le Mans Cedex 9, France
6 LUNAM Université, Université de Nantes et d’Angers, LPGNantes UMR6112 CNRS-INSU, 2 rue de la Houssinière, BP 92 208, 44322, Nantes Cedex 3, France 7 CETIOM, 10 Avenue Dallas, 21000 Dijon
Abstract
The objective of the present study was to estimate in vivo pigment composition and to retrieve absorption cross-section values, a*, of photosynthetic micro-organisms using a non-invasive technique of reflectance spectrometry. To test the methodology, organisms from different taxonomical groups and different pigment composition were used (Spirulina platensis a Cyanophyta, Porphyridium cruentum a Rhodophyta,
Dunaliella tertiolecta a Chlorophyta and Entomoneis paludosa a Bacillariophyta) and
photoacclimated to two different irradiance levels: 25 µmol photon.m-2.s-1 (Low Light, LL) and 500 µmol photon.m-2.s-1 (High Light, HL). Second derivative spectra from reflectance were used to identify pigment in vivo absorption bands that were linked to specific pigments detected by High Performance Liquid Chromatography. Whereas some absorption bands such as those induced by Chlorophyll (Chl) a (416, 440, 625 and around 675 nm) were ubiquous, others were taxonomically specific (e.g. 636 nm for Chl c in E. paludosa) and/or photo-physiological dependent (e.g. 489 nm for zeaxanthin in the HL-acclimated S. platensis). The optical absorption cross-section, a*, was retrieved from reflectance data using a radiative transfer model previously developed for microphytobenthos. Despite the cellular Chl a decrease observed from LL to HL (up to 88 % for S. platensis), the a* increased, except for P. cruentum. This was attributed to a ‘package effect’ and to a greater absorption by photoprotective carotenoids that did not contribute to the energy transfer to the core Chl a.
Key-words: microalgae, cyanobacteria, in vivo absorption bands, reflectance, pigments, absorption cross-section.
1 Introduction
Marine coastal areas, particularly bays and estuaries, are amongst the most productive ecosystems on Earth (e.g. [1]). Polyphyletic photosynthetic microbial
communities (micro-algae, phytoplankton and microphytobenthos, and cyanobacteria) support this high coastal productivity. Their ecological success and adaptability to light variations in such ecosystems are partially explained by the wide plasticity of their photosynthetic apparatus constituted by a variety of light-harvesting proteins and pigments. This variability reflects the large range of photoecological responses of these micro-organisms due to different photoadaptation characteristics and photoacclimation processes [2]. An important consequence is a variability in primary production rates, depending of species and their respective ecophysiology. Estimation of in vivo cell absorption properties in the photosynthetic active radiation (PAR) domain (400 to 700 nm) provides important taxonomic and ecophysiological information. Namely, pigment composition allows to assess the community structure and physiology, whereas the optical absorption cross-section, i.e. a*,provides information about the potential primary production [3]. Frequently, this information is retrieved from absorption signatures measured either in vitro (i.e in solvent-extracted pigments) or in vivo (i.e. in intact cells) [3]. Pigment absorption properties are dependent on their molecular environment thus the in vitro estimations are subject to important constraints [4, 5]. Firstly, pigment absorption maxima usually shifts from in
vitro measurements in comparison to in vivo measurements. This shift can vary from
a few to hundreds of nanometers, depending on the pigment, the association with protein complexes (i.e. Light Harvesting Complexes, LHC) and the pigment location inside the cell [4-8]. Consequently, the assignment of each absorption band to its respective pigment is very difficult to achieve [4]. Secondly, in vivo absorption is always lower than in vitro leading to a misestimation of a* [2]. To overcome these constraints, in vivo measurements of absorbance signatures can be performed by spectrophotometry, either on cell suspensions or on thylakoids and isolated LHCs [9,
10]. Spectrophotometry assumes that the sample is homogenous, and that cell concentration (or thylakoids or LHCs) is high enough to detect absorption, but low enough to avoid self-shading. Furthermore, the absorption measurements can be affected by light scattering caused by cells in suspension [3]. Some improvements have been proposed, including the use of an integrative sphere or placing the sample (cells on wet glass-fiber filters) close to the detector [5, 11-13]. However, these methods are constrained by the need for β-correction algorithms to remove the path length amplification effect due to the filter [12]. Therefore, there is a growing interest in using non-destructive techniques to investigate micro-algal absorption properties while simultaneously limiting the scattering effect. Recently, reflectance spectroradiometric techniques have been used to assess micro-algal pigment composition [7, 14-17]. Reflectance spectra can be studied using derivative analysis, a technique which is particularly useful in removing the scattering effect from absorption spectra and in resolving overlapping spectral features [18]. Derivative analysis have been used to detect absorption bands due to electronic transitions [9] and to assess the light-dependent (de-)epoxidation of xanthophylls [10, 16]. Despite the great potential of this technique, few studies have used it to assess the pigment content of micro-algae and to investigate all pigment specific absorption bands [16, 19-21]. Recently, Kazemipour et al. [14] developed a radiative transfer model (MPBOM, MicroPhytoBenthos Optical Model) which allows the determination of microphytobenthos biofilm absorption coefficients using reflectance measurements without destroying the biofilm. This dimensionless coefficient corresponds to the optical cross-section, a*, when it is divided by the chlorophyll (Chl) a concentration (m2.mg Chla-1). Initially developed for benthic microalgae, this model can be applied to any other photosynthetic microorganisms.
The objective of the present study was to use reflectance data to estimate in vivo pigment composition and determination of a* values from different photosynthetic microbial species. Pigment composition was estimated from spectral reflectance using second derivative analysis and a* was calculated using the MPBOM radiative transfer model. To validate the methods, a variety of microbial species were investigated: one Cyanophyta, one Rhodophyta, one Chlorophyta and one Bacillariophyta (diatom). Intraspecific variability was also explored by cultivating all species at two different irradiance levels expected to induce photoacclimation pigment changes at the cell level.
2 Materials and methods
2.1 Biological material
Three species of eukaryotic micro-algae and one of cyanobacteria were chosen for their different pigment signatures: one ‘green’ species, Dunaliella tertiolecta (Chlorophyceae, Chlorophyta), one ‘brown’ species, Entomoneis paludosa (Diatoms, Heterokontophyta), one ‘blue’, Spirulina platensis (Oscillatoriaceae, Cyanophyta) and one ‘red’ species, Porphyridium cruentum (Bangiophyceae, Rhodophyta). E.
paludosa and P. cruentum were obtained from the Nantes Culture Collection
(NCC18.2 and NCC48, respectively), D. tertiolecta was obtained from the Provasoli-Guillard National Center for Culture of Marine Phytoplankton (CCMP364) and S.
platensiswas obtained from the Alpha Biotech Company (SARL, Asserac 44410,
France).
E. paludosa, P. cruentum and D.tertiolecta species were grown in f/2 medium [22]. S.
grown in a temperature-controlled culture room (14 ± 1°C, 14/10 h light/dark cycle) in 500-mL glass flasks containing 250 mL of medium at two PAR levels: 25 µmol photon.m-2.s-1 (Low Light, LL) and 500 µmol photon.m-2.s-1 (High Light, HL). Each culture was acclimated during 10 days, and regular dilution of the batch culture with fresh medium allowed to keep cells into exponential stage and minimize self-shading. A thin compact layer of micro-algal cells, hereafter named ‘experimental biofilm’, was deposited on appropriate filters according to Kazemipour et al. [14]. For each culture, 5 mL were gently filtered (<1 bar) through glass microfiber filters (GF/C, 25 mm Ø, 1.2 µm porosity). This volume and the corresponding cell concentrations were sufficient to form a thin and homogenous compact layer of cells covering the filter surface (~ 1.8 cm2) while reducing the distance between cells and limiting light scattering [14]. To estimate the amount of cells on filters, each culture was sampled. Before any reflectance measurement was carried out, the experimental biofilms were placed 10 min under the corresponding PAR levels (i.e. HL or LL) to minimize rapid changes in pigment composition due to stress. For each PAR level, two filters were used for each culture run in triplicate (n=6). Biofilm desiccation during measurements was minimized by maintaining the filters on absorbent paper soaked with culture medium. Reflectance spectra were standardized with reference filters obtained by filtering 5 mL of the corresponding medium alone.
2.2 Radiometric measurements and interpretations
Radiometric measurements were performed using an ASD Fieldspec3 FR® portable spectroradiometer that measures radiance (mW.cm-2.nm-2.sr-1) in the visible-infrared region of the light spectrum (between 400 and 2500 nm), with a 3 nm spectral resolution and a 1.4 nm sampling interval in the 400-1000 nm wavelength range. The
light source was provided by an internal halogen lamp and the distance between the biofilm and the ASD optical fiber was kept constant by using the ASD High Intensity Contact Probe. This procedure minimizes errors associated with stray light. Reflectance (ρ, dimentionless) was calculated as the ratio between the radiance of the cells on filters and the incident radiance measured on a perfect diffuser (Spectralon® 99%). Ten spectra were recorded and averaged for each filter. Reflectance was standardized (ρstd) to facilitate comparisons between the spectral signatures of cells acclimated to different light conditions following Eq. (1):
ρ
ρ
ρ
ρ
9251
×
=
F std (1)whereρstd is the standardized reflectance, ρ is the reflectance of the experimental biofilm, ρF, is the reflectance of a wet filter with no biofilm, and ρ925 is the reflectance of the experimental biofilm at 925 nm which is insensitive to the pigment content of cells [7, 14].
Second derivative spectra (δδ) were calculated following Jesus et al. [16, 19] and second derivative peaks were used to assign pigments to absorption wavelengths. To facilitate the comparison between species and light-acclimation conditions, the second derivative values were standardized (δδstd), following Eq. (2), to the maximum value between 650 and 690 (δδred), which is characteristic of Chl a red absorption:
red std
δδ
δδ
δδ
=
(2)2.3 Pigment analysis by High Performance Liquid Chromatography (HPLC)
Following radiometric measurements, the filters were immediately frozen in liquid nitrogen, and stored at -80°C until pigment extraction and analysis. Pigment analysis
was performed on 3 filters for each culture and each PAR level (n=3) with a Waters® HPLC device as described in Méléder et al. [7]. Pigments were extracted after thawing in 90% acetone, ground and left for 24 h in the dark at +4°Cas recommended by Mantoura and Llewellyn [24]. Acetonic extracts were filtered (porosity: 0.45 µm) and diluted volume-to-volume in 1 M ammonium acetate. The HPLC protocol followed Mantoura and Llewellyn [24] adapted by Méléder et al. [7]. Sample volumes of 100 µL were injected and pigments were detected by photodiode array and characterized by their absorption spectra between 400 and 800 nm and their retention time [25, 26]. Quantification was carried out at 440 nm using previously established pigment calibration with purified standards following Brotas and Plante-Cuny [27]. For some pigments, the contents of their derivatives were summed: Chl a and its allomers = Chl a; chlorophyll c1 and c1 + c2 = Chl c; fucoxanthin and
fucoxanthin by-products = Fuco. Data were presented as cellular pigment contents (µg.cell–1), weight to weight pigment ratios (g.g–1) and pigment content per unit area (mg.m-2).
2.4 Absorption cross-section estimation
The MPBOM quantitative radiative transfer model was used to estimate a* using the programming language IDL (Interactive Data Language) on ENVI 4.3 software. This model requires the input of biofilm reflectance spectra and the background reflectance spectra (i.e. wet filters without cells). One of the model outputs model is the absorption coefficient (α). This is related to the weighted concentration (Ci) and to
the specific extinction coefficient (εi) at any wavelength of the m pigments present in
the cells (Eq. 3):
C
i m i∑
=
ε
α
(3)α is dimensionless but when divided by the amount of Chl a (in mg.m-2) it corresponds to the absorption cross-section, a* (m2.mg Chla-1). a corresponds to * the averaged optical cross-section for the PAR domain, whereas a*redcorresponds to
the average for the domain of the red absorption of Chl a between 670 and 685 nm. For comparison between light treatments, ∆a* was calculated for each species. This measures the variation in absorption properties between LL and HL conditions and is associated with differences in Chl a (∆Chl a) cellular content.
All statistical analyses and graphical results were carried out in R statistical computing environment (2.6.1 [28]). Data normality was tested with the Shapiro-Wilk test while the effects of light acclimation (HL vs. LL) were tested using Student’s t-test.
3 Results
3.1 Pigment analysis by HPLC 3.1.1 Pigment composition
In total, 14 liposoluble pigments (3 chlorophylls and 11 carotenoids) were detected and identified in this study (Table 1). D. tertiolecta showed the most diverse pigment composition (8 pigments), followed by E. paludosa and S. platensis (6 pigments) while only 3 pigments were detected in P. cruentum. Chl a and β-carotene (β-car) were detected in all organisms, while other pigments were species-specific: diadinoxanthin (DD), diatoxanthin (DT), fucoxanthin (Fuco) and Chl c were present in
E. paludosa only; neoxanthin (NX), antheraxanthin (AX), lutein (Lut) and Chl b only in
contrast, P. cruentum did not exhibit any specific liposoluble pigments showing only Chl a, β-car and zeaxanthin (ZX).
3.1.2 Pigment changes in response to light
Light did not seem to have a large effect on the qualitative pigment composition. Only few pigments were detected exclusively in one of the two light conditions: violaxanthin (VX) in HL-acclimated S. platensis cells, Chl b in LL-acclimated
D.tertiolecta cells and β-car in LL-acclimated cells for all the species except P.
cruentum. It was assumed that the apparent lack of Chl b and β-car detection in
HL-acclimated species was due to concentrations below the PDA detection threshold, rather than a true absence of pigments in the cells.
The cellular Chl a content for each species significantly decreased (t-test, p < 0.05) from LL to HL conditions, illustrating the photoacclimation effect (Table 2). Considering the other detected pigments, most of their cellular content followed the same trend with asignificant decrease (t-test, p < 0.05) from LL to HL condition, with the exception of DT in E. paludosa, VX in S. platensis and ZX in P. cruentum which significantly increased (p < 0.05), AX in D. tertiolecta and DD in E. paludosa which remained stable (p > 0,05) (results not shown).The resulting pigment/Chl a ratios for each species at each irradiance are presented in Table 3. Notably, only Fuco:Chl a and Chl c:Chl a ratios (in E. paludosa) were not affected by the growth irradiance.
3.1.3 Pigment content on filters
The amount of Chl a collected on the different filters varied from 0.56 mg.m-2 ± 0.09
on S. platensis HL-filters to 18.98 mg.m-2 ± 1.26 on E. paludosa LL-filters (Figure 1).
to HL filters (Table 2), thus the significant increase of pigment contents on LL-filters could only be the result of the increase in pigment cellular contents as a consequence of the light treatments. Only for D. tertiolecta and P. cruentum few pigments remained stable on filters (t-test, p = 0.5, figure 1).
For D. tertiolecta filters, Chl b, VX, and β-car followed the same trend as Chl a, and
the opposite of AX (Figure 1a). Moreover, Lut, ZX and NX contents were comparable in HL and LL filters (p = 0.48, 0.23 or 0.25, respectively). In E. paludosa, the content of Fuco, Chlc and β-car was higher in LL-filters, while it was similar for DD (p = 0.6) and significantly higher in HL-filters for DT (Figure 1b). S. platensis showed the largest Chl a decrease (up to 5.5 times) from LL to HL-filters and all the other pigments followed the same trend (p ≤ 0.05) (Figure 1c). Finally, pigment contents of HL and LL-filters of P. cruentum were not significantly different (p > 0.1).
3.2 Radiometric analysis
Standardized reflectance spectra showed a similar shape whatever the species and the growth light conditions (Figure 2). A large absorption band in the blue domain, from 400 to 550/600 nm, was clearly visible followed by a transmittance peak and a second absorption band in the red domain around 675 nm. The transmittance peak varied in shape and was notched by smaller absorption bands: three in D.tertiolecta (Figure 2a), two in E. paludosa (Figure 2b), and one in S. platensis and P. cruentum (Figures 2c and d). Overall, reflectance values were lower in LL-acclimated cells indicating a higher absorbance. Almost no marked differences between species or light acclimation conditions could be inferred from the reflectance spectra, with the exception of the more pronounced 480 nm absorption band in LL-acclimated
The analysis of second derivative spectra improved the comparison between samples because each absorption peak could be assigned to an absorption band (Figure 3).
Some of the second derivative peaks were detected in all species, whatever the growth irradiance, while others were species- and growth irradiance-specific. Ubiquitous peaks were (Figure 3, downward arrows): ~ 416 nm; ~ 440 nm; ~ 462 (except LL-acclimated D.tertiolecta and S. platensis cells); ~ 546 nm and ~ 586 nm; ~ 625 nm (with a high variability from 615 to 631 nm), with two shoulders detected at 615 and 631 nm for LL-acclimated P. cruentum cells. An absorption double peak was detected in the red domain (~ 675 nm) in all species but E. paludosa (Figure 3). This double peak appeared in both photoacclimation conditions and was separated by a dip centered at 675 nm. The first peak (671 nm) was always smaller than the second one (683 nm) (Figure 3). Specific peaks (Figure 3, upward arrows) were: 1) ~ 489 nm
in D.tertiolecta cells, which was smaller in LL-acclimated cells (Figure 3a) and was
also present in HL-acclimated S. platensis cells (Figure 3c) and P. cruentum cells whatever the photoacclimation conditions (Figure 3d); 2) ~ 650 nm in D.tertiolecta cells (Figure 3a) and in HL-acclimated S. platensis cells (Figure 3c); 3) ~ 497 nm in LL-acclimated cells of E. paludosa (Figure 3b); 4) ~ 636 nm in E. paludosa cells (LL and HL) (Figure 3b); 5) ~ 524 nm in S. platensis (Figure 3c) and 6) ~570 nm in P.
cruentum (LL and HL), which was smaller in LL-acclimated cells (Figure 3d).
3.3 Light absorption properties
Average absorption cross-section values through the PAR domain (a*) estimated using the MPBOM varied from 0.007 (E. paludosa) to 0.047 (P. cruentum) m2.mg Chl a-1 in LL-acclimated cells and from 0.024 (E. paludosa) to 0.117 (S. platensis) m2.mg
Chla-1 in HL-acclimated cells (Table 4). In the Chl a red absorption domain, i.e. between 670 and 685 nm, a*red vary from 0.008 (E. paludosa) to 0.063 (S. platensis)
m2.mg Chl a-1 in LL-acclimated cells and from 0.027 (E. paludosa) to 0.106 (S.
platensis) m2.mg Chl a-1 in acclimated cells. Globally, values were greater in
HL-acclimated cells, and a*red values were greater than a* values, expect S. platensis
(Table 4). E. paludosa and P. cruentum showed a similar decrease in cellular Chl a content (-67 %, Table 4) but contrasting results regarding a* and a*red. In E.
paludosa this decrease was accompanied by a 3-fold increase in a* and a*red
(reaching 226 %, Table 4) while in P. cruentum there was no significant changes in
*
a and a*redregardless of the photoacclimation state.
4. Discussion
In many ecophysiological studies dealing with primary production and photosynthetic organisms with different pigment contents and photoacclimation strategies, the determination of the quantity of light absorbed and used to drive photosynthesis is a real challenge to estimate the photosynthetic efficiency, especially for field studies. The method herein described offers a simple way to determine a key factor in photobiology and photosynthetic studies, the optical absorption cross-section, a* [2], by combining HPLC and reflectance data.
4.1 Advantages of using reflectance and second derivative spectra to assess the absorption properties of photosynthetic micro-organisms
In vivo measurement of the absorption properties of photosynthetic micro-organisms
using spectroradiometry on cells settled as a biofilm is an efficient alternative to more classic approaches using spectrophotometry which suffer from light scattering and/or the need forβ-correction [3, 5, 11-13]. Kazemipour et al. [14] showed that pigment reflectance mirrors well its absorbance when measurements are performed on a thin homogenous compact layer of micro-algal cells limiting distance between cells deposited on filters [14], but not thick enough to avoid saturation of reflectance measurements [7]. The biofilms used in the current study fitted these requirements because if there had been any scattering between cells, the model MPBOM would have not fitted the data. Additionally, the biomass was low enough to limit self-shading because in our experimental biofilms this is only observed at biomasses higher than 100 mg.Chl a.m-2 [7].
Since light scattering and inherent reflectance are minimized, the reflectance measured this way corresponds to a double transmittance through the layer of cells. The incident light (i.e. PAR) is depleted by the absorbing fraction during the first transmission, reflected by the background, then transmitted again with a second depletion (see [14] for details). When the background reflectance is removed by standardization, the remaining reflectance signal contains only the cell absorption information.
To date, reflectance or absorbance spectra have been used to identify only a few specific pigment absorption features (e.g. the 650 nm band characteristic of the Chlorophyta or the 636 nm band of the Bacillariophyta). One of the major difficulties of assessing the in vivo pigment absorption properties is the possibility of existing multiple absorption bands for each pigment. Several factors may influence the pigment absorption properties in cells, e.g. the light scattering by the algal cell (or any
particle), the optical properties of each pigment, the spatial arrangement of pigments in LHCs and the spatial arrangement of cells within a sample [3]. All these factors can affect each other. Derivation of reflectance spectra helps to remove unwanted signals and improve the separation of overlapping pigment absorption features [29]. It can thus facilitate the identification of micro-organism absorption bands and their corresponding pigments.
In this study, the HPLC analysis of the 4 species revealed pigment signatures which are in agreement with current literature, for example regarding the clear effect of light observed on pigment ratios ([30] and references therein). Overall, most of the pigments detected by HPLC could be linked to specific derivative peaks. However, when a pigment/Chl a ratio was lower than 0.1, the pigment absorption was not strong enough to generate any derivative peak. This is why, for instance, VX absorption showed no second derivative peaks, although it is well-known to absorb at 510 nm in vivo [31].
4.2 Identification of chlorophyll absorption features
Second derivative reflectance peaks detected in each species and light condition were assigned to specific pigment absorption features on the basis of in vitro absorption bands and by the pigment changes induced by light acclimation (Table 1). The peaks most easily identified were those due to the ubiquitous pigment Chl a. In organic solvents, Chl a absorption bands are commonly detectable at 417, 431, 618 and 665 nm [32] and could be easily linked to the in vivo bands detected in all species at 416, 440, and 625 nm and to the often-observed second derivative double peak in the red domain (671 and 683 nm). This observation is similar to what was
observed by Hoepffner and Sathyendranath [5] using in vivo phytoplankton absorption spectra decomposed by a Gaussian function. These bands correspond to the major absorption bands according to the four-orbital model of Gouterman [33], i.e. the blue absorption bands (B-bands or Soret bands) and the red absorption bands (Q-bands) [2, 34]. The first two bands (416 and 440 nm) correspond to the Soret bands (By and Bx, respectively) whereas the last two bands (625 and around 675 nm)
correspond to the Q-bands (Qx and Qy, respectively). The Qy Chl a is responsible for
all photochemical reactions due to its de-excitation to the ground state [2]. It is also in the Qy transition band that a double peak was always observed at 671 and 683 nm,
except in the diatom E. paludosa. However, this double absorption band was described by Jesus et al [19] in the same species, and by Serôdio et al [35] in natural biofilms. The double Qy absorption peak is rarely mentioned in the literature and its
origin remains unclear. Gulyayev and Litvin [18] were the first to report it at the same wavelengths as in the present study, using a variety of photosynthetic organisms, but they did not explain its origin. The same is true for more recent reports (e.g [2]) that also provided no explanation. To our knowledge, only Serôdio et al. [35] have suggested that the two peaks are the result of Chl a fluorescence emission centered at 683 nm. The chlorophyll fluorescence emitted at this wavelength would affect the radiometric data by increasing the reflectance at this wavelength and decreasing the absorption peak in the second derivative spectra [35]. However, it is possible that fluorescence emission is not the single factor affecting the dip between the two peaks. Another possible explanation for the double peak are absorption variations caused by photosystem (PS) stoichiometry. This is supported by previous observations that variations in PS stoichiometry (PSI and PSII) may cause a shift in the absorption from 674 to 678nm [5, 13]. In fact, because the PSI Chl a core
absorbs at 683 nm and the core of PSII Chl a at 670 nm, a change in the relative amount of the PSI against the PSII is likely to induce this shift [5]. The consequence in second derivative spectra should be the double peak, attributed to the two photosystem cores. The PSI:PSII ratio is often different from 1:1 and varies with species and with environmental light conditions [5, 36-38]. This mechanism is a long-term photoacclimation process that requires hours to days to occur. It allows the excitation energy within the photosynthetic machinery to be regulated by changing the relative amount of the two photosystems [39]. For example, in this study, the Chlorophyta species showed the largest difference between light conditions with the second derivative peak at 671 nm increasing more than the 683 nm in the HL treatment. This supports the hypothesis that HL-acclimated D. tertiolecta cells decreased their PSI:PSII ratio as proposed by Walters et al. [38]. The Rhodophyta and Cyanophyta species showed similar height for the two peaks in both light conditions, which could be explained by a stable PSI:PSII ratio. This might be cause by a parallel decrease in both photosystems when the cells are HL-acclimated as reported previously for Rhodophyta [40]. Although the assessment of PS stoichiometry by radiometry looks very promising further studies are still required to test our hypothesis, using for example, reflectance analyses of cells with controlled amount of PSI and PSII
Three ubiquitous peaks (466, 546 and 586 nm) may also be assigned to Chl a as they are minor absorption bands observed in vitro in organic solvent, with a shift [41]. This assumption is based on the fact that Chl a was the only pigment found in the four species. However, some uncertainty remains in the diatom species since Fuco is known to exhibit a broad absorption band around 550 nm in vivo [42]. Thus, a
pigment mixture including Chl a could also explain the presence of these minor ubiquitous bands.
The other chlorophylls (b and c) also show a Qy band (636 nm for Chl c and 650 nm
for Chl b) without any double peak feature. These Qy absorption bands are in
accordance with previous findings [5, 7, 43]. The other major absorption bands (Soret bands and Qx) were not observed, possibly because of their small height and/or
because of their overlap with other absorption peaks.
4.3 Identification of carotenoid absorption features
Carotenoids are structurally and functionally the most diverse pigment group. They cover part of the ‘green gap’ with absorption bands from 450 to 550 nm [44]. Several carotenoids are involved in photoacclimation and photoregulation processes, e.g. xanthophyll cycles and structural adjustment of the LHCs [39]. Xanthophylls are important in micro-algal photoprotective processes [45], which explains the increase in the xanthophyll:Chl a ratio in the Chlorophyta (VX, AX and ZX pool) and the diatom (DD and DT pool) under HL. This led to a higher absorption in the 489-500 nm region. In the Chlorophyta, the absorption increase at 489 nm was caused by the presence of the xanthophylls ZX and Lut, with absorption bands at 485 nm [39] and 494 nm [9, 30], respectively. The 489 nm peak was also observed in the Cyanophyta and the Rhodophytaspecies, both containing ZX. In the diatom species, the absorbance was centered at 497 nm. This was probably due to the joint absorption of DD and DT at 487 and 508 nm, respectively [10, 16, 46]. The case of the xanthophyll pigments illustrates very well the difficulty in deconvoluting the individual contribution of pigments with very similar reflectance spectrum shapes. Nevertheless, some authors have demonstrated the possibility of obtaining very detailed information from
spectral data. For instance, Jesus et al. [16] observed a shift from 487 to 508 nm associated with the operation of the xanthophyll cycle which corresponds to the HL enzymatic conversion of DD to DT, while Ruban et al. [10] and Lavaud and Lepetit [47] have shown that a thin spectral band around 520 nm is related to the DT molecules which effectively involved in the photoprotective dissipation of excess energy (the so-called NPQ, i.e. the non photochemical fluorescence quenching). In the Cyanophyta species, the absorption features between 450-550 nm showed the largest differences between the two light acclimation treatments. The increase in the 489 nm absorption band from LL to HL was probably caused by the increase in ZX. The specific absorption band at 524 nm increased from LL to HL, which could be caused by increases in either Myx or Osc. However, Myxis the most likely source of this peak because the amount of Osc was 5 times lower than Myx and was probably too low to be retrieved from the spectral data in a reliable way.
4.4 Identification ofphycobiliproteins (PBPs) absorption features
Although PBPs were not quantified in the current study, some absorption bands couldbe linked to this pigment group. The Cyanophytaspecies showed a series of absorption bands from ~585 to ~630 nm,whichcould correspond to the absorption domains of the blue PBPsphycocyanins (610-620 nm) and allophycocyanins (650-655 nm) [48]. Allophycocyanin peaks appeared to show an unexpected increase in HL-acclimated cells of the Cyanophytaspecies, which is not consistent with their known light-harvesting function [49]. However, under high light condition a phosphorylation cascade is induced in cells activating specific polypeptides that degrade PBPs [50], which is accompanied by a Chl a decrease. A greater allophycocyanin/Chl a ratio illustrated by a higher absorption peak at 650 nm
suggests that the decrease of the PSI and PSII (containing Chl a) was faster than the decrease of PBPs, whereas the expected trend is a decrease of the ratio with light [40]. The same unexpected trend was observed with phycocyaninin the Rhodophyta species, where HL-acclimated cells showed higher absorption peaks around 570 nm corresponding to the absorption by phycoerythrin [48].
4.5 Estimation of optical absorption cross-section (a*)
One goal of this study was to demonstrate the possibility of assessing a* from reflectance data using the MPBOM [14] regardless of the taxonomic algal group considered. This parameter is required for the calculation of the absolute photosynthesis quantum yield which is essential to estimate primary productivity from incident PAR. Also, it must be estimated in vivo because a* is highly dependent on cell size and pigment composition as well as on plastid size and number, which drive the pigment-package effects, i.e. self-shading, light scattering, etc. [2]. By settling the micro-algal cells on a filter, the light scattering effects observed in a cell suspension are suppressed and thus allowing to use reflectance to estimate a* in vivo. This approach avoids the use of complex apparatus, as an integrating sphere. Values of
*
a and a*red, estimated by the MPBOM were in accordance with published values,
as well as changes observed with cells grown under LL or HL increase has also been reported before [13]. The efficiency of light absorption in HL-acclimated cells is regulated on a long-term scale (i.e. several days, depending on the growth rate) by a decrease in the number of thylakoids per plastid generating a decrease in the plastid volume and/or by a decrease in the number of plastids per cell (in species with many small plastids), and also by changes in the cellular pigment content. Both processes lead to a decrease in the “package effect” [2]. Often, these phenomena occur
together with a reduction in LHCs size, depending on the light conditions [2]. The diatom species showed the highest a* increase with light, suggesting that this group might be the most efficient to acclimate to changing light conditions, possibly due to its strong potential for the regulation of photosynthesis in fluctuating light conditions [45, 51]. In contrast, the Rhodophyta species showed a stability in a* values instead of the expected increase due to package effect (rearrangement of plastids, thylakoids and LHCs). In spite of the photoacclimation status (i.e. decrease in Chl a cellular content from LL to HL), the cells showed the same absorption cross-section values and these results suggest that there was no rearrangement of plastids, thylakoids and/or LHCs for this taxonomical group. This can be explained by a specific photoacclimation strategy described for P. cruentum [40] whereby Chl a and phycobilisome content per thylakoid area remain relatively constant even though the overall pigment content decreases in HL-acclimated cells.
Another relevant result observed in the Chlorophyta and the Cyanophyta species was the a* increase from LL to HL, which was highest when the average was calculated over the PAR domain in comparison to what was measured in Chl a absorption red domain. Between 670 and 680 nm, it is known that only Chl a absorbs the light energy, whereas in the rest of the PAR spectrum, carotenoids also absorb, including the photoprotective ones [13] as for instance violaxanthin. Thus, the coupled increase in photoprotective pigments in HL photoacclimated cells and the Chl a decrease, could explain the bigger a* values in comparison to the a*redvalues.
Consequentially, the a* increase seems to be not only due to the rearrangement of the package effect, but also to the increase in photoprotective pigments, although they could not participate in the energy transfer to the cores Chl a [13]. Indeed, some of these pigments are only involved in the xanthophyll cycle, as AX, ZX and DT.
It should also be noted that a*red did not shown significant difference between LL and
HL conditions in the Chlorophyta species in contrast to a*. This implies that the a*
increase was only caused by the carotenoid increase and in this case the package effect affected only a*red, reducing its decrease in spite of the cellular Chl a content.
This result was in accordance with those found by Johnsen and Sakshaug [13] that observed that Chlorophyta are also the species with the lowest absorption-cross section coefficients.
5. Conclusion and future prospects
The non-invasive radiometric methodology proposed in this study was shown to be a good alternative to the already existing techniques for the assessment of the pigment absorption properties of photosynthetic micro-organisms. Namely, in vivo pigment absorption bands could be identified from second derivative reflectance spectra in a reliable way. More importantly, by coupling this approach to the MPBOM model, we demonstrated the feasibility of measuring the absorption cross-section (a*) of photosynthetic microorganisms in vivo, which is a key parameter for the estimation of the absolute photosynthetic efficiency and the primary productivity. In agreement with previous works, the pattern of variation of a* observed in this study suggests that these photosynthetic microorganisms display a high plasticity in response to light changes, and that the differences in responses between taxonomic groups are large [52]. Last but not least, this non-invasive methodology will facilitate the investigation of pigment absorption properties of microphytobenthos biofilms in vivo and in situ. An example of an original application could be the mapping of microphytobenthos light absorption efficiency using remote sensing imagery. This would strongly help assessing coastal primary production at the habitat/ecosystem scale, such as intertidal mudflats.
6. References
[1] J.C. Kromkamp, R.M. Forster, Development in microphytobenthos primary productivity studies, in: J.C. Kromkamp, J.F.C. de brouwer, G.F. Blanchard, R.M. Forster, V. Creach (Eds.) Functioning of microphytobenthos in estuaries, Edita, 2006, pp. 9-30.
[2] P.G. Falkowski, J.A. Raven, Aquatic Photosynthesis - Second Edition, Princeton University Press, Princeton, 2007.
[3] G. Johnsen, A. Bricaud, N. Nelson, B. Prézelin, R. Bidigare, In vivo bio-optical properties of phytoplankton pigments, in: S. Roy, C. Llewellyn, E.S. Egeland, G. Johnsen (Eds.)
Phytoplankton Pigments - Characterization, Chemotaxonomy and Applications in Oceanography, Cambridge University Press, Cambridge, 2011, pp. 496-537.
[4] R.R. Bidigare, M.E. Ondrusek, J.H. Morrow, D.A. Kiefer, In vivo absorption properties of algal pigments, SPIE Ocean Optics Proceedings: Ocean Optics X, 1302 (1990) 290-302. [5] N. Hoepffner, S. Sathyendranath, Effect of Pigment Composition on Absorption Properties of Phytoplankton, Marine Ecology-Progress Series, 73 (1991) 11-23.
[6] J. Barrett, J.M. Anderson, The P700-chlorophyll a-protein complex and two major light-harvesting complexes of Acrocarpia paniculata and other brown seaweeds, Biochim. Biophys. Acta, 590 (1980) 309-323.
[7] V. Méléder, L. Barillé, P. Launeau, V. Carrere, Y. Rincé, Spectrometric constraint in analysis of benthic diatom biomass using monospecific cultures, Remote Sensing of Environment, 88 (2003) 386-400.
[8] R.J. Porra, E.E. Pfündel, N. Engel, Metabolism and function of photosynthetic pigments, in: S.W. Jeffrey, R.F.C. Mantoura, S.W. Wright (Eds.) Phytoplankton pigments in
oceanography. Monographs on oceanographic methodology, UNESCO publishing, Paris, 1997, pp. 85-126.
[9] A. Ruban, A. Pascal, B. Robert, Xanthophylls of the major photosynthetic light-harvesting complex of plants: identification, conformation and dynamics., FEBS letters
FEBS Lett, 477 (2000) 181-185.
[10] A.V. Ruban, J. Lavaud, B. Rousseau, G. Guglielmi, P. Horton, A.L. Etienne, The super-excess energy dissipation in diatom algae: comparative analysis with higher plants,
Photosynthesis Research, 82 (2004) 165-175.
[11] A. Bricaud, A. Morel, L. Prieur, Optical efficiency factors of some phytoplankters, Limnol. Oceanogr., 28 (1983) 816-832.
[12] B.G. Mitchell, D.A. Kiefer, Chlorophyll a specific absorption and fluorescence excitation spectra for light-limited phytoplankton., Deep-Sea Research, 35 (1988) 639-663.
[13] G. Johnsen, E. Sakshaug, Biooptical characteristics of PSII and PSI in 33 species (13 pigment groups) of marine phytoplankton, and the relevance for pulse-amplitude-modulated and fast-repetition-rate fluorometry1, Journal of Phycology, 43 (2007) 1236-1251.
[14] F. Kazemipour, V. Méléder, P. Launeau, Optical properties of microphytobenthic biofilms (MPBOM): Biomass retrieval implication, Journal of Quantitative Spectroscopy and Radiative Transfer, 112 (2011) 131-142.
[15] G. Johnsen, M. Moline, L. Pettersson, J. Pinckney, D. Pozdnyakov, E.S. Egeland, O. Schofield, Optical monitoring of phytoplankton bloom pigment signautres, in: S. Roy, C. Llewellyn, E.S. Egeland, G. Johnsen (Eds.) Phytoplankton Pigments: Characterization, Chemotaxonomy and Applications in Oceanography, Cambridge University Press, Cambridge, 2011, pp. 538-581.
[16] B. Jesus, J.L. Mouget, R.G. Perkins, Detection of diatom xanthophyll cycle using spectral reflectance, Journal of Phycology, 44 (2008) 1349-1359.
[17] L.L. Richardson, D. Buisson, C.J. Liu, V. Ambrosia, The detection of algal
photosynthetic accessory pigments using Airborne Visible-Infrared Imaging Spectrometer (AVIRIS) Spectral Data, MTS Journal, 28 (1994) 10-21.
[18] B.A. Gulyayev, F.F. Litvin, First and second derivatives of the absorption spectrum of chlorophyll and associated pigments in cells of higher plants and algae at 20°C, Biophysics, 15 (1970) 670-680.
[19] B. Jesus, P. Rosa, J.L. Mouget, V. Méléder, P. Launeau, L. Barillé, Spectral-radiometric analysis of taxonomically mixed microphytobenthic biofilms, Remote Sens Environ, accepted (2013).
[20] R.J. Murphy, T.J. Tolhurst, M.G. Chapman, A.J. Underwood, Estimation of surface chl a on an emersed mudflat using field spectrometry: accuracy of ratios and derivtive-based approaches, International Journal of Remote Sensing, 26 (2005) 1835-1859.
[21] R.J. Murphy, A.J. Underwood, M. Pinkerton, P. Range, Field spectrometry: New
methods to investigate epilithic micro-algae on rocky shores., Journal of Experimental Marine Biology and Ecology, 325 (2005) 111–124.
[22] R.R.L. Guillard, Culture of phytoplankton for feeding marine invertebrates, in: W.L. Smith, M.H. Chanly (Eds.) Culture of marine invertebrate animals, Plenum Press, New York, 1982, pp. 108-132.
[23] C. Zarrouk, Contribution à l´étude d´une cyanophycée: influence de divers facteurs physiques et chimiques sur la croissance et la photosynthèse de Spirulina maxima (Setch. et Gardner) Geitler., in, Paris, Paris, 1966.
[24] R.F.C. Mantoura, C.A. Llewellyn, The rapid determination of algal chlorophyll and carotenoid pigments and their breakdown products in natural waters by reverse-phase high-performance liquid chromatography, Anal Chim Acta, 151 (1983) 297-314.
[25] V. Brotas, M.-R. Plante-Cuny, The use of HPLC pigment analysis to study microphytobenthos communities, Acta Oecol, 24 (2003) S109-S115.
[26] S.W. Jeffrey, Application of pigment method to oceanography, in: S.W. Jeffrey, R.F.C. Mantoura, S.W. Wright (Eds.) Phytoplankton pigments in oceanography. Monographs on oceanographic methodology, UNESCO publishing, Paris, 1997, pp. 127-166.
[27] V. Brotas, M.R. Plante-Cuny, Identification et quantification des pigments
chlorophylliens et caroténoïdes des sédiments marins : un protocole d'analyse par HPLC, Oceanol Acta, 19 (1996) 623-634.
[28] R. Ihaka, R. Gentleman, R: a language for data analysis and graphics., Journal of Computational and Graphical Statistics, 5 (1996) 229-314.
[29]T.H. Demetriades-Shah, M.D. Steven, J.A. Clark, High resolution derivative spectra in remote sensing, Remote Sensing of Environment, 33 (1990) 55-64.
[30] M. Laviale, J. Neveux, Relationships between pigment ratios and growth irradiance in 11 marine phytoplankton species, Marine Ecology Progress Series, 425 (2011) 63-77.
[31] H. van Amerongen, J.P. Dekker, Light-Harvesting in Photosystem II, in: B.R. Green, W.W. Parson (Eds.) Light-Harvesting Antennas in Photosynthesis, Kluwer Academic Publishers, Dordrecht, 2003, pp. 219-251.
[32] S. Roy, C. Llewellyn, E.S. Egeland, G. Johnsen, Phytoplankton Pigments -
Characterization, Chemotaxonomy and Applications in Oceanography, Cambridge University Press, Cambridge, 2011.
[33] M. Gouterman, Spectra of porphyrins, Journal of Molecular Spectroscopy, 6 (1961) 138-163.
[34] W.W. Parson, V. Nagarajan, Optical Spectroscopy in Photosynthetic Antennas, in: B.R. Green, W.W. Parson (Eds.) Light-Harvesting Antennas in Photosynthesis, Kluwer Academic Publishers, Dordrecht, 2003, pp. 83-127.
[35] J. Serôdio, P. Cartaxana, H. Coelho, S. Vieira, Effects of chlorophyll fluorescence on the estimation of microphytobenthos biomass using spectral reflectance indices, Remote Sensing of Environment, 113 (2009) 1760-1768.
[36] Y. Fujita, Chromatic Variation of the Abundance of PSII Complexes Observed with the Red Alga Prophyridium cruentum
10.1093/pcp/pce164 Plant and Cell Physiology, 42 (2001 ) 1239-1244
[37] B. Smith, P. Morrissey, J. Guenther, J. Nemson, M. Harrison, J. Allen, A. Melis, Response of the Photosynthetic Apparatus in Dunaliella salina (Green Algae) to Irradiance Stress., Plant Physiology, 93 (1990) 1433-1440.
[38] R.G. Walters, Towards an understanding of photosynthetic acclimation, Journal of Experimental Botany, 56 (2005) 435-447.
[39] L. Dietzel, K. Brautigam, T. Pfannschmidt, Photosynthetic acclimation: State transitions and adjustment of photosystem stoichiometry as functional relationships between short-term and long-term light quality acclimation in plants, FEBS Journal, 275 (2008) 1080-1088. [40] E. Gantt, B. Grabowski, F.X. Cunningham, Antenna Systems of Red Algae:
Phycobilisomes with Photosystem II and Chlorophyll Complexes with Photosystem I, in: B.R. Green, W.W. Parson (Eds.) Light-Harvesting Antennas in Photosynthesis, Kluwer Academic Publishers, Dordrecht, 2003, pp. 307-322.
[41] S.W. Jeffrey, R.F.C. Mantoura, T. Bjørnland, Data for the identification of 47 key phytoplankton pigments, in: S.W. Jeffrey, R.F.C. Mantoura, S.W. Wright (Eds.)
Phytoplankton pigments in oceanography. Monographs on oceanographic methodology, UNESCO publishing, Paris, 1997, pp. 449-559.
[42] T.W. Goodwin, Carotenoids in higher plants, in: T.W. Goodwin (Ed.) The biochemistry of the Carotenoids, Chapman & Hall, London, 1980, pp. 143-203.
[43] F. Kazemipour, P. Launeau, V. Méléder, Microphytobenthos biomass mapping using the optical model of diatom biofilms: Application to hyperspectral images of Bourgneuf Bay, Remote Sensing of Environment, 127 (2012) 1-13.
[44] H. Scheer, The Pigments, in: B.R. Green, W.W. Parson (Eds.) Light-Harvesting Antennas in Photosynthesis, Kluwer Academic Publishers, Dordrecht, 2003, pp. 29-81. [45] C. Brunet, G. Johnsen, J. Lavaud, S. Roy, Pigments and photoacclimation processes, in: S. Roy, C. Llewellyn, E.S. Egeland, G. Johnsen (Eds.) Phytoplankton Pigments -
Characterization, Chemotaxonomy and Applications in Oceanography, Cambridge University Press, Cambridge, 2011, pp. 445-471.
[46] M. Olaizola, H. Yamamoto, Short-term response of the diadinoxanthin cycle and fluorescence yield to high irradance in diatoms (Bacillariophyceue). J. Phycol., 30 (1994) 606-612.
[47] J. Lavaud, B. Lepetit, An explanation for the inter-species variability of the photoprotective non-photochemical chlorophyll fluorescence quenching in diatoms, Biochimica et Biophysica Acta (BBA) - Bioenergetics, 1827 (2013) 294-302.
[48] R. Bermejo Roman, J.M. Alvarez-Pez, F.G. Acién Fernandez, E. Molina Grima, Recovery of pure B-phycoerythrin from the microalga Porphyridium cruentum, Journal of Biotechnology, 93 (2002) 73-85.
[49] K.-H. Zhao, R.J. Porra, H. Scheer, Phycobiliproteins, in: S. Roy, C. Llewellyn, E.S. Egeland, G. Johnsen (Eds.) Phytoplankton Pigments - Characterization, Chemotaxonomy and Applications in Oceanography, Cambridge University Press, Cambridge, 2011, pp. 375-411. [50] A.R. Grossman, L.G. van Waasbergen, D. Kehoe, Regulation of Light Harvesting in Cyanobacteria, in: B.R. Green, W.W. Parson (Eds.) Light-Harvesting Antennas in Photosynthesis, Kluwer Academic Publishers, Dordrecht, 2003, pp. 471-493.
[51] J. Lavaud, Fast regulation of photosynthesis in diatoms : Evolution, regulation and ecophysiology, Functional Plant Science and Biotechnology, 1 (2007) 267-387.
[52] R. Perkins, J. Kromkamp, J. Serodio, J. Lavaud, B. Jesus, J.L. Mouget, S. Lefebvre, R.M. Forster, The application of variable chlorophyll fluorescence to microphytobenthic biofilms, in: D. Sugget, M. Borowitzka, O. Parsil (Eds.) Chlorophyll a fluorescence in Aquatic Sciences: Methods and Applications, Springer, 2010, pp. 237-276.
Figure legends
Figure 1. Pigment concentration expressed in mg.m-2 in the four species acclimated at the two light (PAR) intensities, LL (black) and HL (gray). For each pigment (mean ± 95 % CI; n = 3), horizontal bar indicates no significant differences between HL and LL conditions (t test p ≥ 0.05).
Figure 2. Spectra of standardized reflectance (ρ925) measured for the four species
acclimated at the two light (PAR) intensities, LL (black) and HL (gray). Arrows indicate absorption bands notching the transmittance peak of the ‘green gap’.
Figure 3. Spectra of second derivative (δδ) calculated for the four species acclimated at the two light (PAR) intensities, LL (black) and HL (gray). Downward arrows indicate ubiquitous absorption peaks while upward arrows indicate specific peaks.
Pigment concentration on filters (mg.
m
−− 2)
Chl a Lut Chl b ZX VX NX ββ −car AX 0 1 2 3 4 5 6 Dunaliella tertiolecta Chl a Fuco Chl c DD DT ββ −car 0 5 10 15 20 25 Entomoneis paludosaChl a ZX Myx ββ −car Osc VX
0 1 2 3 4 Spirulina platensis Chl a ZX ββ −car 0 1 2 3 4 Porphyridium cruentum Figure 1
Standardized reflectance
400 500 600 700 800 0.0 0.2 0.4 0.6 0.8 1.0 400 500 600 700 800 0.0 0.2 0.4 0.6 0.8 1.0 400 500 600 700 800 0.0 0.2 0.4 0.6 0.8 1.0 400 500 600 700 800 0.0 0.2 0.4 0.6 0.8 1.0 400 500 600 700 800 0.0 0.2 0.4 0.6 0.8 1.0 400 500 600 700 800 0.0 0.2 0.4 0.6 0.8 1.0 400 500 600 700 800 0.0 0.2 0.4 0.6 0.8 1.0 400 500 600 700 800 0.0 0.2 0.4 0.6 0.8 1.0 400 500 600 700 800 0.0 0.2 0.4 0.6 0.8 1.0 400 500 600 700 800 0.0 0.2 0.4 0.6 0.8 1.0 400 500 600 700 800 0.0 0.2 0.4 0.6 0.8 1.0 400 500 600 700 800 0.0 0.2 0.4 0.6 0.8 1.0 Dunaliella tertiolecta 400 500 600 700 800 0.0 0.2 0.4 0.6 0.8 1.0 400 500 600 700 800 0.0 0.2 0.4 0.6 0.8 1.0 400 500 600 700 800 0.0 0.2 0.4 0.6 0.8 1.0 400 500 600 700 800 0.0 0.2 0.4 0.6 0.8 1.0 400 500 600 700 800 0.0 0.2 0.4 0.6 0.8 1.0 400 500 600 700 800 0.0 0.2 0.4 0.6 0.8 1.0 400 500 600 700 800 0.0 0.2 0.4 0.6 0.8 1.0 400 500 600 700 800 0.0 0.2 0.4 0.6 0.8 1.0 400 500 600 700 800 0.0 0.2 0.4 0.6 0.8 1.0 400 500 600 700 800 0.0 0.2 0.4 0.6 0.8 1.0 400 500 600 700 800 0.0 0.2 0.4 0.6 0.8 1.0 400 500 600 700 800 0.0 0.2 0.4 0.6 0.8 1.0 Entomoneis paludosa 0.0 0.2 0.4 0.6 0.8 1.0 0.0 0.2 0.4 0.6 0.8 1.0 0.0 0.2 0.4 0.6 0.8 1.0 0.0 0.2 0.4 0.6 0.8 1.0 0.0 0.2 0.4 0.6 0.8 1.0 0.0 0.2 0.4 0.6 0.8 1.0 0.0 0.2 0.4 0.6 0.8 1.0 0.0 0.2 0.4 0.6 0.8 1.0 0.0 0.2 0.4 0.6 0.8 1.0 0.0 0.2 0.4 0.6 0.8 1.0 0.0 0.2 0.4 0.6 0.8 1.0 0.0 0.2 0.4 0.6 0.8 1.0 Spirulina platensis 0.0 0.2 0.4 0.6 0.8 1.0 0.0 0.2 0.4 0.6 0.8 1.0 0.0 0.2 0.4 0.6 0.8 1.0 0.0 0.2 0.4 0.6 0.8 1.0 0.0 0.2 0.4 0.6 0.8 1.0 0.0 0.2 0.4 0.6 0.8 1.0 0.0 0.2 0.4 0.6 0.8 1.0 0.0 0.2 0.4 0.6 0.8 1.0 0.0 0.2 0.4 0.6 0.8 1.0 0.0 0.2 0.4 0.6 0.8 1.0 0.0 0.2 0.4 0.6 0.8 1.0 0.0 0.2 0.4 0.6 0.8 1.0 Porphyridium cruentum Figure 2Standardized Second Derivative
400 500 600 700 800 −0.5 0.0 0.5 1.0 400 500 600 700 800 −0.5 0.0 0.5 1.0 400 500 600 700 800 −0.5 0.0 0.5 1.0 400 500 600 700 800 −0.5 0.0 0.5 1.0 400 500 600 700 800 −0.5 0.0 0.5 1.0 400 500 600 700 800 −0.5 0.0 0.5 1.0 400 500 600 700 800 −0.5 0.0 0.5 1.0 400 500 600 700 800 −0.5 0.0 0.5 1.0 400 500 600 700 800 −0.5 0.0 0.5 1.0 400 500 600 700 800 −0.5 0.0 0.5 1.0 400 500 600 700 800 −0.5 0.0 0.5 1.0 400 500 600 700 800 −0.5 0.0 0.5 1.0 Dunaliella tertiolecta 416 440 462 546 586 615−631 671 683 489 650 400 500 600 700 800 −0.5 0.0 0.5 1.0 400 500 600 700 800 −0.5 0.0 0.5 1.0 400 500 600 700 800 −0.5 0.0 0.5 1.0 400 500 600 700 800 −0.5 0.0 0.5 1.0 400 500 600 700 800 −0.5 0.0 0.5 1.0 400 500 600 700 800 −0.5 0.0 0.5 1.0 400 500 600 700 800 −0.5 0.0 0.5 1.0 400 500 600 700 800 −0.5 0.0 0.5 1.0 400 500 600 700 800 −0.5 0.0 0.5 1.0 400 500 600 700 800 −0.5 0.0 0.5 1.0 400 500 600 700 800 −0.5 0.0 0.5 1.0 400 500 600 700 800 −0.5 0.0 0.5 1.0 Entomoneis paludosa 497 636 400 500 600 700 800 −0.5 0.0 0.5 1.0 400 500 600 700 800 −0.5 0.0 0.5 1.0 400 500 600 700 800 −0.5 0.0 0.5 1.0 400 500 600 700 800 −0.5 0.0 0.5 1.0 400 500 600 700 800 −0.5 0.0 0.5 1.0 400 500 600 700 800 −0.5 0.0 0.5 1.0 400 500 600 700 800 −0.5 0.0 0.5 1.0 400 500 600 700 800 −0.5 0.0 0.5 1.0 400 500 600 700 800 −0.5 0.0 0.5 1.0 400 500 600 700 800 −0.5 0.0 0.5 1.0 400 500 600 700 800 −0.5 0.0 0.5 1.0 400 500 600 700 800 −0.5 0.0 0.5 1.0 Spirulina platensis 489 524 650 400 500 600 700 800 −0.5 0.0 0.5 1.0 1.5 400 500 600 700 800 −0.5 0.0 0.5 1.0 1.5 400 500 600 700 800 −0.5 0.0 0.5 1.0 1.5 400 500 600 700 800 −0.5 0.0 0.5 1.0 1.5 400 500 600 700 800 −0.5 0.0 0.5 1.0 1.5 400 500 600 700 800 −0.5 0.0 0.5 1.0 1.5 400 500 600 700 800 −0.5 0.0 0.5 1.0 1.5 400 500 600 700 800 −0.5 0.0 0.5 1.0 1.5 400 500 600 700 800 −0.5 0.0 0.5 1.0 1.5 400 500 600 700 800 −0.5 0.0 0.5 1.0 1.5 400 500 600 700 800 −0.5 0.0 0.5 1.0 1.5 400 500 600 700 800 −0.5 0.0 0.5 1.0 1.5 Porphyridium cruentum 489 570 Figure 3
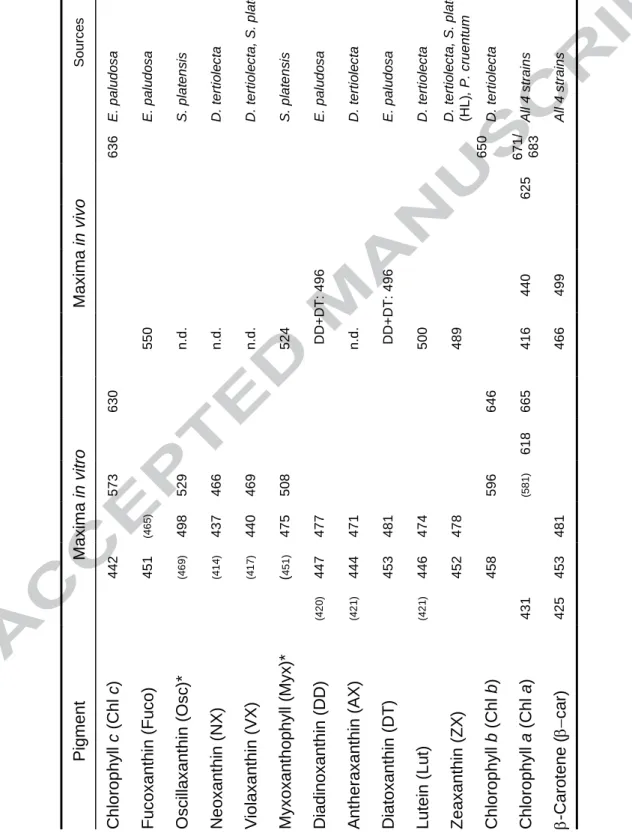
Table 1. Absorbance maxima for all pigments detected in the four strains analyzed by
HPLC (in vitro) and by radiometry (in vivo). Pigments are ordered following their
HPLC elution time from the earliest to the latest. n.d.: in vivo absorbances not
detected by radiometry. References for in vitro absorbances: Jeffrey et al. [26],
except (*) in Brotas and Plante-Cuny, [25]. In vivo absorbance are from this study.
So u rc e s E. p a lu d o s a E. p a lu d o s a S. p la te n s is D. te rti o le c ta D. te rti o le c ta , S. p la te n s is S. p la te n s is E. p a lu d o s a D. te rti o le c ta E. p a lu d o s a D. te rti o le c ta D. te rti o le c ta , S. p la te n s is (HL) , P. c ru e n tu m D. te rti o le c ta Al l 4 s tra in s Al l 4 s tra in s M axi m a i n vivo 636 650 671/ 683 625 DD +DT : 4 9 6 DD +DT : 4 96 440 499 550 n.d . n .d . n .d . 524 n.d . 500 489 416 466 M axi m a i n vit ro 630 646 665 618 573 529 466 469 508 596 (58 1 ) (4 6 5 ) 498 437 440 475 477 471 481 474 478 481 442 451 (46 9 ) (4 1 4 ) (4 1 7 ) ( 4 5 1 ) 447 444 453 446 452 458 453 (4 2 0 ) (4 2 1 ) (4 2 1 ) 431 425 P igment C hl orophyl l c (C hl c ) Fu coxa nthi n (Fu co) O sci llaxa nthi n ( O sc )* N eo xan thi n ( N X ) V iol axa nthi n ( V X ) M yxoxa n tho ph yl l (M yx )* D iad ino xan thi n ( D D ) A nt h eraxan thi n ( A X ) D iatoxanthi n (D T ) Lu tei n ( Lu t) Ze axa nthi n ( ZX ) C hl orophyl l b (C hl b ) C hl orophyl l a (C hl a ) -C aro ten e ( car ) Table(s)
Table 2. Cellular content of Chl a in the four studied species photoacclimated at the
two PAR intensities, HL and LL. For each value (mean ± 95 % CI; n = 3), differences
between LL and HL are significant (t test p ≤ 0.05).
Strain
Light
acclimation
Cellular content of
Chl a (µg.10
-6cell)
Amount of cells on
filters
D. tertiolecta
LL
4.37 ± 1.08
2.4 10
6± 2.0 10
5HL
1.02 ± 0.15
5.5 10
6± 2.7 10
5E. paludosa
LL
11.45 ± 0.76
2.9 10
6± 1.5 10
5HL
3.78 ± 0.62
2.3 10
6± 2.2 10
5S. platensis
LL
0.69 ± 0.26
1.0 10
7± 3.1 10
5HL
0.09 ± 0.01
1.2 10
7± 3.5 10
5P. cruentum
LL
0.65 ± 0.13
4.0 10
6± 3.2 10
5HL
0.21 ± 0.01
1.3 10
7± 1.1 10
6Table 3. Pigment content expressed in ratio against Chl a in the
four studied species photoacclimated at the two PAR intensities,
HL and LL. For each ratio (mean ± 95 % CI; n = 3), differences
between LL and HL are significant (t test p ≤ 0.05), except (n.s.).
Ratio
± stdD. tertiolecta LL
D. tertiolecta HL
Lut / Chl a
0.27
± 0.010.57
± 0.05Chl b / Chl a
0.13
± 0.03n.d.
ZX / Chl a
0.11
± 0.0050.17
± 0.005VX / Chl a
0.07
± 0.0030.02
± 0.003NX / Chl a
0.03
± 0.0010.05
± 0.003
car / Chl a
0.08
n.d.
AX / Chl a
0.02
± 0.0030.06
± 0.003E. paludosa LL
E. paludosa HL
Fuco / Chl a
(n.s.)0.61
± 0.030.69
± 0.07Chl c / Chl a
(n.s.)0.11
± 0.0070.11
± 0.01DD / Chl a
0.03
± 0.0020.12
± 0.01DT / Chl a
0.01
± 0.0020.14
± 0.02
car / Chl a
0.02
± 0.008n.d.
S. platensis LL
S. platensis HL
ZX / Chl a
0.57
± 0.021.46
± 0.15Myx / Chl a
0.34
± 0.020.88
± 0.08
car / Chl a
0.16
± 0.04n.d.
Osc / Chl a
0.06
± 0.010.16
± 0.04VX / Chl a
n.d.
0.09
± 0.04P. cruentum LL
P. cruentum HL
ZX / Chl a
0.37
± 0.130.63
± 0.1
car / Chl a
0.03
0.07
± 0.02Table 4. Absorption cross-section estimated from MPBOM for the four studied
strains photoacclimated at the two PAR intensities, HL and LL.
a *
: absorption
cross-section in m
2.mg Chl a
-1, averaged on the PAR domain ± 95 % CI; a *
red:
absorption cross-section in m
2.mg Chl a
-1, averaged between 670 and 685 nm;
,
a*redand
Chl a: variation from LL to HL conditions in cells. For each
strain, differences between LL and HL are significant (t test p ≤ 0.05), except n.s
(
and
a*redwere minimized to zero).
Strain
Light
acclimation
a *
(m
2.mg
Chl a
-1)
a*
red(m
2.mg
Chl a
-1)
a*
red
Chl a
D. tertiolecta
LL
0.017 ±
0.003
0.023 ±
0.004
57 %
0 %
n.s
-71 %
HL
0.027 ±
0.003
0.030 ±
0.004
E. paludosa
LL
0.007 ±
0.000
0.008 ±
0.000
226 % 225 %
-67 %
HL
0.024 ±
0.005
0.027 ±
0.005
S. platensis
LL
0.054 ±
0.002
0.063 ±
0.002
117 % 68 %
-88 %
HL
0.117 ±
0.021
0.106 ±
0.017
P. cruentum
LL
0.047 ±
0.013
0.040 ±
0.011
0 %
(n.s.)
0 %
(n.s.)
-67 %
HL
0.035 ±
0.002
0.027 ±
0.001
Highlights :
• In vivo estimation of the pigment absorption bands and the optical absorption
cross-section, a*
• Four photosynthetic micro-organisms cultivated at two PAR levels were analyzed
• A new methodology was proposed: spectroradiometry measuring reflectances.
• Some absorption bands were ubiquous, others were taxonomically specific and/or photo-physiological dependent.
• A double peak feature at 671 and 683 nm, supposed to be caused by PSII and PSI, was detected