Publisher’s version / Version de l'éditeur:
Journal of the Acoustical Society of America, 74, 2, pp. 534-542, 1983-08
READ THESE TERMS AND CONDITIONS CAREFULLY BEFORE USING THIS WEBSITE. https://nrc-publications.canada.ca/eng/copyright
Vous avez des questions? Nous pouvons vous aider. Pour communiquer directement avec un auteur, consultez la première page de la revue dans laquelle son article a été publié afin de trouver ses coordonnées. Si vous n’arrivez pas à les repérer, communiquez avec nous à PublicationsArchive-ArchivesPublications@nrc-cnrc.gc.ca.
Questions? Contact the NRC Publications Archive team at
PublicationsArchive-ArchivesPublications@nrc-cnrc.gc.ca. If you wish to email the authors directly, please see the first page of the publication for their contact information.
NRC Publications Archive
Archives des publications du CNRC
This publication could be one of several versions: author’s original, accepted manuscript or the publisher’s version. / La version de cette publication peut être l’une des suivantes : la version prépublication de l’auteur, la version acceptée du manuscrit ou la version de l’éditeur.
Access and use of this website and the material on it are subject to the Terms and Conditions set forth at
Sound transmission through windows. II. Double and triple glazing
Quirt, J. D.
https://publications-cnrc.canada.ca/fra/droits
L’accès à ce site Web et l’utilisation de son contenu sont assujettis aux conditions présentées dans le site LISEZ CES CONDITIONS ATTENTIVEMENT AVANT D’UTILISER CE SITE WEB.
NRC Publications Record / Notice d'Archives des publications de CNRC:
https://nrc-publications.canada.ca/eng/view/object/?id=b053356c-2d07-4afd-ab71-2a7fdb120ca4 https://publications-cnrc.canada.ca/fra/voir/objet/?id=b053356c-2d07-4afd-ab71-2a7fdb120ca4Ser
TH1
N21d
National Research
Conseil national
:133
Council Canada
de recherches Canada
BLDG
SOUND TRANSMISSION THROUGH WINDOWS II. DOUBLE AND TRIPLE GLAZING
by J.D. Quirt
Reprinted from
Journal of the Acoustical Society of America Volume 74, No. 2, August 1983
DBR Paper No. 1 133
Division of Building Research
Price $1.00 OTTAWA
1
L I B R A R Y
Des donn'ees exp'erimentales concernant l'att'enuatiori d e s s o n s p a r l e s f e n e t r e s 3 double v i t r a g e o n t Bt6 compar'ees aux p r ' e d i c t i o n s d e p l u s i e u r s modeles th'eoriques. On a trouvg d e s e q u a t i o n s s i m p l e s q u i p e r m e t t e n t un a j u s t a g e empirique s a t i s f a i s a n t aux donniks. L'att'enuation d e s s o n s p a r un v i t r a g e double a Ct'e compar'ee Zi 1 ' a t t'enuat i o n correspondante pour un v i t r a g e t r i p l e ; l e s r C s u l t a t s s o n t semblables l o r s q u e l e t o t a l d e s e s p a c e s e n t r e l e s panneaux d'une f e n g t r e t r i p l e e s t 6 g a l 3 l ' e s p a c e e n t r e l e s panneaux d'une f e n e t r e double. Cependant, 1 1 a t t 5 n u a t i o n r h l i s ' e e p a r un v i t r a g e t r i p l e e s t t o u j o u r s sup'erieure aux f r h u e n c e s e n d e ~ a de l a resonance m a s s e - a i r m a s s e e t au v o i s i n a g e de l a d e p r e s s i o n de l a frequence de corncidence.
Sound transmission througn windows 11. Double ana triple glazing
rg Researci J. D. Quirt
Noise and Vibra n, Division of Buildifi h, National Research Ontario KIA OR 6, Canada
Council oj f Canada, 1 Ottawa, (Received 20 S : 1982; accepted for publication 7 April 1983)
Experimental avuuu ~~ansmission loss data for double-glazed windows have been ~ ~ ~ ~ ~ p a r e d with
the predictions of several theoretical models. Simple equations that provide a satisfactory empirical fit to the data were found. The transmission loss of double glazing was compared with that of triple glazing; the results are very similar when the combined interpane spacings of the triple window match the spacing of the double glazing. The triple glazing did, however, exhibit consistently higher transmission loss both at frequencies below the mass-air-mass resonance and in the vicinity of the coincidence dip.
PACS numbers: 43.55.Ti, 43.50.Jh, 43.55.Rg
A series of measurements of the sound transmission loss (TL) of single-, double-, and triple-glazed windows has been performed to examine the dependence of TE on glass thick- ness and interpane spacing. General features of the measure- ments and data were presented in a previous paper,' which concentrated primarily on trends in the data for single- and double-glazed windows. The present paper discusses the performance of double glazing more extensively, in the light of recent theoretical treatments, and compares the TL of double- and triple-glazed windows.
As noted previously,' the results of different studies of sound transmission through windows are not in close agree- ment. The discrepancies among the results are apparently due to the properties of both the samples themselves and the laboratories in which they were tested. Rather than dwell on these sources of systematic error (many of which were dis- cussed in Ref. 1) or try to account for differences between the data from the present study and those published previously,2 this paper concentrates on trends within the present data set. As many variables as possible (such as window dimensions, glass mounting, and laboratory-related details) were held as constant as was practicable. This permitted considerable confidence in comparisons of TL data for the windows test- ed. Although the specific characteristics of the testing labo- ratory and the specimens undoubtedly influenced some de- tails of the TL data, the trends exhibited by the data are believed to be of a general nature.
This paper presents the results for double- and triple- glazed windows using data selected to illustrate trends in the sound transmission performance.
I. EXPERIMENTAL DETAILS
All the sound transmission measurements were made in accordance with ASTM standard E90-75, "Laboratory Measurement of Airborne Sound Transmission Loss of Building partition^."^ Measurements were made for the standard 1/3-octave bands from 80 to 5000 Hz; however, the data for the 80- and 100-Hz bands should be treated with caution because the test facility does not satisfy room dimen- sion requirements for these bands.
Detailed features of the reverberant test chambers, the equipment used and the test frame in which the specimens were mounted are given in Ref. 1.
The test specimen consisted of three nominally identi- cal windows mounted in wooden sashes. The exposed glass area of each was 5 6 0 ~ 1680 mm and the sash dimensions were 620X 1750x41 mm. The data reported here are for double and triple glazing mounted in single or double sashes, with nominal glass thicknesses of 3,4, and 6 mm; the actual masses per unit area were 8.1 kg/m2 (26 oz/ft2), 10.4 kg/m2 (34 oz/ft2) and 14.4 kg/m2 (47 oz/ft2), respectively.
The window construction details are presented schema- tically in Fig. 1. Double glazing was tested with two panes mounted in a single sash (for interpane spacings up to 19 mm) and with each pane mounted in a separate sash (for spacings of 19 mrn or greater). Triple glazing was tested with three panes mounted in a single sash (for combined spacings up to 19 mm) or with two panes (at 6-mm separation) mount- ed in one sash and the third pane in a separate sash. The sashes fitted snugly into the frame openings and were held
D O U B L E D O U B L E T R l P L E T R 1 P L E G L A Z I N G G L A Z l N G G L A Z I N G G L A Z I N G ( S I N G L E ( D O U B L E ( S I N G L E ( D O U B L E S A S H ) S A S H ) S A S H ) S A S H )
FIG. 1. Schematic representation of window mounting details. Caulked seals are indicated by circles and taped seals by arrows.
cracks tape ( j equiva :ter were cracks pr he glass m
tlrmly In posltlon by wooden stnps fastened to the trame. AII
around the perimt sealed using an adhesive
vhich for narrow I ovides a seal essentially
lent to caulking). T ras held firmly in place by
wooden strips nailed to the sash. A thin bead of caulking sealant ensured a good acoustical seal between the wood and the glass. After application of the caulking, the wood strip was pressed firmly into place and nailed so that the thickness of the resilient layer was
-
1 mm or less.Practical window designs usually have edge constraints somewhere between the extremes of simply supported and rigidly clamped edges? and the damping provided by edge losses tends to be substantially greater than that characteris- tic of the glass itself. As reported in Ref. 1, the measured damping was near the middle of the range reported in the it is hoped that because the sealant layer was rather thin it provided little damping, so that changes asso- ciated with hardening of the sealant over the extended time period of the tests would be minimal. This study should therefore provide a reasonable estimate of the performance of "typical" windows. Of greater importance, however, was the suitability of this mounting technique for examining the dependence of TL on interpane spacing since rather similar edge constraints can be obtained reliably for a wide range of spacings. This mounting technique can, however, permit flanking transmission through the sash and the frame, as discussed later.
The data were obtained in three series of measurements
with intervals of approximately 1 year between each. Al-
though details of glass mounting and measurement proce- dures were consistent within each series, some modifications were made in the laboratory between series. The tests con- formed in all cases to the ASTM E90-75 standard, but the modifications apparently introduced small systematic changes in the sound transmission results. Reproducibility within a series and systematic differences between the series are discussed in Ref. 1. Wherever possible, detailed compari- sons of TL results to assess trends associated with variables such as glass thickness or interpane spacing are restricted to comparisons within a series. Cases where data from two or more test series are combined are specifically identified.
For ease of presentation the window glazings are identi- fied by a simple descriptive code based on nominal glass thickness and interpane spacing, in mm. A single layer of 3- mm glass would be simply denoted by "3," double glazing with two panes of 4-mm glass separated by a 50-mm air space, by "4(50)4," and so on.
II. SOUND TRANSMISSION THROUGH DOUBLE OSZING
A. General features of the data
The dependence of sound transmission through double glazing on glass thickness and on the characteristics of the
interpane cavity was examined in detail in Ref. 1. The gen-
eral trends are illustrated by the data in Fig. 2 showing the
Sound Transmission Class (STC)6 as a function of interpane
spacing for 3- and 6-mm glass.
The most obvious feature of the data is the steady in-
D U B L E 3 n D U B L E 6 n
Im G L A S S i r n G L A S S
DISTANCE B E T W E E N P A N E S , mrn
FIG. 2. Sound transmission class as a function of interpane spacing for dou- ble glazing. Open symbols denote data from the first series. Data from the second and third series are indicated by closed symbols for spacings greater than or less than 50 mm, respectively.
crease in STC with increasing spacin5 LUI szpalauulla e ~ d t e r
than
-
10 mm. This trend of approximately 3 dB perbling of separation was observed for all glass thicknc For smaller separations this trend breaks down becau resonant coupling of the two glass layers by the stiffnt
the air in the interpane cavity (commonly called the r
air-mass resonance).' For the data in Fig. 2, this resor and the related strong coupling of frequencies below tht onance strongly influence the STC for spacings less
-
20 mm.Another clear trend in the data is the increase i~ with increasing glass thickness (or masshnit area), a was maintained for all the data. The consistency of rather small differences suggests that considerable success was achieved in minimizing variations in damping, edge con- straints, leakage, and other such variables which have ob- scured the trends in previous studies. The increase with pan- el mass is appreciably less than one would expect from mass law predictions, but is consistent with the rather small de- pendence on panel mass for the sound transmission of single glazing obtained in these measurements' and elsewhere.*.'
A full tabulation of the data is available as a separate report.'
6. Comparison with predictions
--
:ss of nass- Lance e res- than n TL rhich theseNumerous procedures have been proposed for calculat- ing sound transmission loss through a double-leaf partition, but simple expressions have been derived for only certain limited cases. Some prediction models9-" assume the inter- leaf cavity to be filled with acoustically absorbing material so that the space may be treated as a simple stiffness element and cavity modes may be ignored. These models predict a 535 ' J. Acoust. Soc. Am., Vol. 74, No. 2, August 1983 J. D. Quirt: Sound transmission through windows 535
oft Pri L res :r doublir
-
-
kg of thei~
nterleaf sl..-.. - -
B increasresult significantly dltterent trom that exhlblted by the data in the present study. This difference, which is not surprising since the interpane cavities of the windows in this study were not filled with absorptive material, indicates that the effects
of cavity modes cannot reasonably be ignored.
At the other extreme is the approach of Price and CrockerI2 based on statistical energy analysis (SEA) which assumes the presence of cavity modes as a basic starting point. The fact that their model predicts no dependence on interpane spacing (in obvious disagreement with a large body :xperimental data) has been ascribed by other authorsI3 to ce and Cracker's neglecting to take into account the non- onant coupling due to stiffness of the air in the cavity.
If the cavity is not filled with absorptive material, the md transmission appears to depend not only on interpane ~cing but also on the width (w) and height (h ) of the cavity relative to the ~ a v e l e n g t h . ~ ~ ' ' ~ ' ~ To assess the trends, it is convenient to consider separately the frequency ranges above and below the "cutoff frequency" ( fl = c/2d) for
-+ch the interpane spacing (d) is one-half wavelength.
? cutoff frc
For frequencies above f, = c/2d, standing wave pat- terns are possible in all three dimensions and the cavity may be considered as a reverberant space, although the sound field will obviously not approximate random incidence very well at the low-frequency end of the range. As noted in a recent paper by Brekke,13 in this case the transmission loss for the two-leaf partition should approach
TL = TL,
+
TL,+
10 log (A /S ), (1)where TL, is the transmission loss for leaf i, A is the equiva- lent absorption in the cavity, and S is the area of the parti- tion. Brekke assumes that the partition surfaces do not con- tribute to cavity absorption, so
A = ad (2h
+
2w), (2)where a is the random incidence absorption coefficient for the perimeter surfaces and d is the interpane separation. Since S = hw, this can be rewritten as
T L = T L l +TL,+ 1 0 l o g a + 10logd
+
10 log[(h+
u)/hu]+
3 dB. (3) Tkre predicied dependence on d corresponds to the 3 dB per doubling of interpane spacing observed in the present study. Figure 3(a) illustrates the agreement between this pre- diction and the measured TL for a 6(150)6 window. The sin- gle layer TL and the absorption coefficient a required for the calculation are also presented in Fig. 3(a) and (b), respective- ly. These values of a were measured in the National Re- search Council of Canada reverberation room for an unfin- ished plywood specimen (lying on the floor) and should provide a reasonable approximation for the absorption coef- ficient where the cavity perimeter is unfinished wood. The agreement between the measured and calculated TL values in Fig. 3(a) is quite good except below 1.6kHz
(where data are apparently affected by flanking as discussed in Sec. 111).536 J. Acoust. Soc. Am.. Vol. 74, No. 2, August 1983
1 1 3 - O C T A V E C E N T E R F R E Q U E N C Y . Hz
FIG. 3. (a) Transmission loss of windows: --0-- experimental data for 6( 150)6,
- -
-predicted as discussed in text,-
-data for single layer 6-mm glass. (b) Measured absorption coefficient (a) for 19-mm unfinished plywood resting on floor of reverberation room.Similarly good agreement with Eq. (3) was observed for other values of d.
It is interesting to note that the data reported by Lon- don" appear to illustrate a dependence on cavity perimeter absorption similar to that in Eqs. (1) to (3). In that case, the two panels were attached to the concrete test walls of adja- cent test chambers, but the space between the chambers around the perimeter of the specimen was left open. For interleaf spacing d smaller than the chamber separation, the observed results agree well with the predictions of Eq. (3) using a = 1 as the absorption coefficient for the open perim- eter "surface." For d much larger than the 3-in. chamber separation, London's data show very little dependence on d .
This is consistent with Eq. (1) if one assumes that the addi- tional concrete surfaces exposed when d is appreciably greater than the chamber separation do not add appreciably to the cavity absorption.
The data obtained by Sharp9.'' (some of which are plot- ted in Figs. 4 and 5) also show quite good agreement with Eq. (3) for frequencies above
f,.
The data in Figs. 4 and 5 are for three different cavity treatments of a double-panel partition of 6.4- and 3.2-mm hardboard with interpanel separationd = 160 mm. The dashed curve in Fig. 4 showing the predic- tion of Eq. (3) with a = 1 agrees well with the experimental data for the test in which 50 mm of absorptive material was added to the perimeter surface. The data for a cavity with no J. D. Quirt: Sound transmission through windows 536
! , j i I I I
l l l l ~ ~ l l ~ l l l l L l t l
6 3 i 2 5 2 5 0 5 0 0 1K 2 K 4 K 8K
I : 3 - O C T A V E C E N T E R F B E Q U E N C Y . H z
FIG. 4. Transmission loss for a double hardboard wail as discussed in text: -U- data from Ref 9 with 50-mm glass fiber at perimeter, -0- data
from Ref. 9 with no cavity treatment, - - calculated with a = 1 , - - -
- -
calculated with a from Fig. 3(b) using Eq. ( 5 ) .
absorptive treatment agrees rather well with the dotted curve calculated using the absorption coefficients given in Fig. 3jb). Both curves in Fig. 4 were caiculated using the measured TL values for the 3.2- and 6.4-mm hardboard lay- ers given in Ref. 9.
Considering the roughness of the estimates used for ab- sorption coefficients and the questionable assumption of random incidence TL for the individual panels, the agree-
' 5 2 0 5 1 0
,'
11'
!K I ,K'1 1 3 - O C T A V E C E N T E R F R E Q U E N C Y , H z
FIG. 5. Transmission loss for a double hardboard wall: -0- data from Ref. 9 with no cavity treatment, -C- data from Ref. 9 with 0.61 X0.61 m lattice,
- - - -
calculated with a from Fig. 3(b), - -calculated with same a and h = w = 0.61 musing Eq. (5).537 J. Acoust. Soc. Am., Vol. 74, No. 2, August 1983
ingly good.
2. Below the cutot f frequent
For frequencies belowj, = c / M , the souna nela tn the
cavity is commonly treated theoretically as a two-dimen- sional standing wave system13; the analogy between this cav- ity and a reverberant room cannot be justified. Although energy flow concepts embodied in Eq. (1) seem reason2
even for frequencies below f,, the radiation efficiency 1
energy transfer from panel vibrations to the cavity soun field is not obvious, and some allowance for the effects of a
stiffness is clearly needed. Unfortunately, none of the readi I
tested theoretical models appear to provide an adeqvg treatment of all the relevant mechanisms.
Some of the basic features can be illustrated by re ence to Sharp's data presented in Fig. 5. The lower set of c and calculated curves in Fig. 5 are the same as those in Fi for the cavity with no absorptive treatment. The up
curves are for the case where the 2.7 X 4.2 m interpanel sp
was partitioned into smaller cavities with a 610x610 I
wooden "lattice." This increased the TL considerably exc
for the band (3 15 Hz) where the lattice dimension of 6 10 I
corresponds to a half-wavelength (A /2); lesser resonances
also evident at multiples of 3 15 Hz. Sharp's interpretatiol
this resultS is that the increase in TE is solely due to elimi~
ing many lateral cavity modes; however, as shown by Lne
upper calculated curve in Fig. 5, a rather similar increase in
the TL is predicted by Eq. (3) as a result of increasing the
surface area of the cavity perimeter (and hence the abscm-
tion). Presumably some combinatior, of modal changes i
cavity absorption should be considered in a thorough th retical analysis. Unfortunately Sharp tested this effect
only one interpanel separation jd = 160 mm) and hence
F
vided no information about the dependence of TL on d eit with or without the lattice. The data in the present study also for rather small lateral cavity dimensions, and shoul therefore resemble Sharp's results with the lattice, whic were intermediate between the result with an absorptior filled cavity and that for a cavity with low perimeter absoq tion and high modal density (large lateral dimensions).
For frequencies below f,, Brekke attempted to deal wit the shortcomings of previous SEA analyses by adding an empirical term 20 log(d /do) to the SEA expressions to allow for the effect of air stiffness.I3 Because his equations for this case include many factors such as radiation efficiencies whose values are not obvious (but are presumably discussed in his more detailed report),I4 they are not reproduced here.
It is worth noting, however, that his data for fQl (with ab-
sorptive treatment of the cavity perimeter) show substantial- ly less dependence on interpanel separation than is predicted by the 20 log d term. Although data for the case without edge absorbers are not presented, Brekke's comments indi- cate that agreement with his prediction was obtained by as-
suming that the absorption coefficient varied from
-
0.1 ford>O. 1 m to -0.5 at d = 0.02 m. The net effect of this vari-
able absorption coefficient and the 20 log d term in this equation is an overall dependence on spacing of approxi- mately 10 log d.
J. D. Quirt: Sound transmission through windows 537
the able for . ..2 fer- lata g. 4 'per lace are n of iat- *L - '- k' 2nd Leo- for )ro- her are
rec air
I
that two energy tl
--
ransmissic Jn mecha- -
I-pear to be operatmg m parallel here, it would seem morp reasonable to assume that the dependence of TL on d woulc lie somewhere between the 0 dB/doubling and 6 dB/dou '-'kg characteristic of the SEA and air stiffness approaches,
ipectively. A fully satisfactory treatment must allow for stiffness, and might require specific consideration of indi- vidual cavity modes (including damping) when the lateral dimensions of the cavity are not much greater than the wave- length; this would obviously require lengthy calculations.
3. Empirical prediction
If a simple empirical expression is desired, Eq. (3) ap- pears to fit experimental data from both this study and sever- al previous s t ~ d i e s . ' ~ ~ " , ' ~ Even for frequencies far below the cutoff frequency f,, this equation provides a good prediction of experimental results. Another example of this is presented in Fig. 6 for two cases where the entire frequency range is below f,. The data are for double glazing in a single sash with an unfinished wood surface at the cavity perimeter. The ab- sorption coefficients for unfinished wood [from Fig. 3(b)], and the measured TL data for a single layer of glass were used in Eq. (3) to calculate the corresponding predicted val- ues. The agreement is quite good for frequencies appreciably above the mass-air-mass resonance f, which may be calculat- ed from the expression
fo = F I(p1 +p2)/p1 p2d 1'12, F = ( 1 / 2 4 ( p ~ ~ ) ~ ~ ~ 9 (4)
where d is the interpane spacing and p , the mass per unit area of panel i. Using appropriate constants for the density p and speed of sound c of air and expressing d in m and p, in kg/m2, then F = 60.
This empirical use of Eq. (3) appears to have a low-
1 1 1 1 1 1 1 ' 1 1 1 1 1 1 ' 1 ~ 1 1 " 1 -
-
-
..".
f
4
-
-
,*,.-k
;/
-
p
/ ,
&/
\ : d o \i
-
/$
\ IL...
-
\-
Ti(:
f0
\ L- a fo 1 1 l 1 1 1 1 1 1 1 1 1 1 1 1 1 1 1 1 1 1 I may be (frequency limit, which d by either of two
~"nditions.
(1) In the frequency range below
-
2f0, air stiffness con- s sound transmission through the cavity, resulting in a3 1 1 4 dip in TL centered at f,. At frequencies below
-
fJ2,experimental data agree with the predicted TL for a single panel with mass equal to the combined mass of the two pan- els, which for TL) 10 dB may be expressed as
TL = 20 log[( p,
+
p,) f ] - 48 dB. (5) (2) If cavity absorption is very small, then the TL pre- dicted by Eq. (3) may fall below the value predicted by Eq. (5) even at frequencies appreciably above fo. In this case experi- mental data9 agree with the larger of the TL values predicted by Eqs. (3) and (5), as shown in Figs. 4 and 5.The use of Eqs. (3) and (5) as detailed above provides a satisfactory representation of the experimental results, ex- cept in the immediate vicinity of the mass-air-mass reso- nance and at the coincidence dip. At the mass-air-mass reso- nance the TL is up to
-
10 dB below the TL predicted by Eq. (5); the depth and sharpness of this resonance are apparently reduced by absorptive treatment of the cavity perimeter. Near the coincidence frequency(f,
) the dip in the TL shows much less dependence on interpane spacing and is substan- tially less pronounced than that predicted by Eq. (3). This trend is illustrated by the data in Fig. 7 for double 3-mm glazing with interpane spacings up to 19 mm; nearf,
the TL is essentially independent of d. For appreciably larger spac- ings the TL near coincidence depends more strongly on in- terpane spacing as shown in Fig. 8. Because the TL near coincidence is especially sensitive to damping (and hence to mounting conditions), the trends in Fig. 8 are partially ob- scured by the scatter in the data. However, it appears that the TL has little dependence on spacing for d<20 mm, but6 0 .50 1 I I I I I 1 l ~ l ~ l ~ ~ ~ ~ ~ ~ r ~ ~ r 50 45
-
m m u -0 Ln V) 4 0-
4 0 0 -J A Z Z 0 0 3 5-
-
-
cn m 0 V) '-
a-
30 05
3 0 --
Z a 4 rn rn + + 25-
A 2 0 3 0 Ln 20-
-
t 1 0 6 3 1 2 5 2 5 0 5 0 0 1 K 2 K 4 K 8 K'
0 1 1 3 - O C T A V E C E N T E R F R E Q U E N C Y , H z l5 S:C :3 '1:5 I '2:01 '5:O I 1; I '2; I i K I'
8; 1 1 3 - O C T A V E C E N T E R F R E Q U E N C Y . H ZFIG. 6. Transmission loss for double windows: U data for 3(3)3 windows,
- - -
-calculated for 3(3)3 window with a from Fig. 3(b), 4- data for 3(19)3 FIG. 7. Transmission loss of double 3-mm glazing with small interpane window, --calculated for 3(19)3 window with a from Fig. 3(b). spacing:A-
-
-A
data for 3(13)3,0- -0 data for 3(6)3, 0--• data for 3(3)3.D I S T A N C E B E T W E E N P A N E S , mrn
FIG. 8. Transmission loss in the 4-kHz third-octave band for double 3-mm glazing, as a function of interpane spacing. Data from the k t and third series are denoted by open and solid circles, respectively.
increases with increasing d above this range. A similarly re- duced dependence on interpane spacing is evident in Brekke's data around the coincidence dip. The apparent fai- lure of
Eq.
(3) in this frequency range is not surprising, given the well-known dependence of the coincidence effect on the angle of incidence and the obvious deviation from random incidence of the sound field in the interpane cavity, especial- ly for very small interpane spacings.Ill. COMPARISON OF DOUBLE AND TRIPLE GLAZING
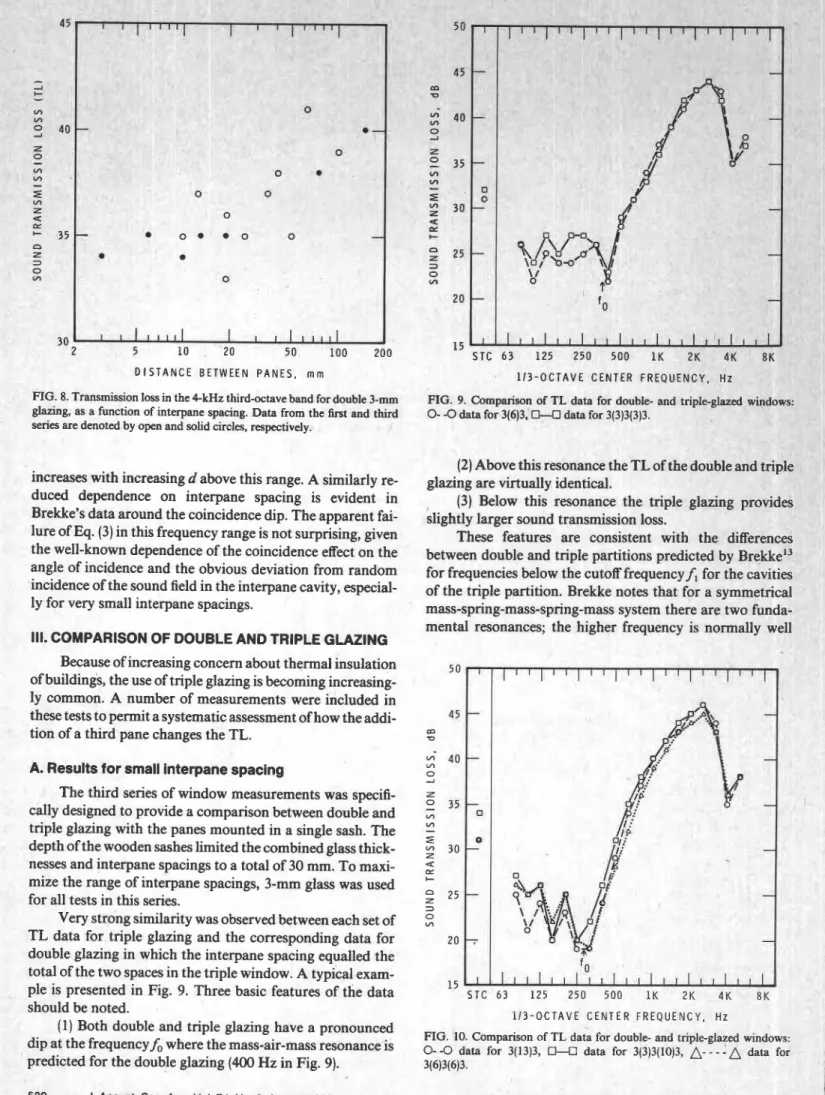
Because of increasing concern about thermal insulation of buildings, the use of triple glazing is becoming increasing- ly common. A number of measurements were included in these tests to permit a systematic assessment of how the addi- tion of a third pane changes the TL.
A. Results for small interpane spacing
The third series of window measurements was specifi- cally designed to provide a comparison between double and triple glazing with the panes mounted in a single sash. The depth of the wooden sashes limited the combined glass thick- nesses and interpane spacings to a total of 30 mm. To maxi- mize the range of interpane spacings, 3-mm glass was used for all tests in this series.
Very strong similarity was observed between each set of TL data for triple glazing and the corresponding data for double glazing in which the interpane spacing equalled the total of the two spaces in the triple window. A typical exam- ple is presented in Fig. 9. Three basic features of the data should be noted.
(1) Both double and triple glazing have a pronounced dip at the frequency
f,
where the mass-air-mass resonance is predicted for the double glazing (400 Hz in Fig. 9).539 J. Acoust. Soc. Am., Vol. 74, No. 2, August 1983
15
S T C 6 3 1
FTG. 9. Comparison of TL data for double- and triple-
0- -0 data for 3(6)3,0--0 data for 3(3)3(3)3.
of the do^ H z glazed win< ~ble and t~ lows: riple (2) Above this resonance the TL
glazing are virtually identical.
(3) Below this resonance the triple glazing prov slightly larger sound transmission loss.
These features are consistent with the differel between double and triple partitions predicted by Brekke13 for frequencies below the cutoff frequency
f,
for the cavities of the triple partition. Brekke notes that for a symmetrical mass-spring-mass-spring-mass system there are two f u ~ ' mental resonances; the higher frequency is normallyS T C 6 3 125 2 5 0 5 0 0 1 K 2 K 4 K 8 K 1 1 3 - O C T A V E C E N T E R F R E Q U E N C Y , H z FIG. 10. Comparison of TL data for double- and triple-glazed win1
0- -0 data for 3(13)3, 0 - 4 data for 3(3)3(10)3,
A-
--
- A
dat3(6)3(6)3.
,ides nces
ma- well
*
S T C 6 ? 2 5 0 50C 2 K 4 K 8 K 1 1 3 - O C T A V E C E N T E R F R E Q U E N C Y . H zFIG. 11. TL for triple 3-mm glazing minus TL for double 3 - m m glazing whose intemane sewation =. the combined separations of the triple glaz-
x
S T C 6 3 1 2 5 2 5 0 5 0 0 1 K 2 K 4 K 8 K ing. The glass is mounted in single sashes (Fig. 1 (and total separations A g e
from 6 to 2 0 mm. Crosses and circles indicate differences in TL for specific pairs of windows in frequency bands above and below f,, respectively.- any
symbols are superimposed due to integer rounding of TL. Thebars show a
range of one-standard deviation about the mean. 1 1 3 - O C T A V E C E N T E R F R E Q U E N C Y , H Z
FIG. 12. TL for triple 3(6)3(a)3 glazing minus TL for double 3(b )3 glazing where the interpane spacing b z a
+
6 mm. Glass is mounted in double sash-es as shown in Fig. 1. Symbols are used as in Fig. 1 1 with the addition that is used to denote the differences for a specific pair of windows for frequency bands above the cutoff frequency f, for the larger interpane spacing of the above the range of interest,14 and the lower resonance fre-
quency corresponds to that predicted by Eq. (4) with d re- placed by the sum of the two panel separations. This predic- tion is supported by the data from this study, as illustrated in Fig. 9.
Brekke also states that this expression for fo provides a good estimate for the lowest resonance frequency even for unsymmetrical partitions. l3 A test of this is shown in Fig. 10.
The window with identical interpane spaces has a slightly lower TL over most of the frequency range but the differ- ences do not exceed the nominal measurement reproducibil- ity, except in the immediate vicinity of fo where the mini- mum appears to be at a slightly higher frequency for the symmetrical window. The TL differences between the sym- metric and asymmetric cases are very small, however, and comparison with the data for the corresponding double- glazed window emphasizes the similarity of its TL to that for each triple-glazed window.
A summary of the differences between the results for the four pairs of double- and triple-glazed windows in this \series is presented in Fig. 11. The individual circles and crosses show the difference in TL for specific pairs of win- dows at frequencies below and above
f,,
respectively. The bars indicate the range of one-standard deviation about the mean. At frequencies below f,, the triple glazing exhibits a quite consistent small increase in TL relative to the double glazing, but there are no significant differences above 500 Hz.triple glazing.
19 to 100 mm. This configuration was chosen because of its potential application for windows in residential buildings, for which the use of hermetically sealed double glazing (with interpane spacings
<
15 mm) is common. The addition of a third pane in a separate sash is particularly attractive for retrofitting existing windows to improve noise reduction, but might also be considered in new construction to achieve both good thermal performance and noise reduction using available components.Although the asymmetric configurations tested are of considerable practical interest, the difference in interpane spacing complicates comparison with the simple expressions proposed by Brekke.13 He predicts a substantial increase in TL due to the addition of a third pane for frequencies above the cutoff frequency (f,) of both interpane spaces and pre- sents data to support this feature of his model. This cannot be tested with data from the present study, because fl for the
smaller interpane cavity of these windows is above the fre- quency range studied.
The differences between the TL results for six pairs of double- and triple-glazed windows with 3-mm glass and the same total interpane spacing are shown in Fig. 12. As in Fig. 1 1, the individual circles and crosses show the differences in TL below and above f,, respectively, and the bars indicate the range of one-standard deviation about the mean. As not- ed above, the larger interpane spacing for the windows ranged from 19 to 100 mm; data for frequency bands above the cutoff frequency f l for this cavity are indicated in Fig. 12
by triangles. There is no obvious dependence of the increase in TL on whether or not the larger cavity is above cutoff. There is, however, a very obvious increase in TL due to the
B. Results for large interpane spacing
The data for larger interpane spacings are for asymme- tric spacing of the three layers of the triple glazing. As shown in Fig. 1, the windows consisted of a double-glazed unit [3(6)3] in one sash and an additional pane in a separate sash with interpane spacings for the second cavity ranging from
different
-
1 kH; A11 * rency simi- bina- :rved ties is less pronounced and spreaa over a broader frequI
range. Since the coincidence dip for these windows is larly broader and less pronounced (because of the com tion of 3- and 6-mm glass), this suggests that the obsc ce between the TL of double and triple glazing a
z is associated with the coincidence effect. though there do appear to be some consi cnanges in sound transmission loss introduced by the i
tion of a third pane, plots like Figs. 12 and 13 tend to ove phasize the dissimilarities. It should be stressed that fo
1
cases studied here the TL data for double- and triple-gl windows were very similar, as illustrated by the curves
sented in Fig. 14, which exhibit differences similar tc
.
mean result for their group given in Fig. 13.IV. ASSESSMENT OF FLANKING
Although it is not believed that me aata in this s' ' S T C 6 3 125 250 500 1 K 2 K 4 K 8 K were severely affectkd by flanking transmission, then
some indications that flanking may have reduced the 'I
1 1 3 - O C T A V E C E N T E R F R E Q U E N C Y , H z
some cases.
FIG. 13. TL for triple 3(6)3(a)6 glazing minus TL for double 3(b)6 glazing Tests were made with heavy blocking panels insertc
where the interpane spacing b--a
+
6 mm. Glass IS mounted in double sash-the window openings to obtain an estimate of sound tl es as shown in Rg. 1. Symbols are used as in Fig. 12.
mission through the filler wall in which the window fr was mounted. The resulting TL values (normalized tc addition of the third pane in the immediate vicinity of the window area) were sufficiently greater than any of the cc
coincidence dip at
f,
-
4 kHz. sponding window TL data to permit the conclusionComparable data with mismatched glass are presented flanking through the wall could not affect the result in Fig. 13. Here triple glazing consisting of a 3(6)3 double- more than 1 dB (and would be even less if the "bloc1 glazed unit together with a pane of 6-mm glass is compared windows transmitted a significant fraction of the sound I with double 3(b )6 windows whose spacing b approximately er in this flanking test).
equals the combined interpane spacing of the triple glazing. Subsequent considerations suggest that the absenc At frequencies below 1.6 kHz the differences resemble those flanking transmission was not clearly established. FOI in Fig. 12, but the improvement in TL at the higher frequen- test of flanking the blocking of the window openings conasr-
ed of a window with 6-mm glass at one extreme of the frame, and a multilayer blocking panel (-30 kg/m2) at the other ibove 5 5 50 m D
-
4 5 V) "l 0 I 2 40 0-
V) "l-
3 52
z2
30 + n z 3 2 5 o I/) 20 15 stent aaai- :rem- a the l,,"~rlS T C 6 3 125 250 5 0 0 1K 2K 4~ 8~ quency data were not strongly affected. It appears, however, 1 1 3 - O C T A V E C E N T E R F R E Q U E N C Y , H Z that the midfrequency (800 HZ to 2 kHz) TL data were af- FIG. 14. Comparison of TL data for double- and tri~le-~lazed windows fected by flanking. This is suggested both by the diminished mounted in double sashes: 0-0 data for 3(35)6,0- -0 data for 3(6)3(25)6. dependence of the 1/3-oct TL data on interpane spacing
54 1 J. Acoust Soc Am , Vol. 74, No. 2, August 1983 J D. Quirt: Sound transmission through wlndows 54 1
I pre- the
extreme with glass fiber batts filling the intervening 150 mm cavity. Removing the blocking panels for actual window tests exposed a substantial part of the window frame. Recent tests of possible flanking through the specimen test frame at this laboratory15 and similar full-scale16 and model-scale1' tests elsewhere suggest that such an exposed surface may introduce significant flanking.
Although this possibility was overlooked at the time of the window TL measurements, the data obtained do provide some informati011 o11 the flanking limit, The ~ncrease in TI
due to covering the surface of the cavity perimeter with glass fiber (presented in Fig. 20 of Ref. 1) exceeds 3 dB for frequen- cies above 2 kHz, indicating that airborne transmission through the cavity is the dominant mechanism. The smaller improvements observed below 2 kHz were presumably due to both increased flanking transmission and the lower ab- sorption coefficient of the glass fiber at lower frequencies. The strong dependence on interpane spacing of the 1/3-oct TL data for bands below 800 Hz suggest that the low-fre-
r
-
-
-
-0 o-
-
-
) the m e - that 1 1 1 1 ' ~ 1 1 1 1 " 1 ' 1 1 1 1 1 ~ 1 1 P 8 4 8-
I :
77
a I q", b-
1
(especially tor d>>u mmJ ana by tne rrequency dependence of the TL data for individual windows. For large interpane spacings, the latter approach the 6 dB per frequency-dou- bling characteristic of flanking transmission in the 800 Hz to 2 kHz range.
Taking these apparent flanking effects into account reinforces confidence in the conclusion drawn about the gen- eral agreement of the data with the predictions of Eq. (3). Further, it should be noted that although these effects com-
r plicate comparison with theories that ignore flanking, they
,
do not invalidate using these data to predict the performance of typical windows in buildings, because comparable flank-I
ing effects are probable in most cases.Experimental sound transmission loss data for double- glazed windows have been compared with the predictions of several theoretical models. Simple equations that provide a satisfactory empirical fit to the data were found. The trans- mission loss of double glazing was compared with that of triple glazing; the results are very similar when the combined interpane spacings of the triple window match the spacing of the double glazing. The triple glazing did, however, exhibit c~nsistently higher transmission loss both at frequencies be- iow the mass-air-mass resonance and in the vicinity of the coincidence dip.
'J. D. Quirt, "Sound Transmiss~on through Windows: I. Singleand Double
Glazing," J. Acoust. Soc. Am. 72, 834-844 (1982).
'J. A. Marsh, "The Airborne Sound Insulation of Glass: Part 1," Appl.
--
C
54 2 J. Acoust. Soc. Am., Vol. 74, No. 2, August 1983
Acoust. 4 , 5 5 - 7 ~ ( 1 ~ 11); - - r a n L;, ~ p p ~ . ~ c o u w . 4, 131-154 (1971); "Part
3," Appl. Acoust. 4, 175-192 (1971).
3ASTM E90-75, "Laboratory Measurement of Airborne Sound Transmis-
sion Loss of Building Partitions," Am. Soc. Test. Mater., Philadelphia,
PA (1975).
4W. A. Utley and B. L. Fletcher, "Influence of Edge Conditions on the
Sound Insulation of Windows," Appl. Acoust. 2, 131-136 (1969). 'W. A. Utley and B. L. Fletcher, "The Effect of Edge Conditions on the
Sound Insulation of Double Windows," J. Sound Vib. 26,63-72 (1973). 6ASTM E413-73 "Determination of Sound Transmission Class," Am. Soc.
Test. Mater., Philadelphia, PA (1973).
'E. Eisenberg, "The Sound Insulation of Glasses and Glazing: I. Firmly Fitted Single Glazing," Glastech. Ber. 31,297-302 (1958).
'J. D. Quirt. "Measurements of the Sound Transmission Loss of Windows, National Research Council of Canada, Division of Building Research," Building Research Note 172 (April 1981).
9B. M. Sharp, "A Study of Techniques to Increase the Sound Insulation of Building Elements," Rep. PB-222829, U.S. Department of Housing and Urban Development (1973).
'OB. M. Sharp, "Prediction Methods for the Sound Transmission of Build- ing Elements," Noise Control Eng. 11, 53-63 (1978).
"A. London, "Transmission of Reverberant Soung through Double
Walls," J. Res. Natl. Bur. Stand. 44, 77-88 (1950).
''A. J. Price and M. J. Crocker, "Sound Transmission through Double Pan-
els Using Statistical Energy Analysis," I. Acoust. Soc. Am. 47, 683-693
(1970).
"A. Brekke, "Calculation Methods for the Transmission Loss of Single, Double and Triple Partitions," Appl. Acoust. 14, 225-240 (1981). I4A. Brekke, "Sound Transmission through Single and Double Walls" (in
Norwegian), Acoustics Laboratory, University of Trondheim, Norway, ELAB Rep. STF44 A79060 (1979).
15A. C. C . Warnock, "Influence of Specimen Frame on Sound Transmission Loss Measurement," Appl. Acoust. 15,307-314 (July 1982).
'6?. Royle, "Investigation of Flanking Transmission in the Horizontal and
Vertical Test Suites at British Gypsum," in Proceedings of the institute of
Acoustics (3 May 1979), pp. 8-1 1.
17N. Michelsen, "The Effects of Laboratory Design on the ~ e a s u r e d ~ o u n d Reduction Index," Lydteknisk Laboratorium, Denmark, Rep. No. 18 (1979).
T h i s publication is being d i s t r i b u t e d by t h e Division of Building R e s e a r c h of t h e National R e s e a r c h Council of
Canada. It ehould not b e r e p r o d u c e d i n whole o r in p a r t
without p e r m i e a i o n of t h e o r i g i n a l p u b l i s h e r . T h e Di-
v i s i o n would b e glad t o b e of a s s i e t a n c e i n obtaining s u c h p e r m i e s i o n .
P u b l i c a t i o n s of t h e Division m a y b e obtained by m a i l - ing t h e a p p r o p r i a t e r e m i t t a n c e (a Bank, E x p r e s e , o r P o s t Office Money O r d e r , o r a cheque, m a d e p a y a b l e to t h e R e c e i v e r G e n e r a l of Canada, c r e d i t NRC) to t h e N a t i o n a l R e s e a r c h Council of Canada, Ottawa. K1A 0 R 6 .
Stamps a r e n o t a c c e p t a b l e .
A l i s t of a l l publications of the Division is a v a i l a b l e and m a y b e obtained f r o m t h e P u b l i c a t i o n s Section, Division of Building R e s e a r c h , National R e s e a r c h Council of